
Imported grades and new local channels define demand
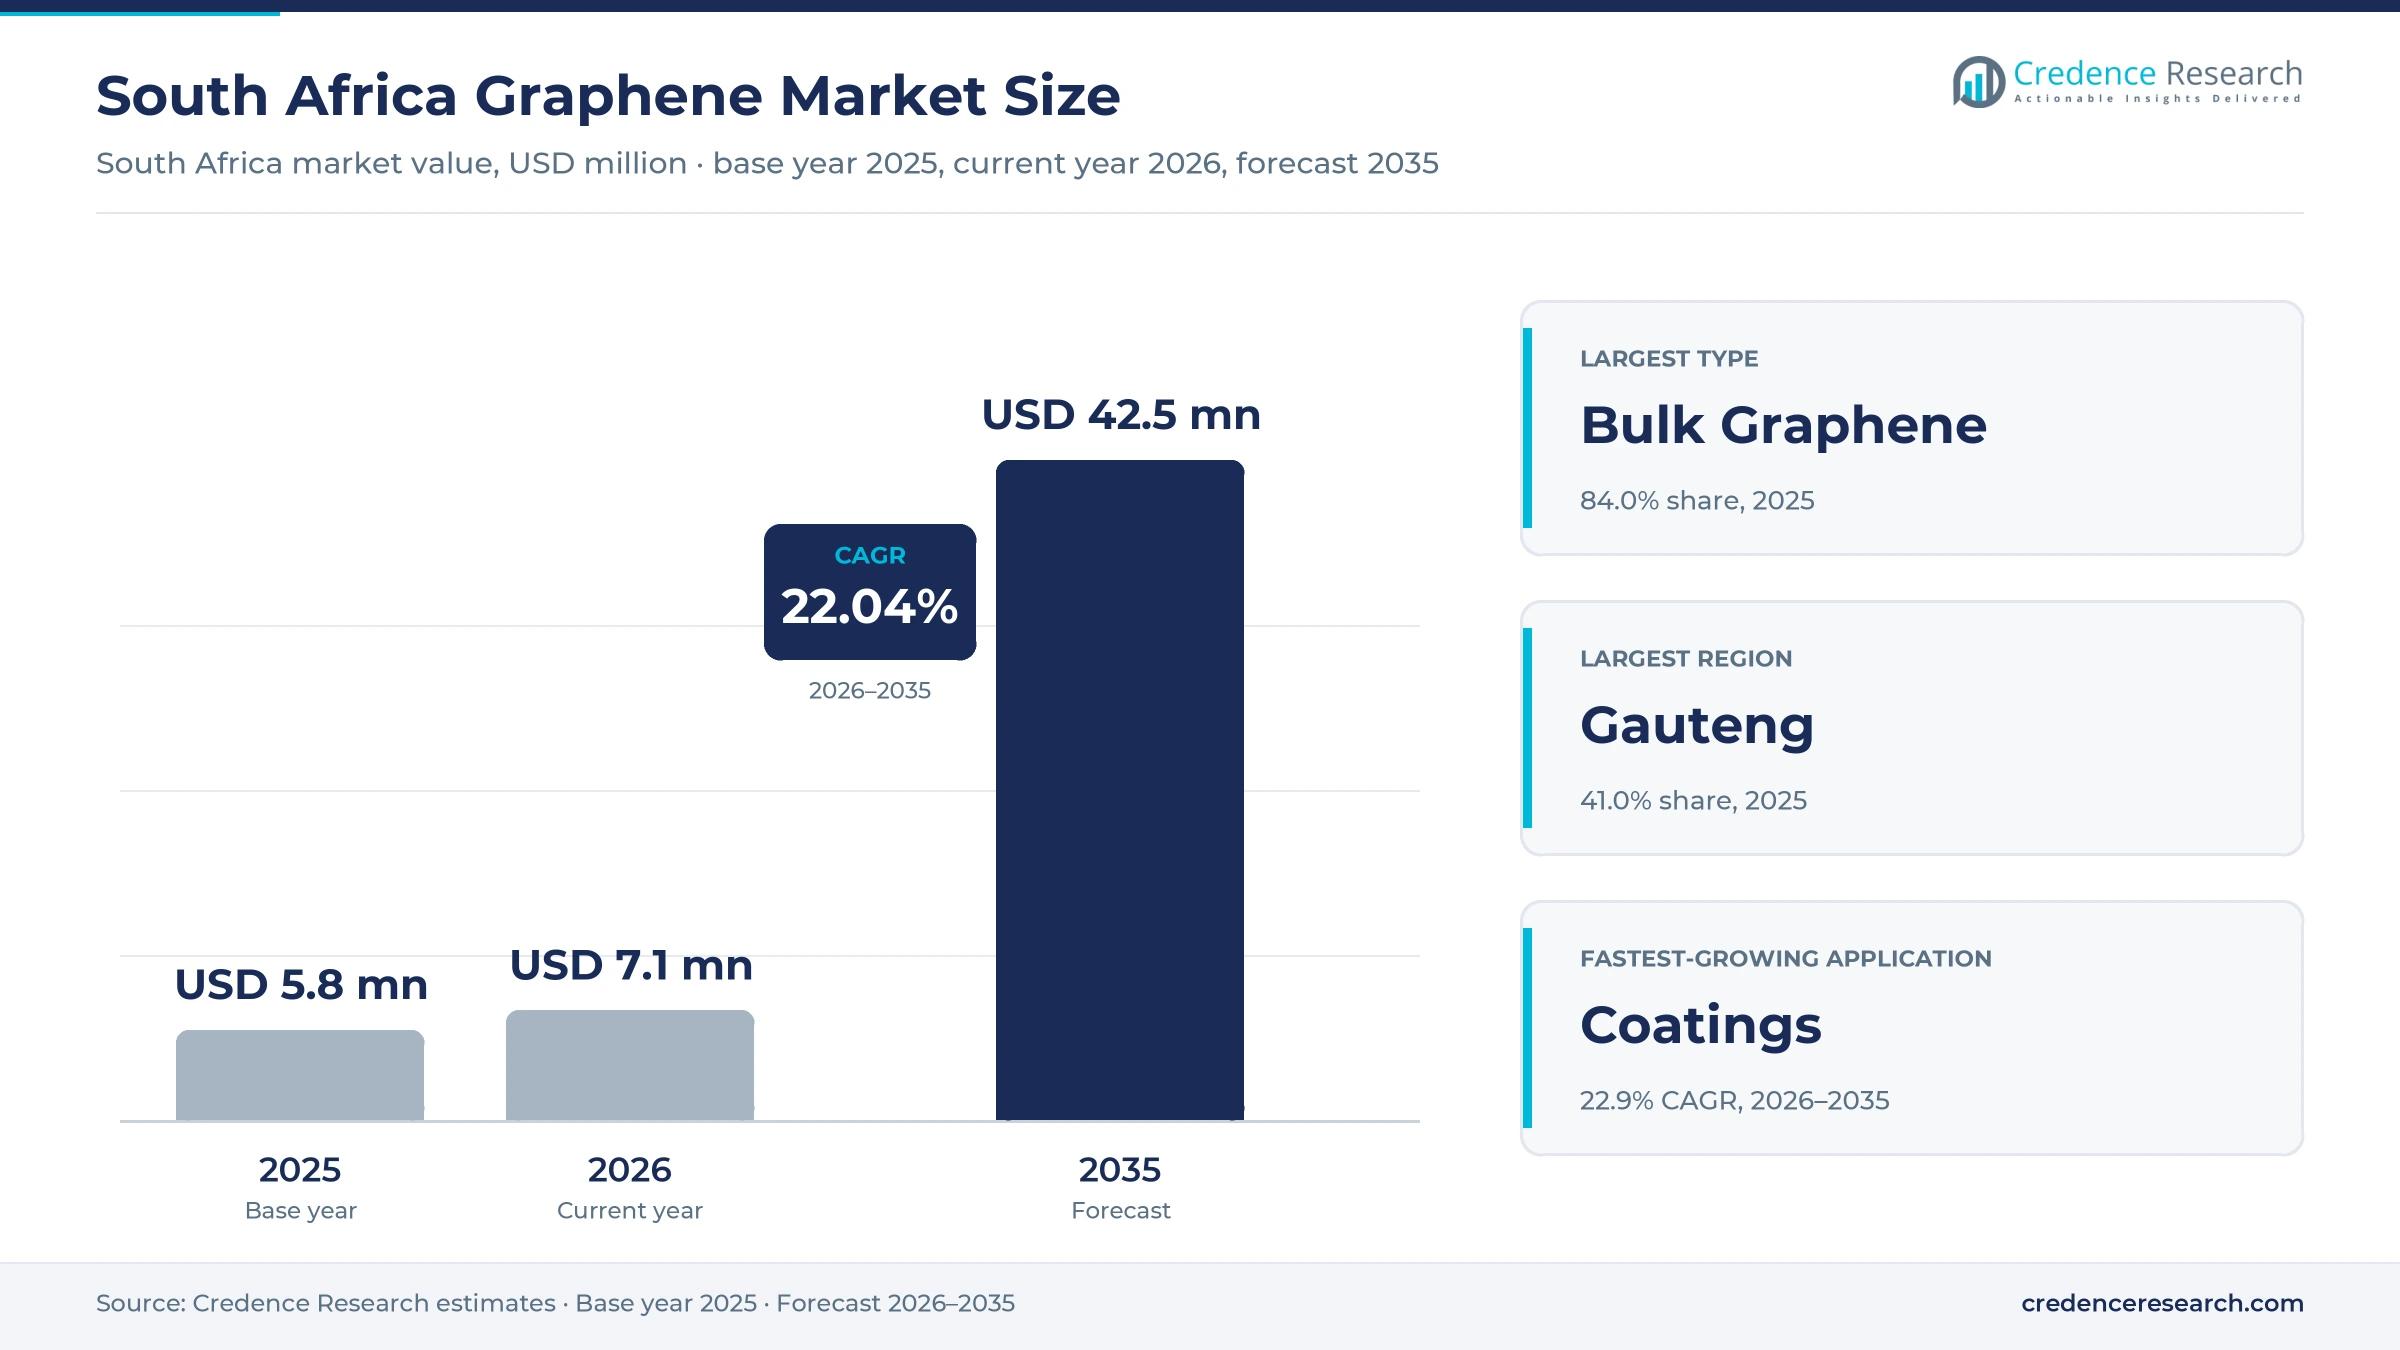
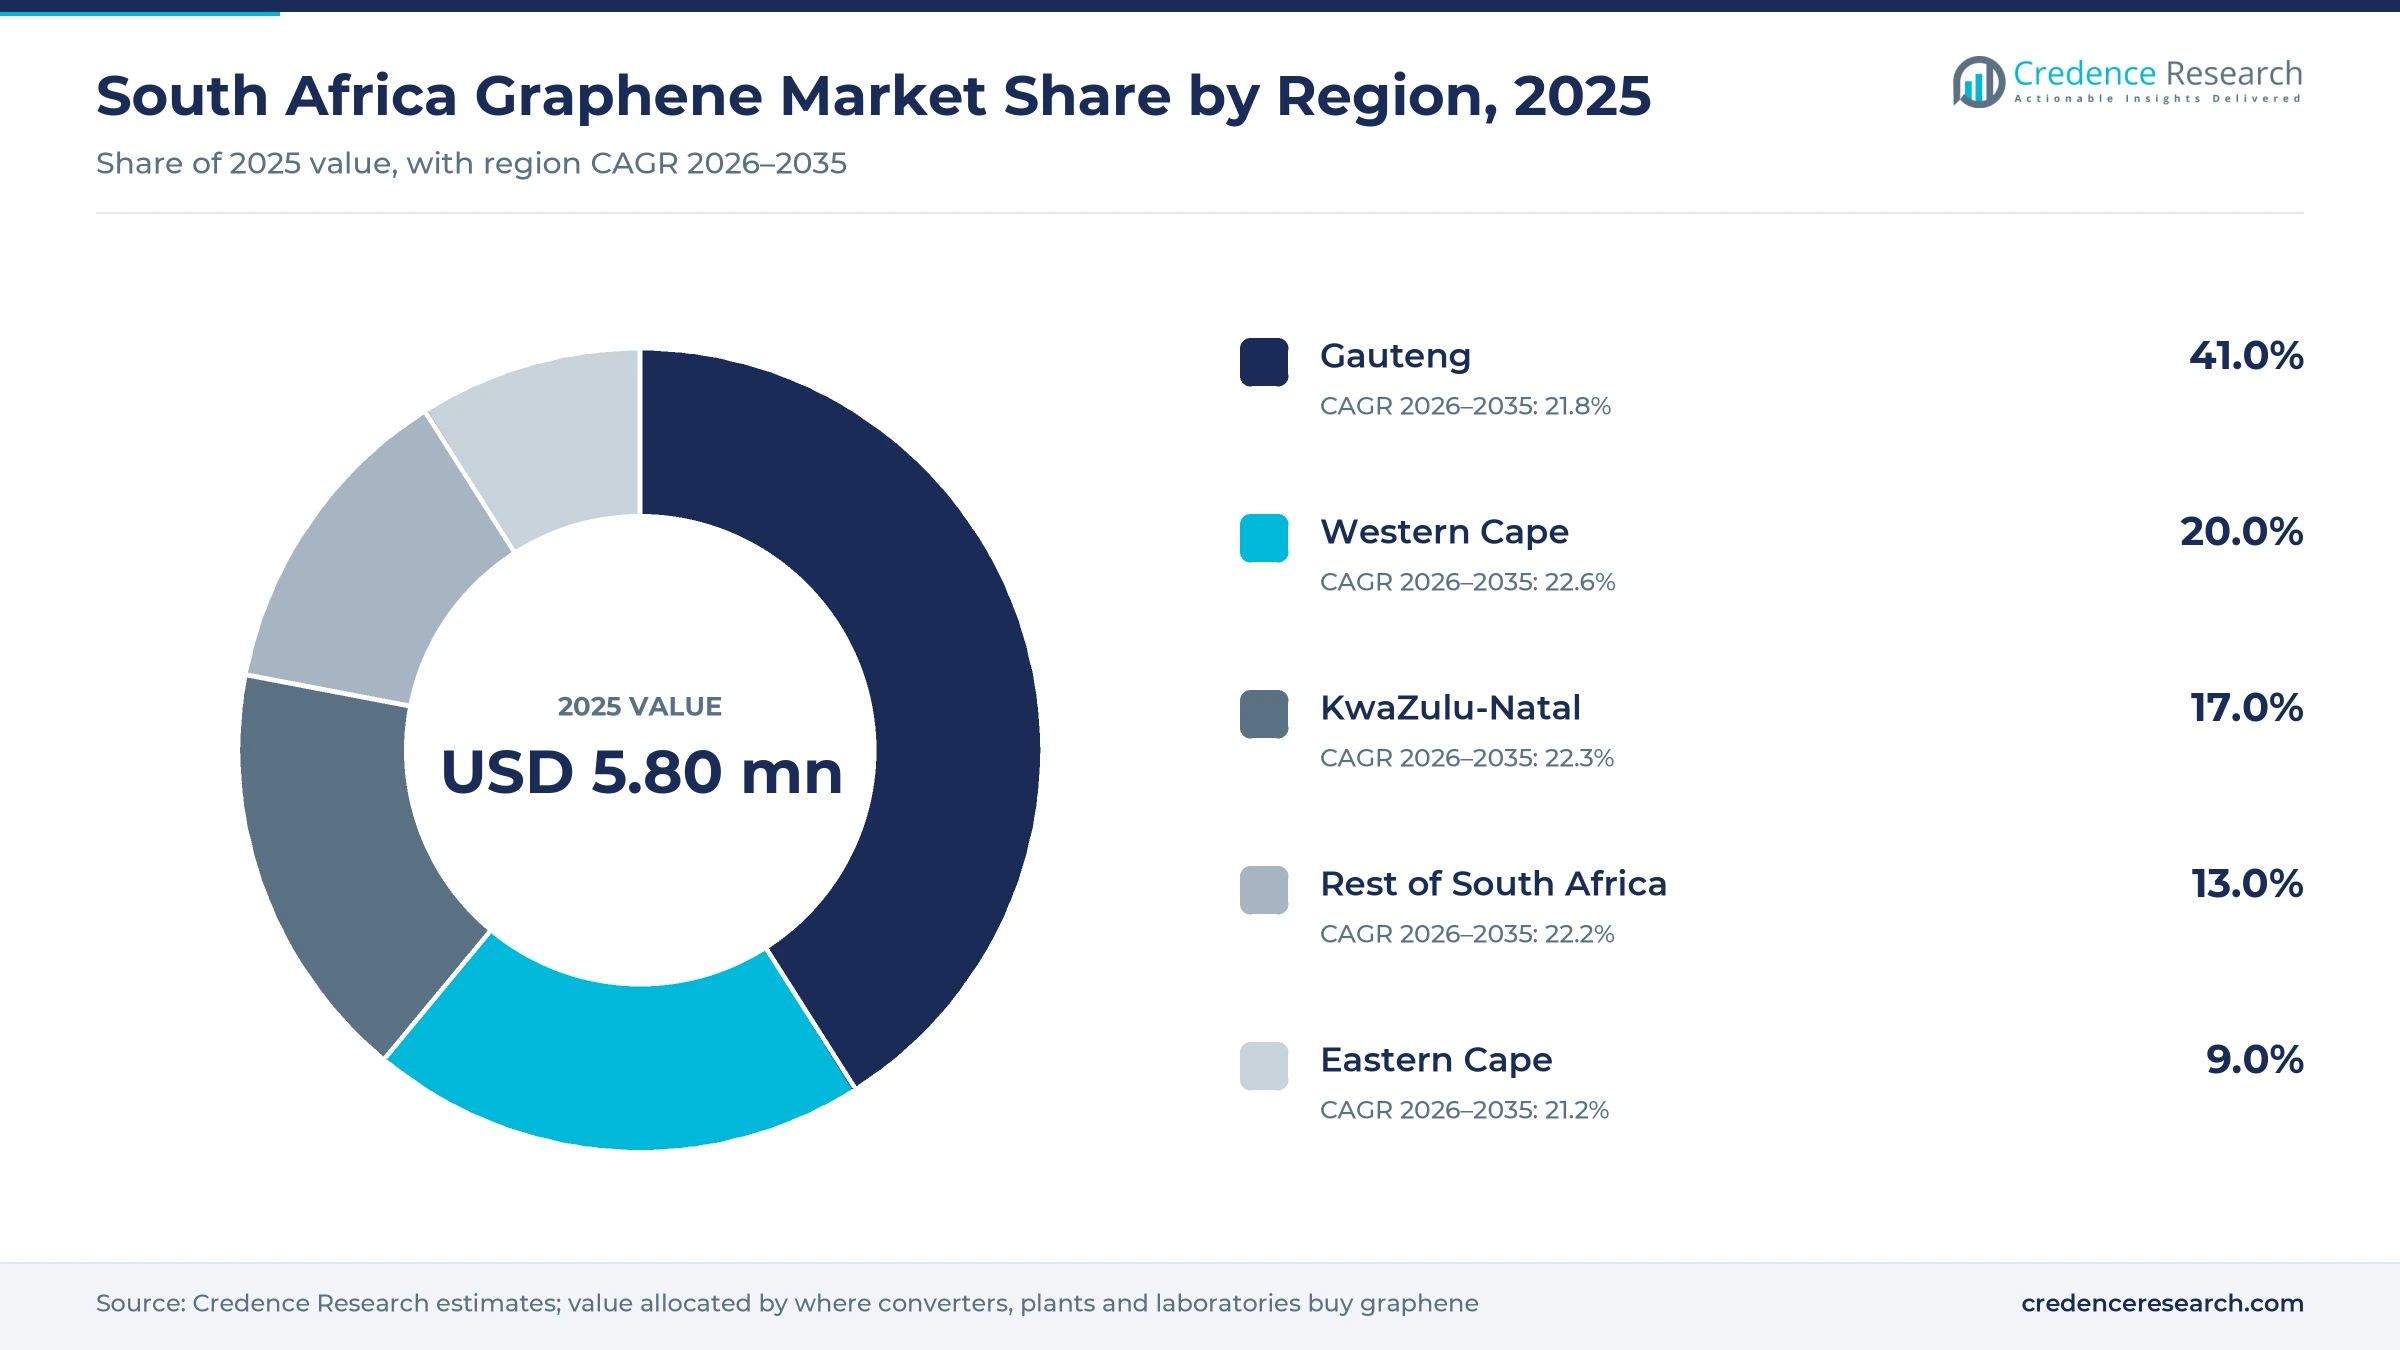
The South Africa graphene market was valued at USD 5.80 million in 2025 and is projected to increase from USD 7.08 million in 2026 to USD 42.5 million by 2035, registering a CAGR of 22.04% during 2026–2035. Demand comes mainly from plastics converters, coatings formulators, automotive part makers and research laboratories that buy imported graphene nanoplatelets, graphene oxide and CVD films in small lots. Gauteng held the largest regional share, 41.0% in 2025, because the CSIR, SabiNano and the largest share of national manufacturing sit in the province. Western Cape is the fastest-growing region at 22.6% a year, helped by university laboratories and coatings converters. The main commercial change came in 2025, when a South African masterbatch maker signed to distribute graphene-enhanced concentrates, turning graphene from a sample-only material into a product that local converters can order and dose on existing extrusion lines.
Why does South Africa still buy most of its graphene from abroad?
Local supply is limited to pilot-scale synthesis at the CSIR and a few small nanomaterial firms, so buyers import most nanoplatelets, oxide powders and films from producers in the U.K., Canada, Spain and Australia. Prices are set in U.S. dollars and sold per kilogram for powders and per wafer for films, which makes order size and the exchange rate central to cost.
Industrial buyers rarely use raw powder, because uniform dispersion needs compounding equipment and know-how that most converters lack. Value therefore concentrates in masterbatches, dispersions and admixtures, while research buyers pay high per-gram prices for characterized grades. The market counts graphene materials and graphene concentrates, not the finished parts that contain them.
South Africa Graphene Market Insights
- The South Africa graphene market grows from USD 5.80 million in 2025 to USD 42.5 million by 2035 at a 22.04% CAGR, from a small base dominated by imported grades.
- Gauteng held 41.0% of 2025 value, reflecting its 40% share of national manufacturing value added and the CSIR base in Pretoria.
- Bulk graphene held 84.0% of 2025 value, because nanoplatelets and oxide powders cost far less per gram than monolayer films.
- In August 2025, Ferro South Africa signed a five-year non-exclusive deal to distribute Black Swan graphene masterbatches locally.
- Foreign producers compete in South Africa through local compounding and distribution partners rather than plants, so channel access and technical service decide who wins graphene orders.
Bulk platelets lead while coatings uses grow fastest
Segment shares and growth rates are Credence Research estimates built from product prices, channel activity and the industries that buy graphene grades in South Africa. The split reflects how each grade is priced and dosed, not research activity, so industrial channels weigh more than laboratory purchases.
Why do bulk platelets dominate graphene purchases?
Based on type, the market is categorized into bulk graphene and monolayer graphene. Bulk Graphene led with 84.0% of 2025 value because industrial buyers dose it by weight into polymers, resins and cement, where cost per kilogram decides adoption. ACS Material said in November 2025 that industrial bulk nanoplatelets trend toward about USD 0.10 per gram, against USD 10 to 50 per gram for small research lots. Bulk Graphene also grows fastest at 22.3% a year as masterbatch and admixture channels open, while monolayer films stay tied to laboratory budgets and sensor prototypes.
Composites lead while coatings uses expand
Based on application, the market is categorized into composites, coatings, sensors, catalysts and radio frequency identification (RFID). Composites led with 40.0% of 2025 value because polymer nanocomposites are the key focus of the CSIR graphene platform, and converters can source composite grades locally since the August 2025 Ferro distribution deal. Coatings grows fastest at 22.9% a year as Ferro South Africa, which also makes VEDOC thermosetting powder coatings, has distributed graphene nanoplatelets to local formulators under an August 2025 agreement, giving coatings plants a domestic source for anti-corrosion and barrier trials.
Automotive buyers lead and other industries grow fastest
Based on end user, the market is categorized into automotive, electronics, aerospace and defense, biomedical and healthcare, and others. Automotive led with 29.0% of 2025 value because the EU and U.K. take 57% of all light vehicles built in South Africa, according to naamsa data reported by TimesLIVE in February 2026, and those export programs set strict weight and durability targets for polymer parts. Others, covering packaging, infrastructure and consumer goods, grows fastest at 23.0% a year as Ferro South Africa targets those sectors with graphene masterbatches.
| Segment Group | Leading Sub-segment | Share, 2025 | Fastest-growing Sub-segment | CAGR, 2026–2035 |
|---|---|---|---|---|
| By Type | Bulk Graphene | 84.0% | Bulk Graphene | 22.3% |
| By Application | Composites | 40.0% | Coatings | 22.9% |
| By End User | Automotive | 29.0% | Others | 23.0% |
Per-kilogram powders and per-wafer films set prices
Graphene prices in South Africa follow two distinct commercial models. Powders and oxides are sold per kilogram with steep volume breaks, while CVD films are sold per wafer or sheet, so the same budget buys very different amounts of material. Most grades are imported and priced in U.S. dollars, which adds freight, import charges and distributor margins to list prices. The table shows published list prices, not the negotiated contract rates that large buyers obtain. The gap between graphite feedstock at a few hundred dollars per metric ton and platelets at more than USD 100 per kg shows where margins sit, which is in processing, grading and dispersion rather than in raw material.
| Product or input | Typical price or fee | Basis |
|---|---|---|
| Industrial graphene nanoplatelets, 6 to 10 layers | USD 200 per kg at 1 kg, USD 100 per kg above 100 kg | Cheap Tubes list price, 2026 |
| Monolayer CVD graphene on copper foil, 4-inch wafer | USD 399 per wafer; USD 849 on quartz | Cheap Tubes list price, 2026 |
| Graphene oxide | USD 50 to 200 per g research grade; about USD 1,000 per kg or less industrial | ACS Material guide, November 2025 |
| Flake graphite feedstock, Balama | USD 625 per metric ton average realized price | Syrah Resources via Club of Mozambique, Q3 2025 |
Request a Free Sample
Fill in your details and we'll send you a free sample report.
- Sample data tables & charts
- Research methodology
Masterbatch supply, car exports and CSIR capacity lift use
Local masterbatch distribution lowers the adoption barrier
A locally available masterbatch removes the biggest barrier for converters, which is dispersing a nanomaterial without new equipment. In August 2025, Black Swan Graphene and Ferro South Africa signed a five-year non-exclusive agreement under which Ferro distributes graphene-enhanced masterbatches and nanoplatelets across South Africa. Ferro already manufactures plastics masterbatches, so graphene arrives in the pellet format that injection molders, pipe makers and film extruders already dose on their existing lines. Ferro managing director William Shipway said the masterbatches improve strength, barrier and impact resistance. Composites held 40.0% of 2025 value, and a ready-to-dose format favors converters that want South Africa graphene trials without new capital spending.
Record vehicle exports sustain demand for lighter parts
Vehicle export programs create the largest pool of buyers that pay for lighter and tougher polymer parts. South Africa exported a record 414,268 light vehicles in 2025, according to naamsa figures reported by TimesLIVE in February 2026, with Europe taking the bulk of those shipments. Exports equaled 70.3% of domestic light vehicle production, which ties local component makers to European weight and durability standards. New energy vehicle sales also reached 16,716 units in 2025, and naamsa welcomed a 150% tax deduction for new energy vehicle investment. Battery housings, thermal interfaces and conductive plastics are the parts where graphene additives compete, so suppliers serving export plants are the natural first adopters.
CSIR synthesis and scale-up capacity support local supply
Public synthesis capacity gives local buyers a domestic test supplier and reduces dependence on imported samples. The CSIR Centre for Nanostructures and Advanced Materials began local graphene production in 2019 and reached 1 kg batches of graphene oxide and reduced graphene oxide using a modified Hummers method. The DST-CSIR Nanomaterials Industrial Development Facility in Pretoria scales laboratory batches of 200 g to production of more than 200 kg, according to the government launch statement. The CSIR lists composites and batteries among the target uses for its locally made graphene oxide. This base supports formulators that need local testing, although volumes remain far below industrial plant scale.
Cement import pressure encourages higher-value additives
Import competition pushes South African cement and concrete producers toward products that justify a price premium, and graphene additives offer one route. First Graphene released a waterproofing additive containing PureGRAPH to the South African cement and concrete market in October 2025, according to StatNano. The International Trade Administration Commission found dumping margins of about 90% for cement from Mozambique and about 37% from Vietnam, Nairametrics reported in September 2026. PPC reported weaker South African cement volumes in the five months to August 2026. Graphene-dosed waterproofing admixtures give local producers a durability claim that imported bulk cement cannot easily match, which favors ready-mix suppliers on infrastructure contracts.
Ready-to-dose formats and graded specs reshape buying
Producers shift toward ready-to-dose concentrates
Graphene producers are shifting from selling raw powder to selling concentrates that fit existing processes, creating openings for compounded grades across plastics, coatings and resins. Thomas Swan became a global non-exclusive distributor of Black Swan Graphene nanoplatelets and masterbatches in August 2025, marketing them through its Polymer Performance Solutions division, Investing News Network reported. Black Swan says its processing technology was developed by Thomas Swan over the last decade, and Thomas Swan owns about 11% of its shares. Universal Matter completed its purchase of the Applied Graphene Materials dispersion businesses in March 2023, PCI Magazine reported. For South African masterbatch and compound makers, this means more grades arrive pre-dispersed.
Graded specifications emerge as a purchasing criterion
Industrial buyers are shifting from brand-led sampling to specification-led purchasing, because graphene grades vary widely in layer count and flake size. The ISO technical specification ISO/TS 21356-1, published in March 2021, sets measurement protocols for layer number, lateral flake size, disorder, layer alignment and specific surface area of graphene powders and dispersions. Suppliers such as Cheap Tubes now name industrial grades by layer count and flake size, for example 6 to 10 layers and 0.5 to 1 micrometer. ACS Material warned in November 2025 that per-gram comparisons between CVD films and powders mislead buyers. Laboratories able to certify these properties locally will gain testing work from converters.
Battery storage tenders open a conductive additive opening
Utility battery procurement creates an opening for graphene conductive additives and thermal materials, although its use in the selected projects is not documented. The electricity minister named five preferred bidders for Bid Window 3 of the battery storage program on May 30, 2025, covering up to 616 MW. Those bidders are expected to invest R9.5 billion at five sites in the Free State supply area. The CSIR graphene program lists batteries and supercapacitors with faster charge cycles among its target uses. Suppliers that qualify additives with cell assemblers and integrators of battery energy storage systems could capture this demand.
Regional flake graphite offers a feedstock opening
Flake graphite mined in neighboring Mozambique gives South African processors a regional feedstock for graphene oxide and exfoliated platelets, an opening for toll processors and research spinouts. Syrah Resources produced 26,000 metric tons at Balama in the third quarter of 2025 after restarting in June, Club of Mozambique reported in October 2025. It sold at an average of USD 625 per metric ton and retains capacity of 350,000 metric tons a year. Industrial nanoplatelets list at about USD 100 per kg above 100 kg, so the value step from natural graphite to graphene is large. Converting even a few metric tons locally could cut import lead times for converters.
Thin commercial base, rand swings and tariffs weigh
A thin base of commercial nanomaterial firms
Few South African firms turn nanomaterial research into products, which leaves buyers dependent on imports. A June 2025 Human Sciences Research Council policy brief found only a handful of commercial nanotechnology companies, with nano-enabled products at 3% to 4% of national nanotechnology publications. South African patents granted by the European Patent Office stayed flat for six years. Converters that want local technical support are most exposed, and partnerships with foreign producers remain the main workaround.
Dollar pricing exposes small buyers to rand moves
Almost every graphene grade sold in South Africa is priced in U.S. dollars, so rand weakness raises costs with no change in performance. The rand averaged R16.57 per U.S. dollar in October 2026, according to the Federal Reserve Bank of St. Louis series. Small converters and university laboratories that buy in kilogram or gram lots are most exposed, because they cannot hedge or reach volume price breaks. Local stocking through distributors such as Ferro partly smooths this currency risk.
U.S. tariffs cut part of the automotive demand pool
Lost vehicle exports reduce the budgets that part makers can spend on new materials. South African light vehicle exports to North America fell from 25,554 units in 2024 to 6,530 in 2025 after the U.S. Section 232 automotive duty, according to naamsa data reported by TimesLIVE. Almost all of the lost units were Mercedes-Benz C-Class cars built in East London. Eastern Cape suppliers are most exposed, and European export programs now set the pace for any new material trials.
No direct grants for early commercialization
Public support offers facilities and expertise but little cash, which slows small firms that need money for pilot orders. The CSIR call for nanotechnology expressions of interest that closed on Aug. 31, 2026 provides no direct grant funding for start-up, operating or commercialization costs. The call also excludes any technology that has not yet reached prototype level. Early-stage graphene ventures are most exposed, and private distribution deals remain their main route to revenue.
Gauteng leads while the Western Cape grows fastest
Regional shares are Credence Research estimates that follow manufacturing output, research capacity and the location of compounders and test buyers. Coastal provinces gain share of South Africa graphene demand through 2035, as research-led and packaging uses grow faster than inland automotive demand.
| Region | Value, 2025 (USD million) | Share, 2025 | CAGR, 2026–2035 |
|---|---|---|---|
| Gauteng | 2.4 | 41.0% | 21.8% |
| Western Cape | 1.2 | 20.0% | 22.6% |
| KwaZulu-Natal | 1.0 | 17.0% | 22.3% |
| Rest of South Africa | 0.8 | 13.0% | 22.2% |
| Eastern Cape | 0.5 | 9.0% | 21.2% |
Gauteng holds the main compounders and research buyers
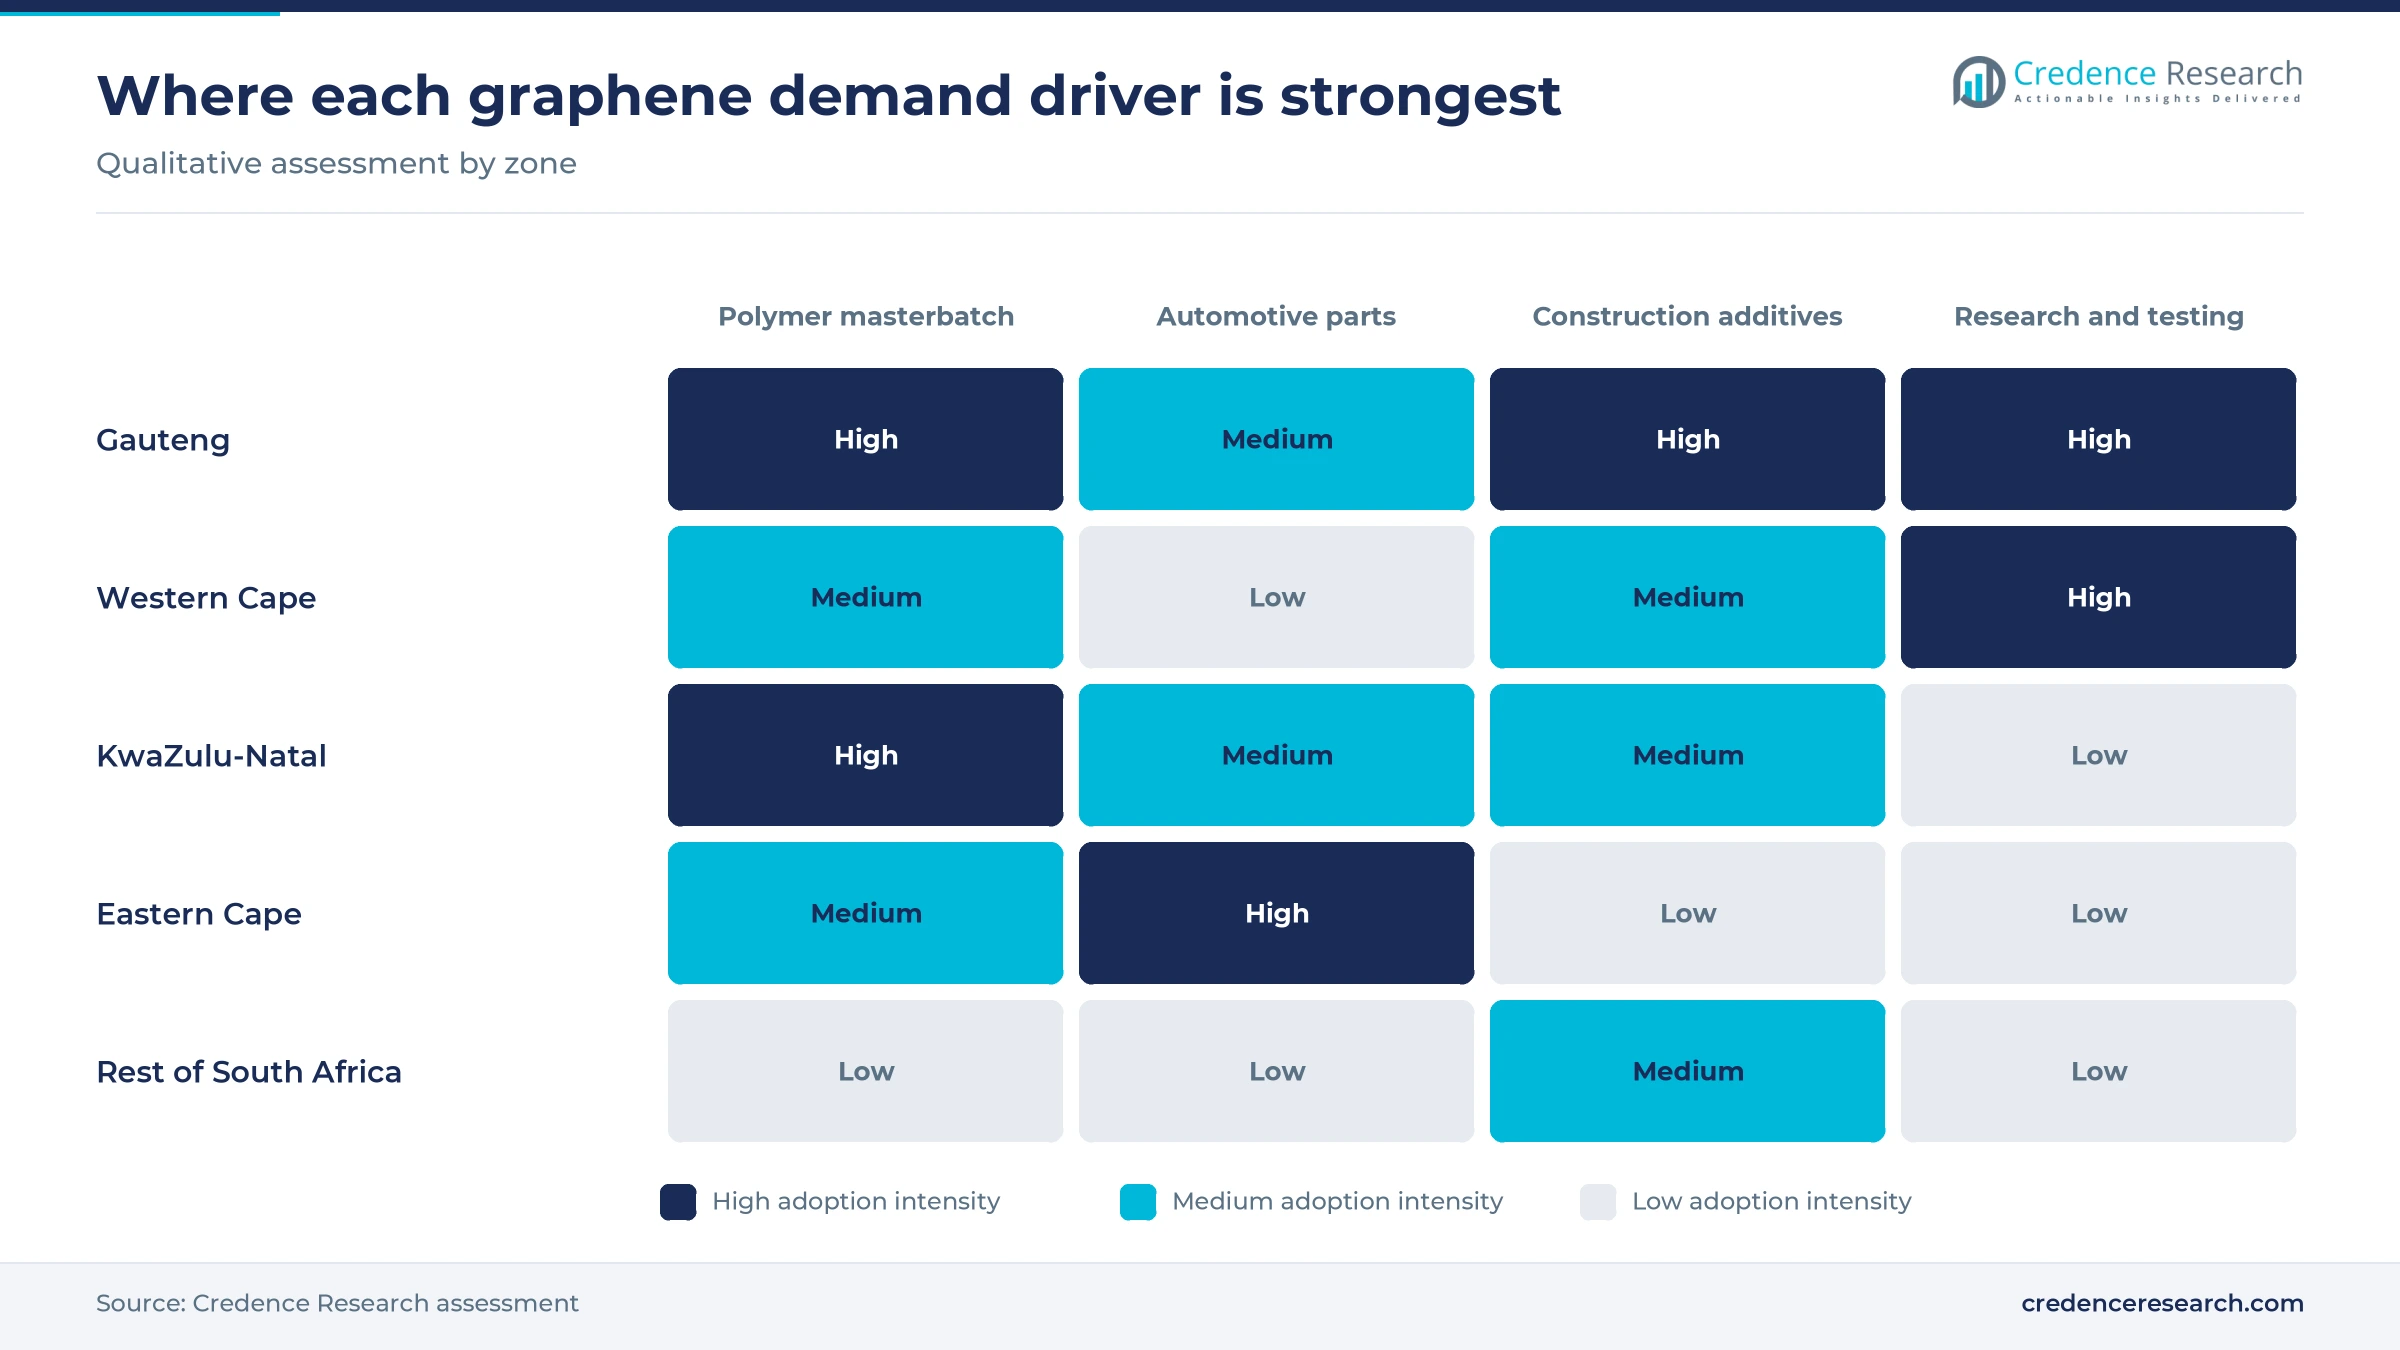
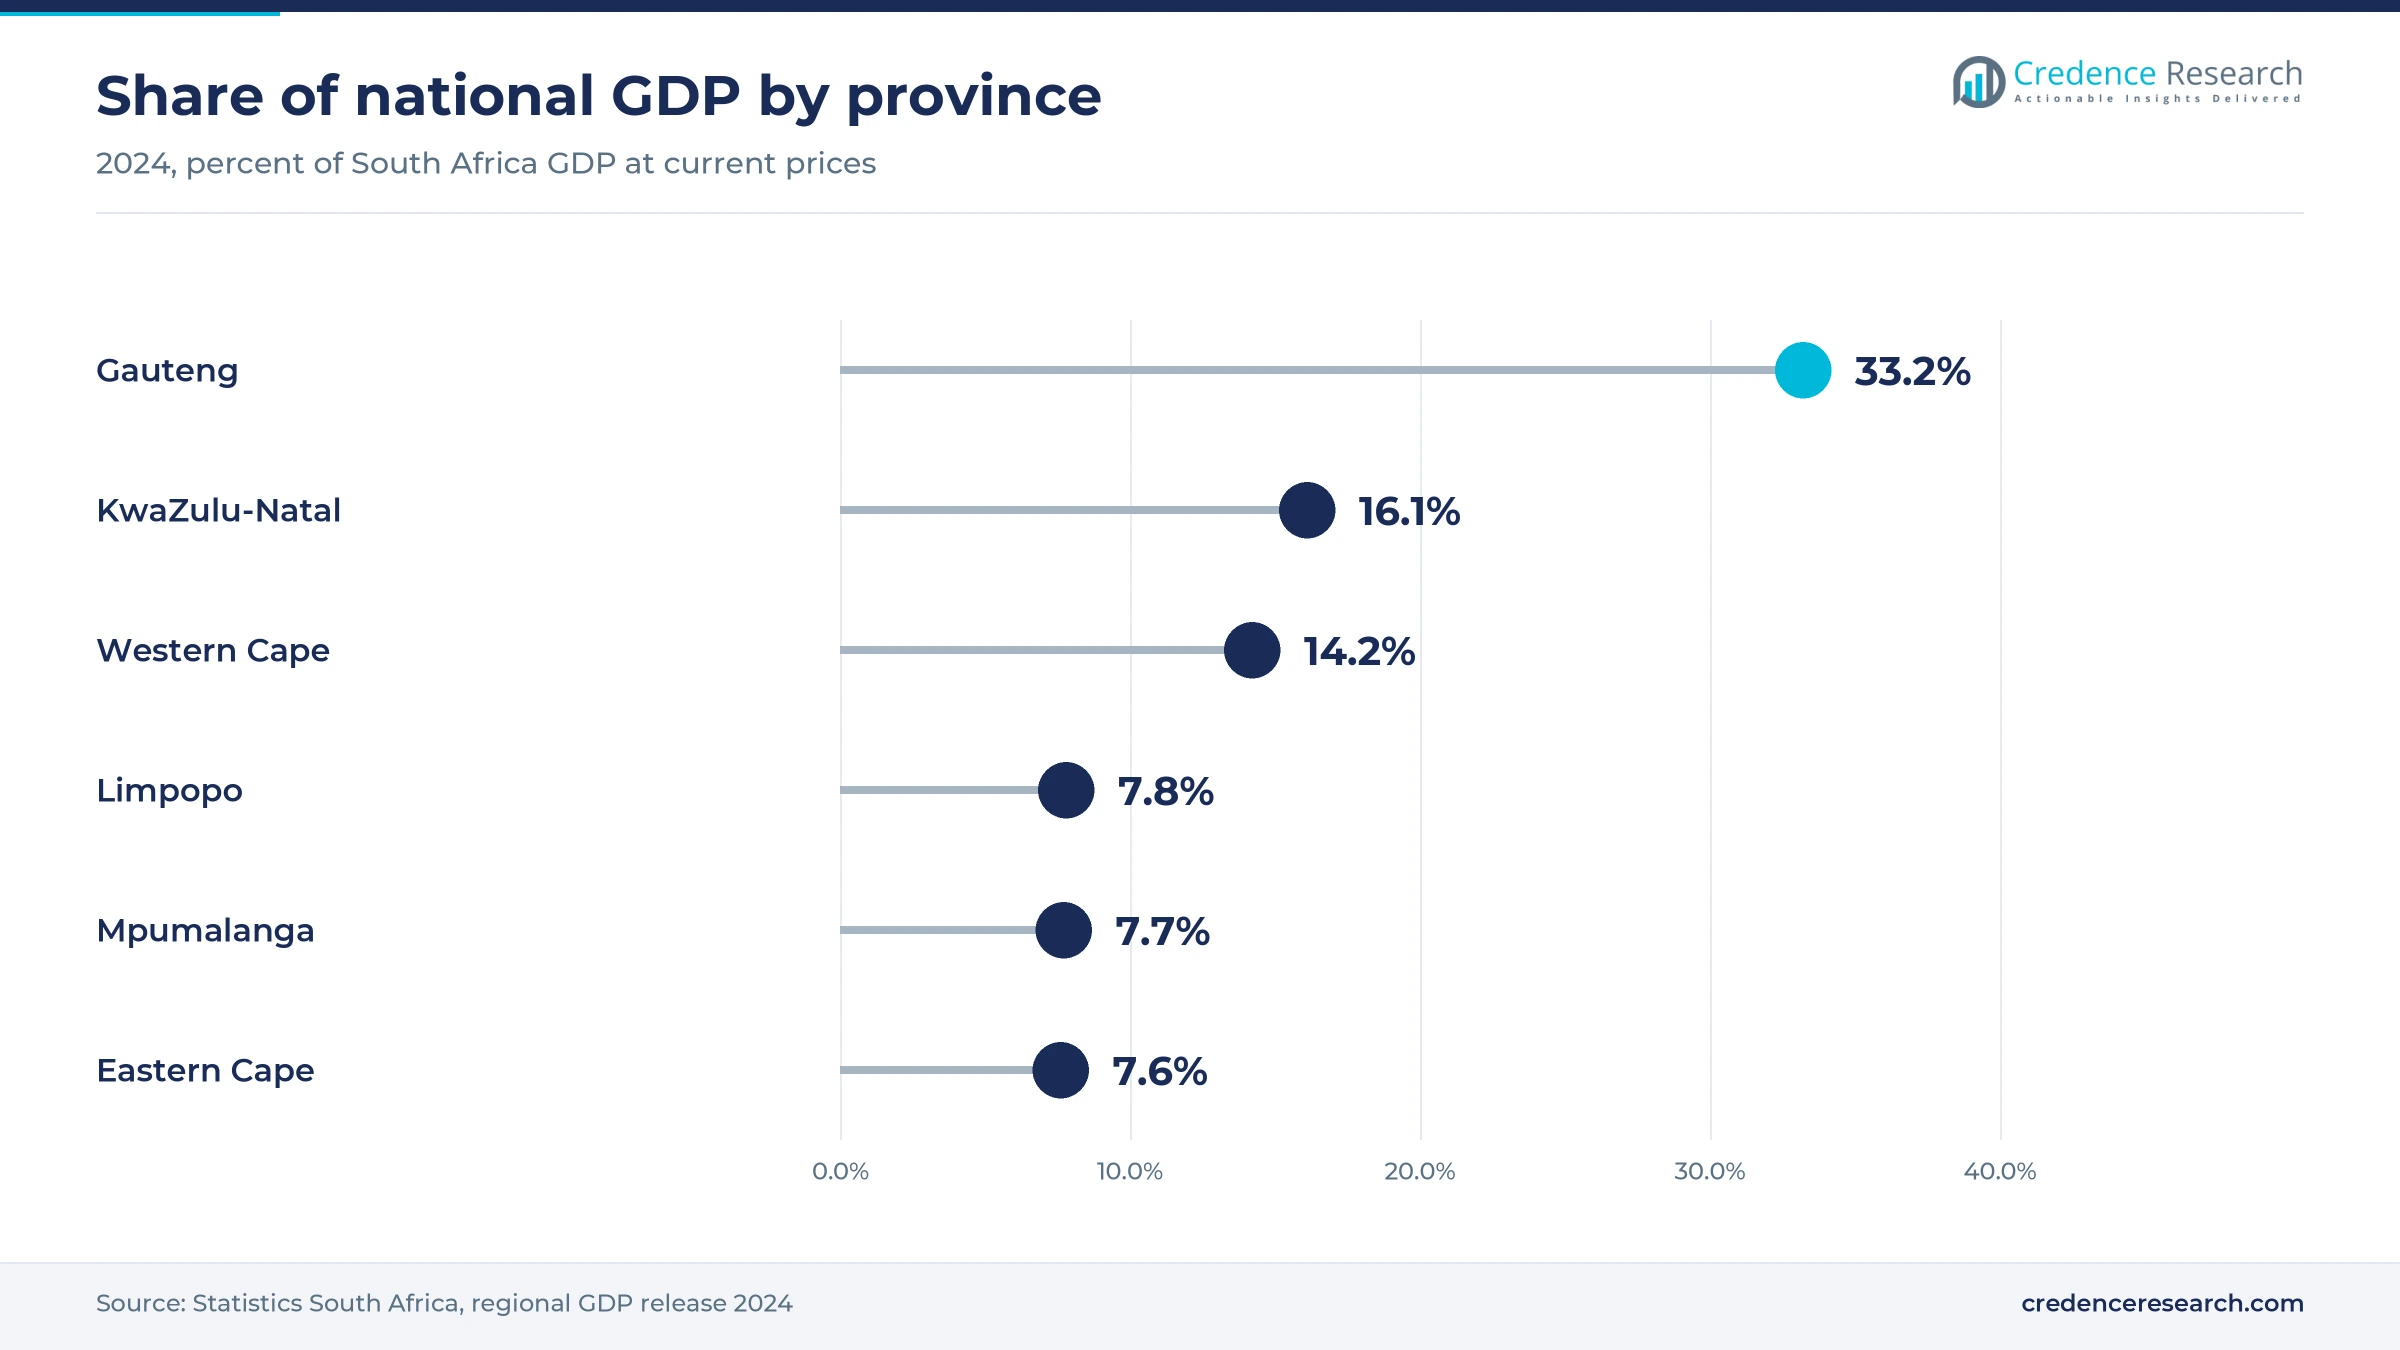
The CSIR in Pretoria and SabiNano in Johannesburg give Gauteng buyers nearby synthesis and testing, so most trial orders in the country start in the province. Gauteng held 41.0% of 2025 value and grows at 21.8% a year. It also generated about 40% of national manufacturing value added in 2024, according to Statistics South Africa, which places most masterbatch, coatings and plastics buyers within reach. Growth trails the national rate slightly, because new demand is spreading to coastal converters.
Western Cape grows fastest on research-led demand
Research laboratories at Stellenbosch University and the University of Cape Town anchor Western Cape demand, because they buy characterized grades for composites, sensors and energy storage work. The province held 20.0% of 2025 value and grows fastest at 22.6% a year. Its share of about 16% of national manufacturing value added gives that research a nearby industrial outlet in coatings, marine and packaging plants, although their graphene orders are not public.
KwaZulu-Natal relies on plastics and packaging converters
Packaging, chemicals and automotive component converters drive KwaZulu-Natal demand, because they already buy masterbatches and can trial graphene grades without new lines. The province held 17.0% of 2025 value and grows at 22.3% a year. It generated about 19% of national manufacturing value added in 2024, the second largest base after Gauteng. Distribution through a national compounder lets these plants test graphene with the same logistics they use for pigments and additives.
Eastern Cape depends on automotive export programs
Vehicle plants dominate Eastern Cape industry, so graphene demand there rises and falls with automotive export budgets. The province held 9.0% of 2025 value and grows at 21.2% a year, the slowest of the five zones. The loss of most U.S.-bound C-Class exports from East London weighs on part makers that would trial graphene compounds. Nelson Mandela University adds research demand, but automotive purchasing sets the pace for the zone.
Rest of South Africa follows mining and energy projects
Mining wear parts, conveyor coatings and energy storage are the likely graphene uses across the remaining provinces, although documented orders remain scarce. Rest of South Africa held 13.0% of 2025 value and grows at 22.2% a year. Manufacturing made up 11.5% of Mpumalanga output in 2024, while the five battery storage sites named in 2025 sit in the Free State supply area, which could add conductive additive demand later.
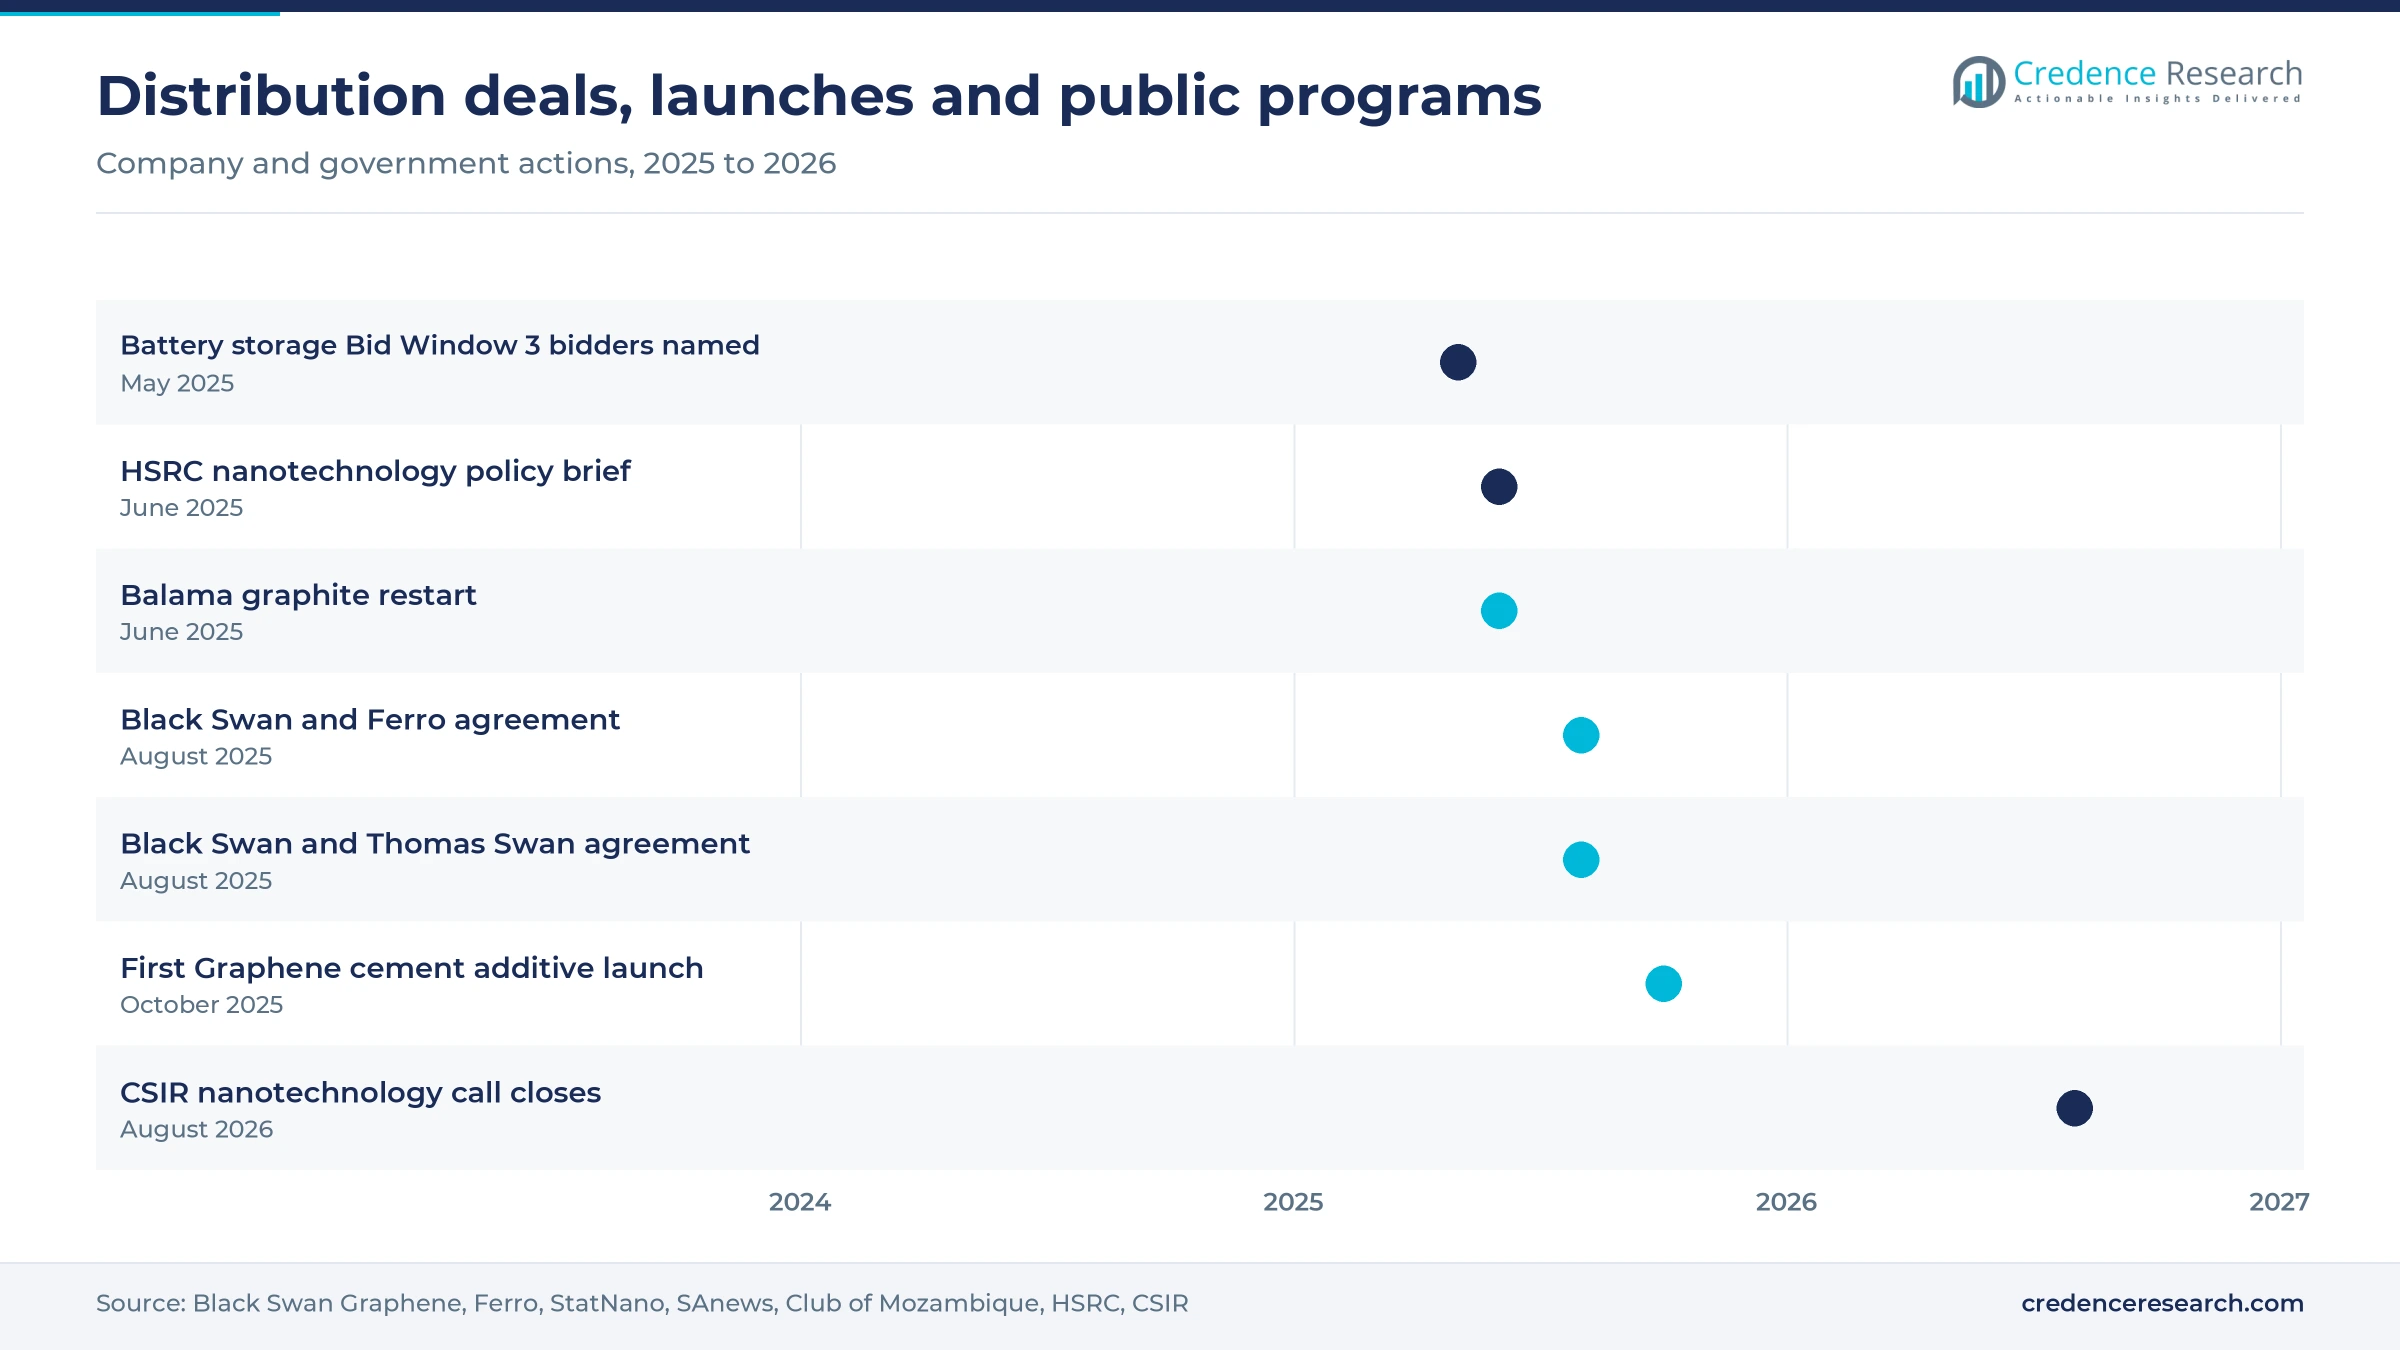
Distribution deals and a cement additive mark 2025
| Development | Status and market relevance |
|---|---|
| In August 2025, Black Swan Graphene and Ferro South Africa signed a five-year non-exclusive agreement for Ferro to distribute graphene masterbatches and nanoplatelets in South Africa. | Agreement signed; renewal by mutual consent gives local converters a stocked supplier. |
| In August 2025, Black Swan Graphene appointed Thomas Swan as a global non-exclusive distributor of its nanoplatelets and masterbatches. | Agreement signed; global non-exclusive reach with access to several warehouses, including one in China. |
| In October 2025, First Graphene released a PureGRAPH waterproofing additive to the South African cement and concrete market. | Commercial launch; first graphene admixture offered to local concrete producers. |
| In August 2026, the CSIR closed a call for expressions of interest to localize and commercialize nano-enabled technologies. | Call closed; projects receive CSIR facilities and expertise rather than direct grants. |
Exfoliation, oxide routes and CVD films serve buyers
- Liquid-phase exfoliation produces graphene nanoplatelets in volumes of hundreds of kilograms or more, and it supplies most composites, coatings and masterbatch grades that South African converters buy at per-kilogram prices.
- Oxidation and reduction routes convert graphite into graphene oxide and reduced graphene oxide, the route the CSIR uses for its 1 kg batches, and they suit water-based coatings, membranes and cement additives.
- Chemical vapor deposition grows monolayer films on copper for sensors and electronics research, and suppliers price these films per wafer or sheet rather than per gram of material.
- Masterbatch compounding disperses platelets into polymer pellets so converters can dose graphene on existing extrusion and molding lines, which removes the handling and dispersion steps that stall most powder trials.
Need a Custom Version of This Report?
Tailor the scope, geography, or segments to your exact requirements.
- Custom geography or segment scope
- Direct access to our analyst team
Global producers rely on local compounders to sell
Competition in South Africa runs through local channels rather than local plants, because few converters can qualify a new grade alone. Black Swan Graphene reaches converters through Ferro South Africa, a local masterbatch maker that holds the customer relationships and technical service. First Graphene entered construction with a cement and concrete additive, positioning on durability rather than price. Applied Graphene Materials, now part of Universal Matter, signed Carst and Walker as its exclusive South African distributor for Genable anti-corrosion dispersions in June 2019, PCI Magazine reported, although current activity under the new owner is not public. Merck supplies characterized research grades to laboratories through its Sigma-Aldrich catalog, while SabiNano and the CSIR provide local synthesis and testing at small scale. Suppliers that add local stock, application testing and rand pricing win repeat business.
How is the graphene supply side organized in South Africa?
The South Africa graphene supply side is fragmented and led by imports from foreign producers. Foreign producers in the U.K., Canada, Spain and Australia make the material, and they reach South African buyers through local compounders, chemical distributors or direct online sales. Domestic production is limited to pilot batches at the CSIR and small nanomaterial firms. Entry barriers sit in dispersion know-how, customer qualification and consistent grading rather than in synthesis capital. Margins are highest for firms that formulate masterbatches, dispersions and admixtures, because buyers pay for proven performance in their own process, not for graphene content.
Graphene producers and local channels active in South Africa
| Company | Type | Role in the market |
|---|---|---|
| Black Swan Graphene Inc. | Specialist producer | Sells graphene nanoplatelets and masterbatches in South Africa through Ferro |
| Ferro South Africa (Pty) Ltd | Local compounder and distributor | Makes plastics masterbatches and distributes graphene-enhanced grades locally |
| First Graphene Ltd | Specialist producer | Sells PureGRAPH-based waterproofing additive to South African cement and concrete |
| Universal Matter (Applied Graphene Materials) | Dispersion specialist | Genable anti-corrosion dispersions, distributed in South Africa by Carst and Walker under a June 2019 agreement |
| SabiNano (Pty) Ltd | Local manufacturer | Johannesburg maker of graphene and carbon nanotubes with research services |
| Merck KGaA (Sigma-Aldrich) | Laboratory supplier | Supplies research-grade graphene, graphene oxide and films through its catalog |
Value sits with formulators, not powder sellers
Credence Research's view is that South African graphene value will accrue to companies that turn powder into a dosable, tested product. The 2025 distribution deals matter more than any synthesis breakthrough, because they let converters order graphene the way they already buy pigments and additives. The main risk is that trials stay trials, as automotive budgets tighten and the rand raises import costs. Buyers should ask suppliers for graded specifications and local application data before committing, while producers should invest in local stock and technical service rather than in early plant capacity.
Estimates rest on prices, volumes and provincial output
The report uses 2025 as the base year and 2035 as the final forecast year, with growth rates measured over 2026 to 2035. Market values come from the Credence Research model, built from industrial list prices for nanoplatelets, oxides and films, estimated volumes by application and a cross-check against world graphene demand. Regional and segment splits are Credence Research estimates guided by Statistics South Africa provincial output and the location of converters and laboratories. Sources include company announcements, CSIR and government releases, ISO documents and trade press. No interviews or surveys with market participants are claimed for this estimate.
Industrial dosing, not research, will decide growth
Through 2035, growth will depend on industrial dosing in masterbatches, coatings and cement rather than on research purchases. The South Africa graphene market reaches USD 42.5 million by 2035 in the base case, with bulk grades keeping their lead as local channels add stock and service. Battery storage and new energy vehicle programs could add demand for conductive additives later in the decade, but evidence of graphene in those projects is still missing. Local processing of regional flake graphite would shorten lead times, yet no commercial-scale plant appears in public announcements, so imports will remain the main supply route.
Industrial repeat orders decide the range of outcomes
The spread between cases depends on whether 2025 trials turn into repeat industrial orders. Masterbatch and admixture sales through local partners would carry the base case. A downside follows if automotive exports weaken further and converters keep graphene at trial volumes. An upside needs battery, coatings and cement producers to specify graphene grades in standard products, with local processing that cuts lead times.
| Scenario | CAGR, 2026–2035 | Value, 2035 | What has to hold |
|---|---|---|---|
| Downside | 18.0% | USD 31.5 million | Trials stall, auto exports fall further and imports stay at sample volumes |
| Base | 22.04% | USD 42.5 million | Masterbatch and admixture channels convert trials into steady orders |
| Upside | 25.0% | USD 52.9 million | Battery, coatings and cement makers specify graphene and local processing starts |
Frequently Asked Questions
How big is the South Africa graphene market?
How much does graphene cost for South African buyers?
Which region leads graphene demand in South Africa?
Which graphene type sells most in South Africa?
Who supplies graphene in South Africa?
What drives graphene demand in South Africa?
What limits graphene adoption in South Africa?
Is a graphene production plant planned in South Africa?
Table of Content
Chapter 1 Market Segmentation
- 1.1 Segmentation Framework
- 1.1.1 Product and Service Classification
- 1.1.2 Application and End-Use Classification
- 1.1.3 Technology and Solution Classification
- 1.1.4 Customer and Distribution Channel Classification
- 1.1.5 Geographic Segmentation
- 1.1.6 Market Segment Definitions and Boundaries
- 1.2 By Type
- 1.2.1 Bulk Graphene
- 1.2.2 Monolayer Graphene
- 1.3 By Application
- 1.3.1 Composites
- 1.3.2 Coatings
- 1.3.3 Sensors
- 1.3.4 Catalysts
- 1.3.5 Radio Frequency Identification (RFID)
- 1.4 By End User
- 1.4.1 Automotive
- 1.4.2 Others
- 1.4.3 Electronics
- 1.4.4 Aerospace & Defense
- 1.4.5 Biomedical & Healthcare
Chapter 2 Introduction
- 2.1 Report Objectives and Scope
- 2.2 Product Definition and Industry Terminology
- 2.3 Market Inclusions and Exclusions
- 2.4 Research Process
- 2.4.1 Primary Research and Expert Interviews
- 2.4.2 Secondary Research and Source Review
- 2.4.3 Top-Down and Bottom-Up Estimation
- 2.4.4 Data Triangulation and Verification
- 2.5 Market Size Measurement Basis
- 2.5.1 2025: USD 5.80 million → 2035: USD 42.5 million
- 2.6 Historical and Forecast Reference Periods
- 2.6.1 Historical Period: 2018-2025
- 2.6.2 Base Year: 2025
- 2.6.3 Forecast Period: 2025-2035
- 2.7 Research Assumptions and Limitations
Chapter 3 Executive Summary
- 3.1 Market Snapshot and Key Findings
- 3.2 Base-Year Market Size, 2025
- 3.3 Forecast Market Size, 2035
- 3.4 Revenue and Volume Growth Outlook
- 3.5 Key Demand and Supply Indicators
- 3.6 Leading Market Segments
- 3.7 Fastest-Growing Market Opportunities
- 3.8 Regional Performance Highlights
- 3.9 Technology and Industry Transformation
- 3.10 Competitive Landscape Summary
- 3.11 Analyst View and Strategic Implications
Chapter 4 South Africa Graphene Market Trends and Developments
- 4.1 Historical Industry Development, 2018-2025
- 4.2 Recent Market Trends and Developments
- 4.3 Demand and Customer Behavior Trends
- 4.4 Technology and Product Innovation
- 4.5 Artificial Intelligence, Automation and Digitalization
- 4.6 Local Manufacturing and Supply Chain Realignment
- 4.7 Industry Partnerships, Mergers and Acquisitions
- 4.8 Sustainability and Circular Economy Developments
- 4.9 Government and Private Sector Investment Trends
- 4.10 Emerging Business Models and Commercialization
- 4.11 Industry Developments and Announcements
Chapter 5 South Africa Graphene Market Production, Supply and Demand Analysis
- 5.1 Demand Trend and Consumption Analysis, 2018-2025
- 5.2 Demand Forecast, 2025-2035
- 5.3 Production and Output Trend, 2018-2025
- 5.4 Production and Output Forecast, 2025-2035
- 5.5 Installed Capacity and Capacity Utilization
- 5.6 Company-Wise Production Plants and Statistics
- 5.6.1 Installed Production Capacity
- 5.6.2 Actual Production
- 5.6.3 Planned Capacity and Expansion Targets
- 5.7 Supply Chain Structure and Procurement Trends
- 5.8 Supply-Demand Gap and Bottlenecks
- 5.9 Import Dependence and Sourcing Structure
- 5.10 Contract Manufacturing and Outsourcing
- 5.11 Regional Supply and Demand Concentration
Chapter 6 South Africa Graphene Market Pricing Analysis
- 6.1 Pricing Structure and Measurement
- 6.2 Historical Pricing Trends, 2018-2025
- 6.3 Pricing Outlook, 2025-2035
- 6.4 Average Selling Price and Unit Economics
- 6.5 Pricing by Product and Market Segment
- 6.6 Geographic Pricing Differences
- 6.7 Key Input, Energy, Labor and Logistics Costs
- 6.8 Contract Pricing and Purchasing Models
- 6.9 Pricing Sensitivity and Competitive Positioning
- 6.10 Price, Margin and Profitability Implications
Chapter 7 South Africa Graphene Market Dynamics
- 7.1 Market Growth Drivers
- 7.1.1 Demand-Side Drivers
- 7.1.2 Technology and Innovation Drivers
- 7.1.3 Infrastructure and Investment Drivers
- 7.1.4 Regulatory and Policy Drivers
- 7.2 Market Restraints
- 7.2.1 Cost and Affordability Constraints
- 7.2.2 Technology and Adoption Barriers
- 7.2.3 Supply Chain and Operational Constraints
- 7.3 Market Challenges
- 7.3.1 Competitive Pressure and Margin Erosion
- 7.3.2 Skills, Infrastructure and Implementation Gaps
- 7.4 Emerging Market Opportunities
- 7.5 Market Dynamics Impact and Time-Horizon Assessment
Chapter 8 South Africa Graphene Value Chain Analysis
- 8.1 Industry Value Chain Overview
- 8.2 Upstream Suppliers and Critical Inputs
- 8.3 Technology and Component Providers
- 8.4 Manufacturing or Service Delivery
- 8.5 Distribution, Channel Partners and Integrators
- 8.6 Downstream Applications and End Users
- 8.7 Value Addition and Profit Pools
- 8.8 Vertical Integration and Outsourcing
- 8.9 Supplier Concentration and Risk
- 8.10 Supply Chain Localization and Resilience
Chapter 9 South Africa Graphene Market Regulations and Policies
- 9.1 Relevant Laws, Standards and Compliance Frameworks
- 9.2 Product, Service, Safety and Quality Requirements
- 9.3 Government Policies, Incentives and Subsidies
- 9.4 Imports, Exports and Trade Barriers
- 9.5 Public Procurement and Local Content Requirements
- 9.6 Environmental and Sustainability Compliance
- 9.7 Upcoming Policy Changes and Market Implications
Chapter 10 South Africa Graphene Market Hotspots and Opportunities
- 10.1 Market Opportunity Mapping and Growth Hotspots
- 10.2 High-Growth Applications and Customer Groups
- 10.3 Underserved Markets and White-Space Opportunities
- 10.4 Emerging Technology and Product Opportunities
- 10.5 New Capacity and Investment Hotspots
- 10.6 Market Entry and Expansion Opportunities
- 10.7 Distribution and Partnership Opportunities
- 10.8 Near-Term and Long-Term Commercial Potential
- 10.9 Opportunity Attractiveness and Execution Risks
Chapter 11 South Africa Graphene Market Outlook, 2025-2035
- 11.1 Market Size and Analysis
- 11.1.1 Revenue (Market Measurement: 2025: USD 5.80 million → 2035: USD 42.5 million)
- 11.1.2 Market Volume and Quantity Sold
- 11.1.3 Historical Market Size, 2018-2025
- 11.1.4 Base-Year Market Size, 2025
- 11.2 Market Forecast, 2025-2035
- 11.2.1 Revenue Forecast to 2035
- 11.2.2 Volume Forecast to 2035
- 11.2.3 CAGR and Year-on-Year Growth
- 11.2.4 Incremental Revenue Opportunity
- 11.3 Forecast Assumptions and Scenario Analysis
- 11.3.1 Base-Case Forecast
- 11.3.2 Optimistic and Conservative Scenarios
- 11.3.3 Technology, Pricing and Policy Sensitivities
- 11.4 Market Attractiveness and Growth Outlook
Chapter 12 South Africa Graphene Market Segmentation and Outlook
- 12.1 Segmentation Summary and Market Shares, 2025
- 12.2 Largest and Fastest-Growing Segments
- 12.3 By Type - Market Size and Forecast, 2025-2035
- 12.3.1 Segment Definition and Scope
- 12.3.2 Historical Market Size, 2018-2025
- 12.3.3 Revenue Forecast, 2025-2035
- 12.3.4 Volume Forecast, 2025-2035
- 12.3.5 Base-Year Market Share, 2025
- 12.3.6 Segment CAGR and Growth Drivers
- 12.3.7 Subsegment Market Size and Forecast
- 12.3.7.1 Bulk Graphene
- 12.3.7.2 Monolayer Graphene
- 12.3.8 Subsegment Pricing and Adoption Trends
- 12.3.9 Leading Suppliers and Competition
- 12.3.10 Regional Demand and Opportunities
- 12.4 By Application - Market Size and Forecast, 2025-2035
- 12.4.1 Segment Definition and Scope
- 12.4.2 Historical Market Size, 2018-2025
- 12.4.3 Revenue Forecast, 2025-2035
- 12.4.4 Volume Forecast, 2025-2035
- 12.4.5 Base-Year Market Share, 2025
- 12.4.6 Segment CAGR and Growth Drivers
- 12.4.7 Subsegment Market Size and Forecast
- 12.4.7.1 Composites
- 12.4.7.2 Coatings
- 12.4.7.3 Sensors
- 12.4.7.4 Catalysts
- 12.4.7.5 Radio Frequency Identification (RFID)
- 12.4.8 Subsegment Pricing and Adoption Trends
- 12.4.9 Leading Suppliers and Competition
- 12.4.10 Regional Demand and Opportunities
- 12.5 By End User - Market Size and Forecast, 2025-2035
- 12.5.1 Segment Definition and Scope
- 12.5.2 Historical Market Size, 2018-2025
- 12.5.3 Revenue Forecast, 2025-2035
- 12.5.4 Volume Forecast, 2025-2035
- 12.5.5 Base-Year Market Share, 2025
- 12.5.6 Segment CAGR and Growth Drivers
- 12.5.7 Subsegment Market Size and Forecast
- 12.5.7.1 Automotive
- 12.5.7.2 Others
- 12.5.7.3 Electronics
- 12.5.7.4 Aerospace & Defense
- 12.5.7.5 Biomedical & Healthcare
- 12.5.8 Subsegment Pricing and Adoption Trends
- 12.5.9 Leading Suppliers and Competition
- 12.5.10 Regional Demand and Opportunities
- 12.6 Segment Growth Comparison
- 12.7 Segment Attractiveness and Priority Matrix
Chapter 13 South Africa Graphene End-Use and Application Market Outlook
- 13.1 End-Use Industry and Customer Demand Structure
- 13.2 Leading Applications and Customer Groups
- 13.3 End-Use Market Size, Share and Forecast
- 13.4 Major End-Use Industry Deep Dives
- 13.4.1 Customer Requirements and Use Cases
- 13.4.2 Demand and Replacement Cycles
- 13.4.3 Technical and Regulatory Considerations
- 13.4.4 Purchasing and Procurement Models
- 13.4.5 Leading Vendors and Distribution Channels
- 13.4.6 Forecast and Commercial Opportunities
- 13.5 Emerging Applications and Cross-Segment Demand
- 13.6 End-Use Industry Investment Priorities
Chapter 14 South Africa Graphene Geographic Market Outlook, 2025-2035
- 14.1 Domestic Market Distribution and Demand Clusters
- 14.2 State- or Province-Wise Market Size and Forecast, 2025-2035
- 14.3 City and Metropolitan Market Outlook
- 14.4 Industrial, Manufacturing and Commercial Clusters
- 14.5 Geographic Concentration of Key End Users
- 14.6 Local Pricing and Purchasing Differences
- 14.7 Domestic Production Facilities and Capacity Map
- 14.8 Local Infrastructure and Project Pipeline
- 14.9 State-Level Policy and Incentive Differences
- 14.10 Subnational Investment Hotspots and Opportunities
- 14.11 Distribution and Logistics Networks
- 14.12 Domestic Competitive Footprint
Chapter 15 South Africa Graphene Technology, Innovation and Sustainability Outlook
- 15.1 Technology Landscape and Maturity
- 15.2 Product, Process and Service Innovation
- 15.3 AI, Automation and Digital Tools in the Industry
- 15.4 Technology Adoption and Performance Benchmarking
- 15.5 Innovation Pipeline and R&D Investment
- 15.6 Patent and Intellectual Property Trends
- 15.7 Energy Efficiency and Resource Management
- 15.8 Sustainability, Recycling and Circularity
- 15.9 Technology Roadmap, 2025-2035
- 15.10 Risks of Obsolescence and Technology Substitution
Chapter 16 South Africa Graphene Market Key Strategic Imperatives
- 16.1 Growth and Market Entry Priorities
- 16.2 High-Return Products and Segments
- 16.3 Pricing, Profitability and Cost Optimization
- 16.4 Technology Investment and Product Differentiation
- 16.5 Supply Chain Localization and Resilience
- 16.6 Distribution and Customer Acquisition
- 16.7 Partnership, Acquisition and Capacity Strategy
- 16.8 Regional Expansion Priorities
- 16.9 Short-, Medium- and Long-Term Actions
Chapter 17 Competition Outlook
- 17.1 Industry Competition Characteristics
- 17.2 Market Structure and Concentration
- 17.3 Market Share and Competitive Positioning, 2025
- 17.4 Company-Wise Revenue and Product Benchmarking
- 17.5 Production and Service Capacity Benchmarking
- 17.6 Technology, Pricing and Differentiation
- 17.7 Regional Footprint and Distribution Strength
- 17.8 Mergers, Acquisitions and Strategic Alliances
- 17.9 New Entrants and Competitive Threats
- 17.10 Porter's Five Forces and Industry Attractiveness
- 17.11 Competitive Outlook, 2025-2035
Chapter 18 Company Profiles
- 18.1 Company Coverage and Selection Criteria
- 18.2 Black Swan Graphene Inc.
- 18.2.1 Business Description
- 18.2.2 Company Ownership and Geographic Presence
- 18.2.3 Product and Service Portfolio
- 18.2.4 Manufacturing and Operating Footprint
- 18.2.5 Production Capacity and Expansion Plans
- 18.2.6 Financial Performance and Investment
- 18.2.7 Market Share and Competitive Position
- 18.2.8 Technology and Innovation Capabilities
- 18.2.9 Strategic Alliances or Partnerships
- 18.2.10 Recent Developments
- 18.2.11 Growth Strategy and Outlook
- 18.3 Ferro South Africa (Pty) Ltd
- 18.4 First Graphene Ltd
- 18.5 Universal Matter (Applied Graphene Materials)
- 18.6 SabiNano (Pty) Ltd
- 18.7 Merck KGaA (Sigma-Aldrich)
- 18.8 Other Relevant Market Participants
Note: Every listed company is profiled on the structure shown under the first company. The company list is preliminary and may change based on research findings, market developments, data availability and client requirements.
Chapter 19 Disclaimer
- 19.1 Research and Forecast Disclaimer
- 19.2 Data Source and Estimation Limitations
Note: The depth of individual sections depends on data availability for this market. Volume, capacity, trade and other unit-based metrics are included where applicable.

