
Crush capacity and biofuel policy shape the demand base
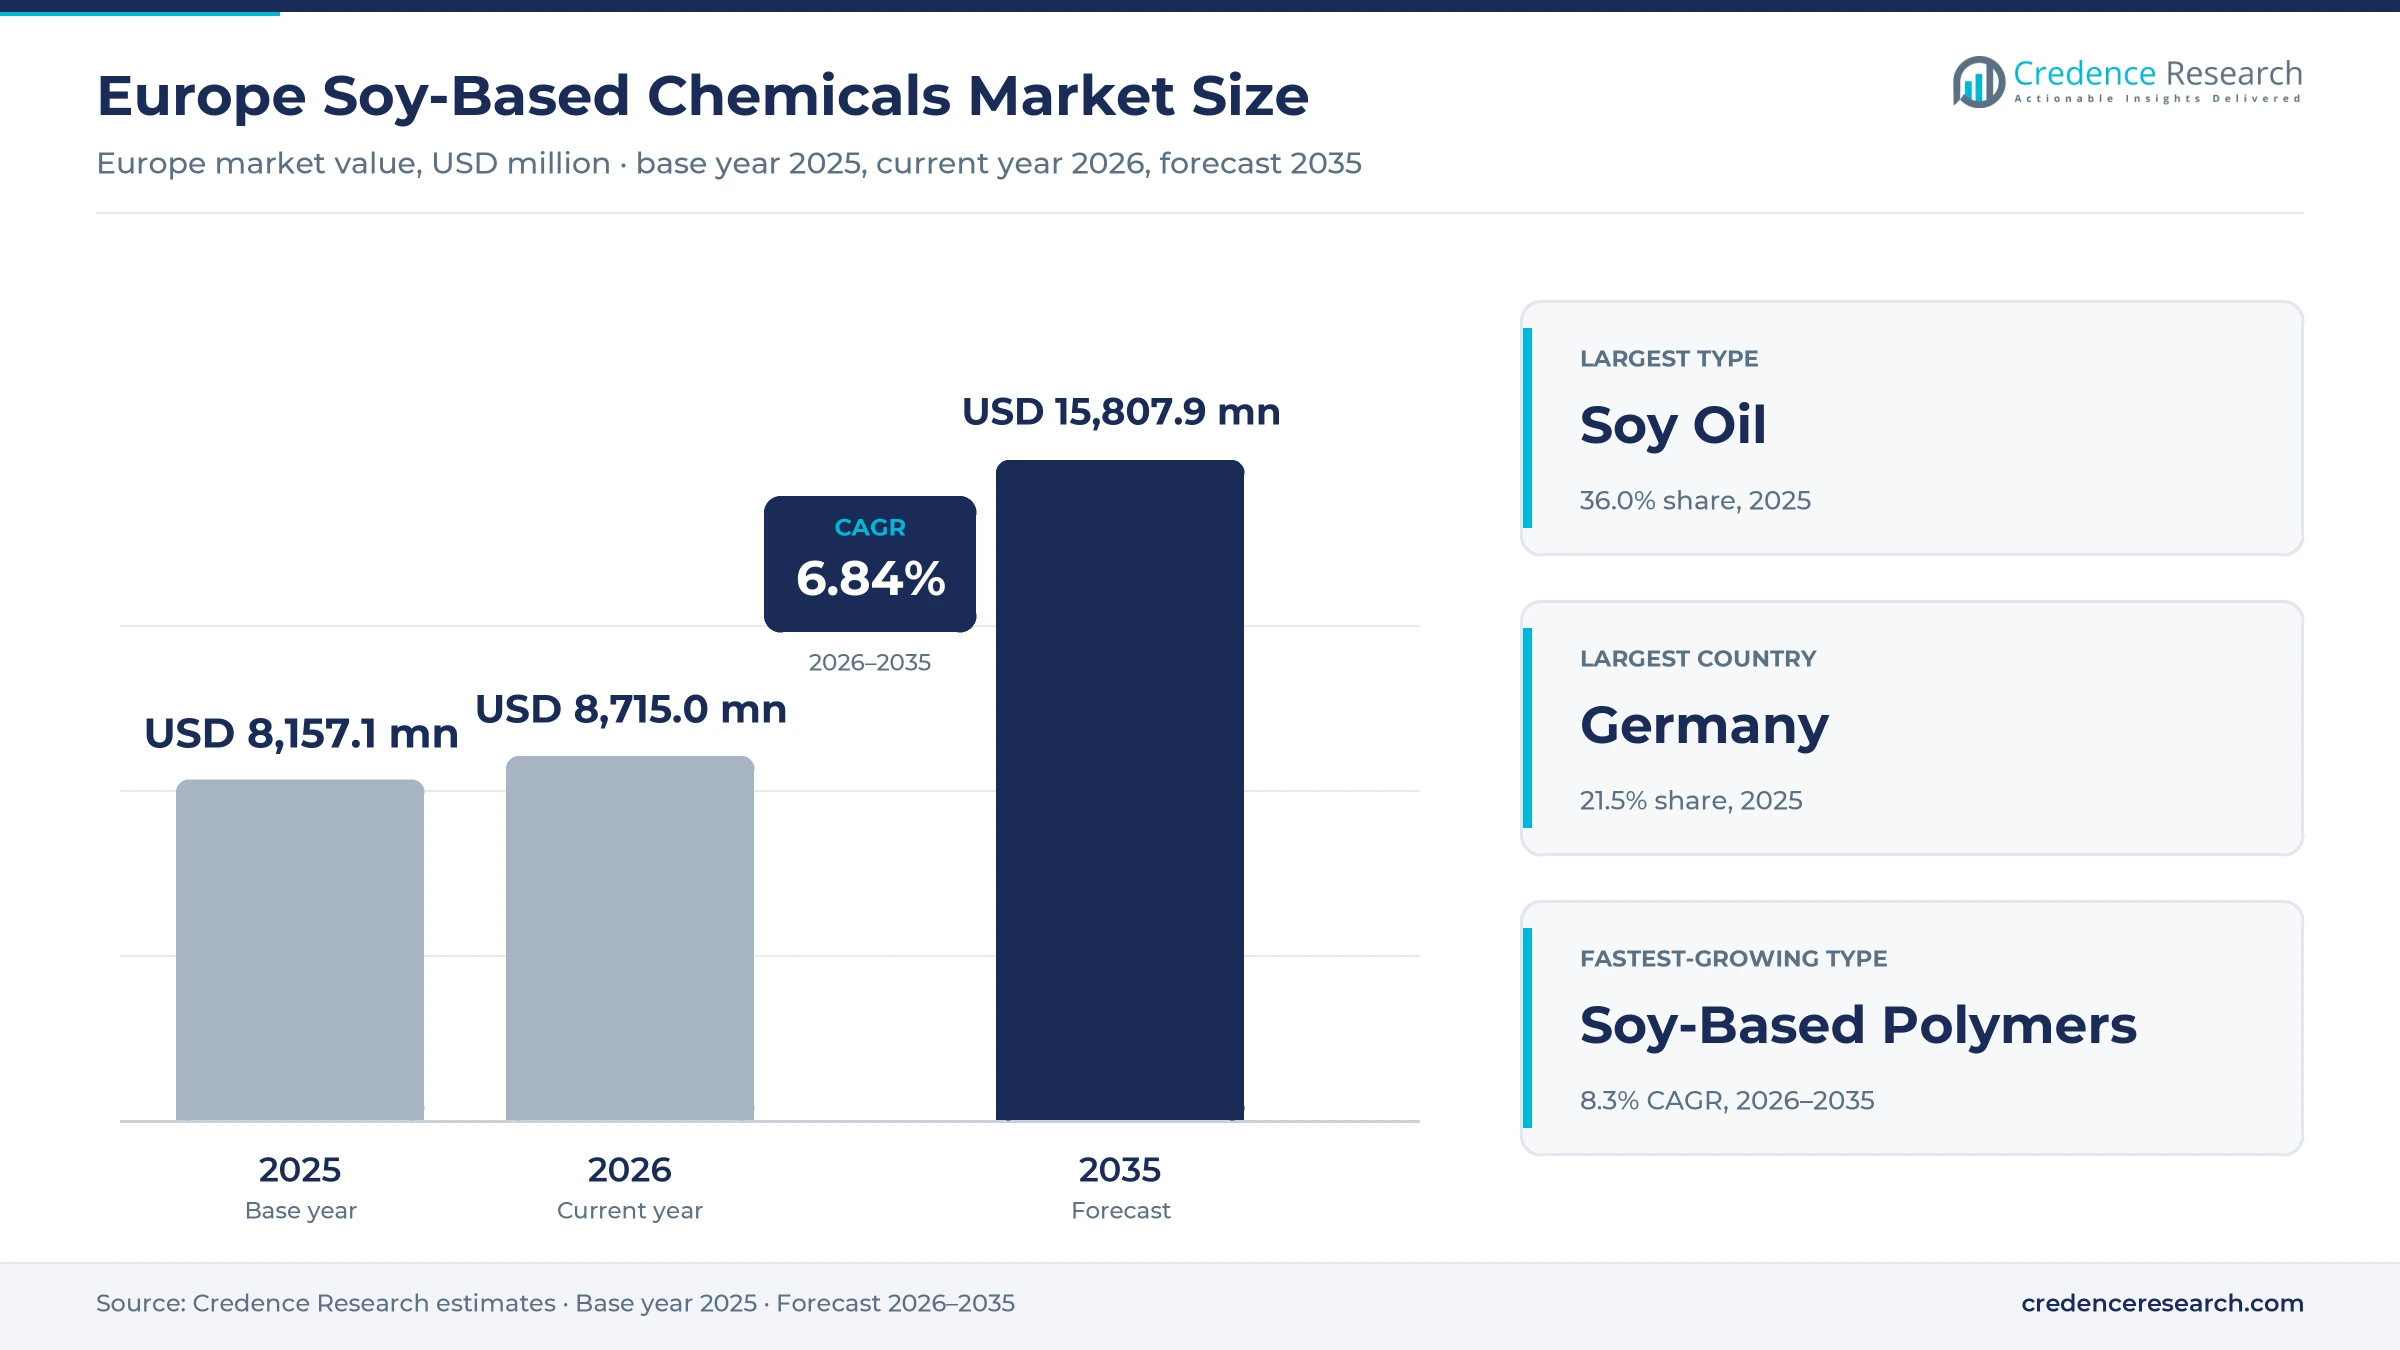
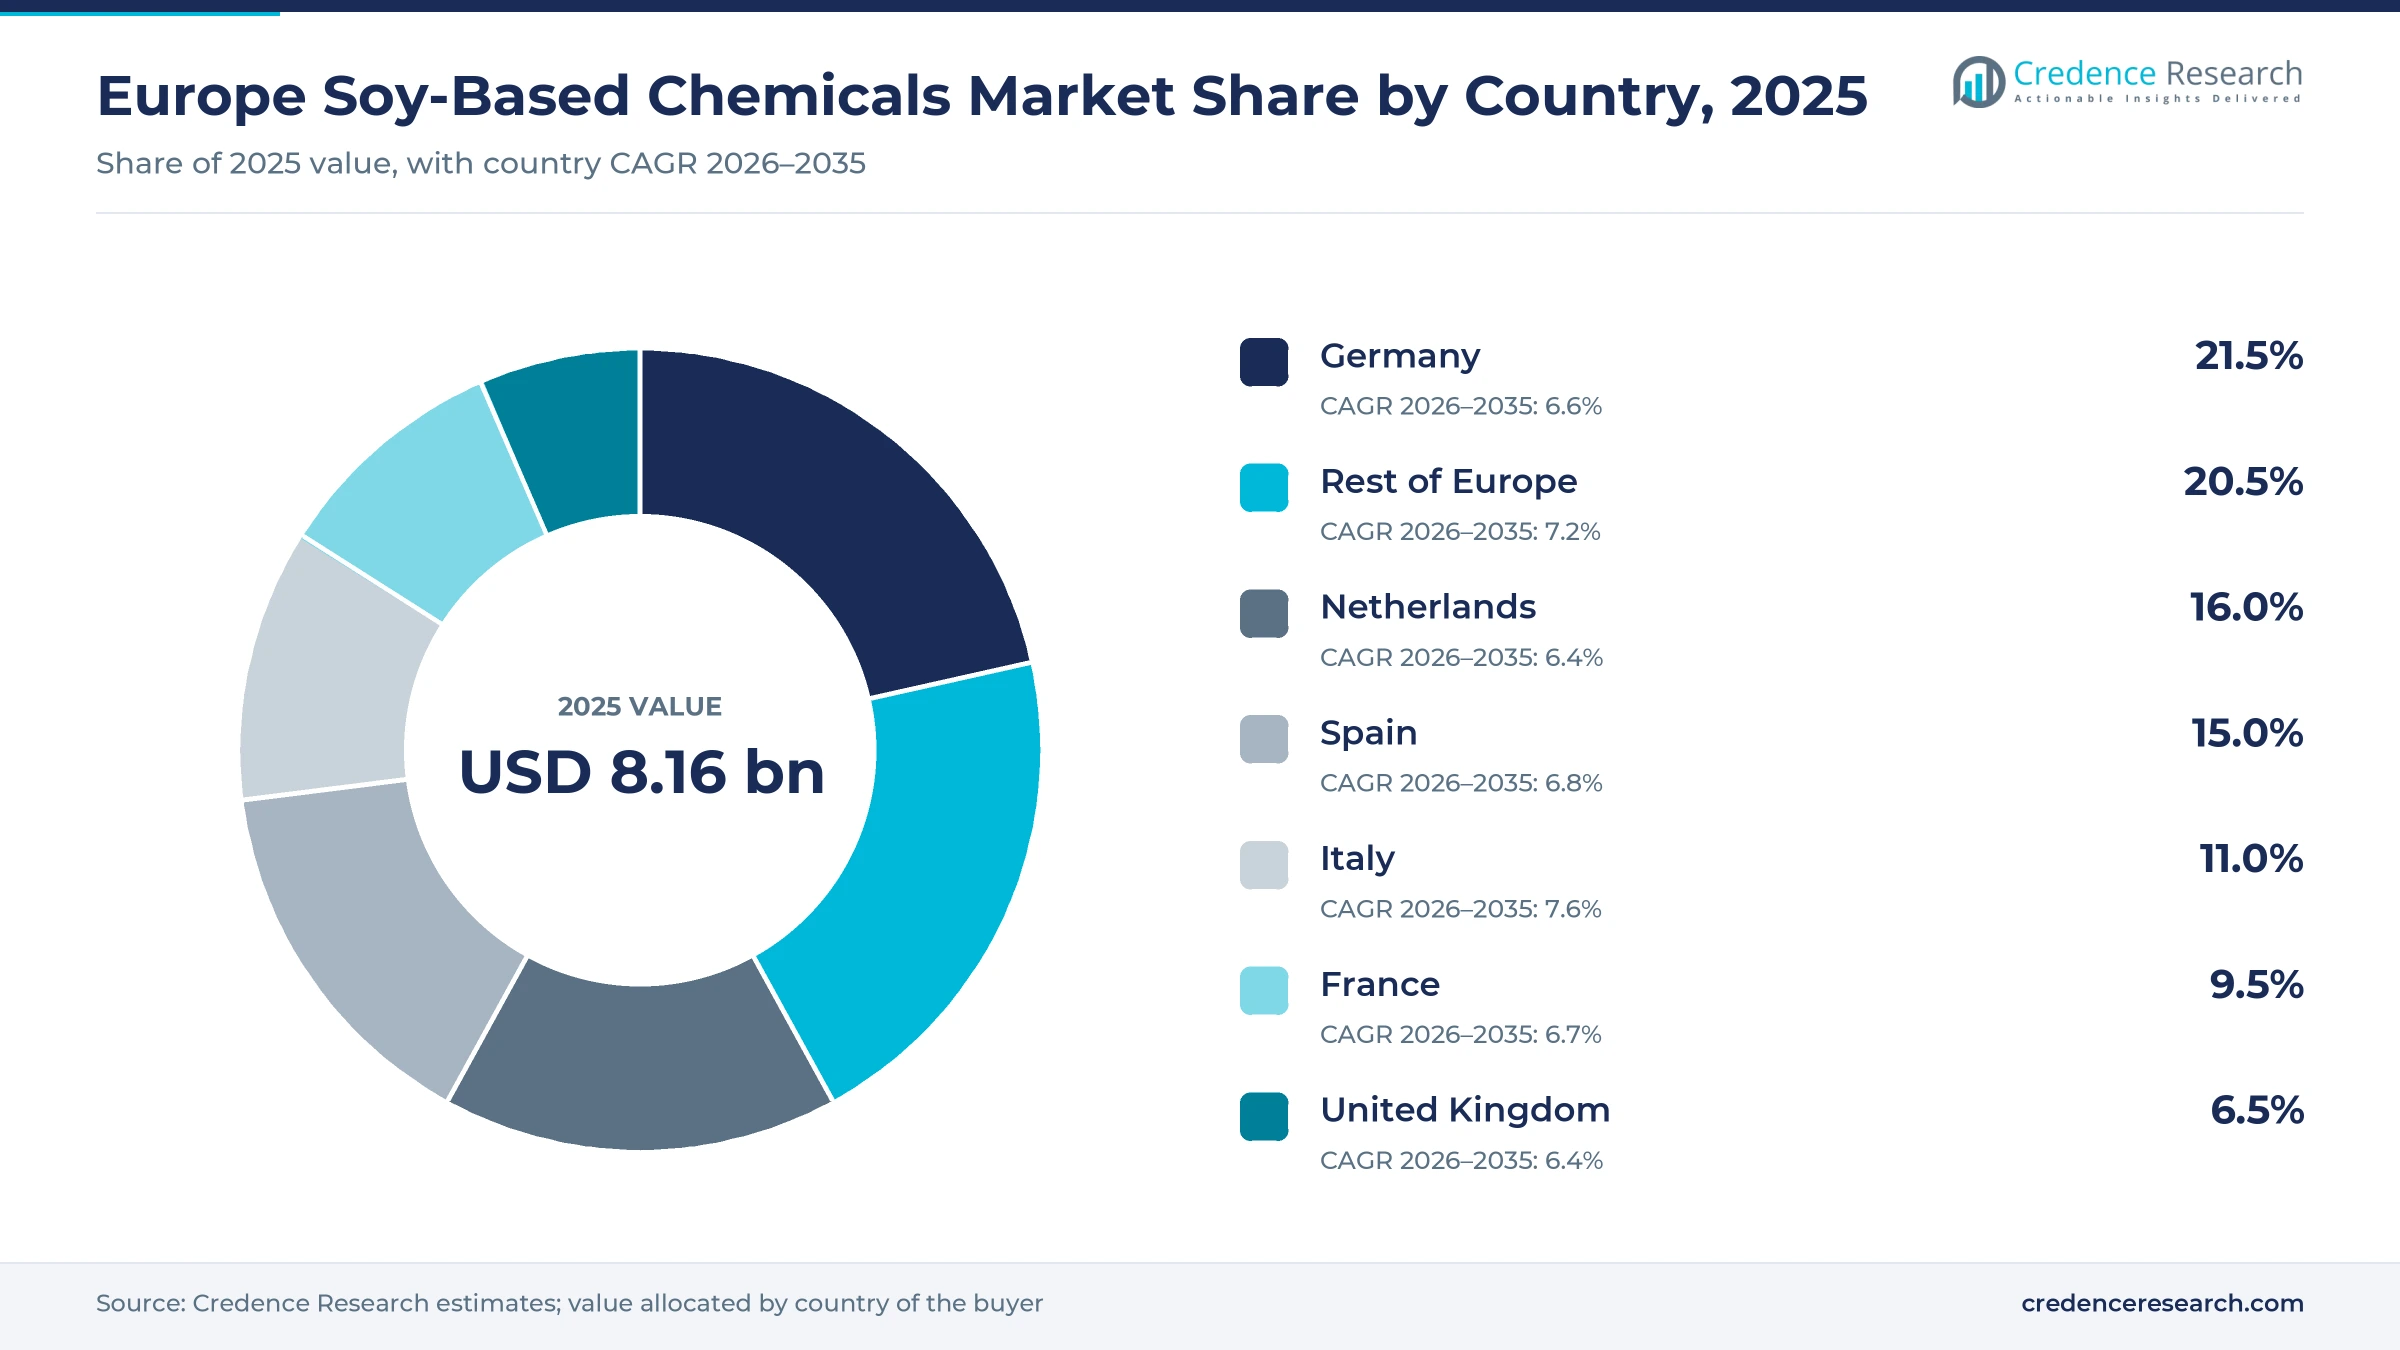
The Europe soy-based chemicals market was valued at USD 8.16 billion in 2025 and is projected to increase from USD 8.72 billion in 2026 to USD 15.81 billion by 2035, registering a CAGR of 6.84% during 2026–2035. Demand comes from food processors that buy lecithin and refined soybean oil, biodiesel blenders, makers of PVC plasticizers, coatings, adhesives and candles, and cosmetic and pharmaceutical formulators. Germany held the largest share, 21.5% in 2025, because it combines large port crush plants with the region's biggest chemical and food industries. Italy is the fastest-growing country at 7.6% a year, as the EU's largest soybean grower adds domestic processing capacity. The main swing factor is policy on soybean oil in biofuels, after the European Parliament rejected a 2026 plan to phase it out of renewable energy targets, while deforestation due diligence for soy starts for large operators at the end of 2026.
Which soy derivatives and buyers does the estimate count?
The estimate counts soybean oil sold to food processors and industrial users, soy methyl esters sold as biodiesel or solvent, soy fatty acids and lecithin, soy-based polymers such as epoxidized oils, polyols and soy-flour adhesives, and soy wax, valued at the first sale by the producer in European countries.
Soybean meal, soy protein isolates sold as food ingredients and hydrotreated renewable diesel sit outside the estimate, although they draw on the same crush. Europe here includes the EU-27, the United Kingdom, Ukraine, Serbia, Turkey and Russia, whose crushers supply roughly a third of the region's soybean oil, by Credence Research estimates. Biodiesel blenders and food companies buy oil and esters on contracts priced off vegetable oil benchmarks, while lecithin, plasticizers and adhesives sell on specifications, certificates of origin and non-GM status.
Europe Soy-Based Chemicals Market Insights
- The market is valued at USD 8.16 billion in 2025 and is projected to reach USD 15.81 billion by 2035, growing at a 6.84% CAGR as food, industrial and fuel buyers absorb soybean oil.
- Germany led with 21.5% of 2025 value, because it pairs large soybean crush plants with the region's biggest chemical and food processing industries.
- Soy Oil held 36.0% of 2025 value, while Soy-Based Polymers grow fastest at 8.3% a year as panel makers drop formaldehyde resins.
- The European Parliament voted 388 to 248 on July 8, 2026 to reject a Commission act that would have phased soybean biofuels out of renewable targets.
- Large and medium operators must apply EU deforestation due diligence to soy from Dec. 30, 2026, which favors traceable European and North American beans.
Soy oil leads while soy polymers grow fastest
Why does soy oil lead while soy polymers grow fastest?
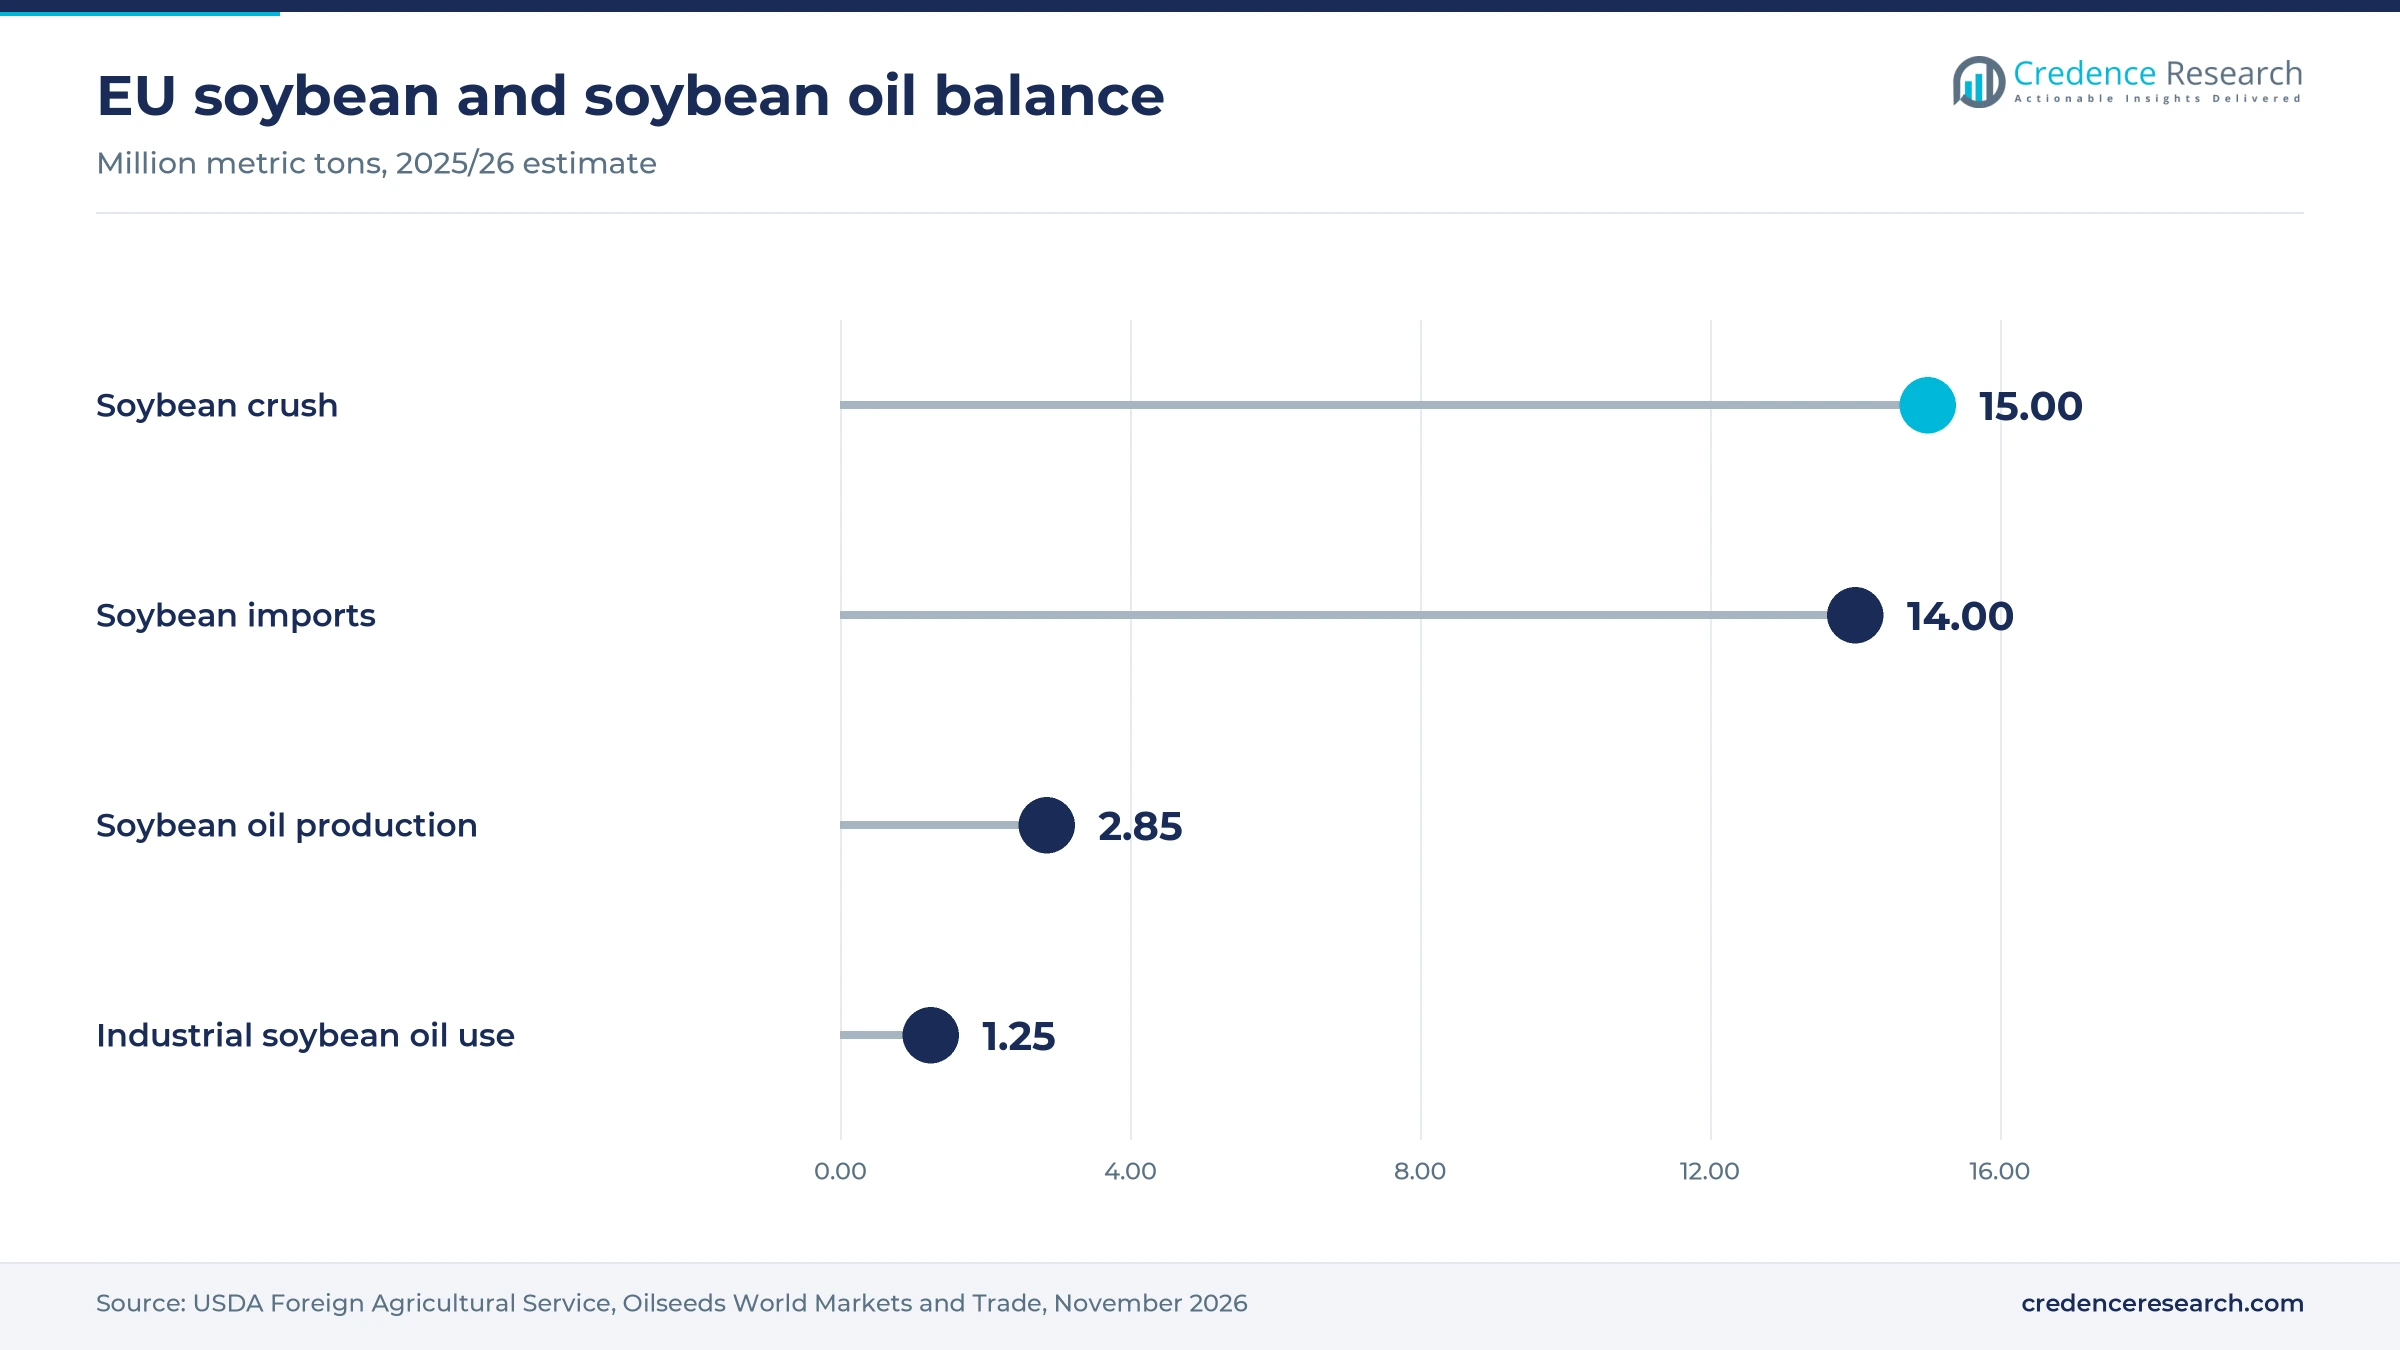
Based on type, the market is categorized into soy oil, soy methyl esters, soy fatty acids and lecithin, soy-based polymers and soy wax. Soy Oil led with 36.0% of 2025 value because EU crushers produced about 2.85 million metric tons of soybean oil in 2025/26, according to the USDA Foreign Agricultural Service, and most of it is sold before further conversion. Soy-Based Polymers grow fastest at 8.3% a year as panel makers drop formaldehyde resins, and Solenis says Panguaneta of Sabbioneta, Italy, became the first European mill with no-added-formaldehyde CARB 2 registration using its Soyad soy adhesive.
Why do food uses lead while industrial uses grow fastest?
Based on application, the market is categorized into food and beverages, industrial, biofuels and energy, cosmetics and personal care, and others. Food & Beverages led with 33.0% of 2025 value because refined oil for frying, margarine and dressings, and lecithin for chocolate and bakery, take most of the 2.85 million metric tons of soybean oil EU crushers make, while industrial use is only about 1.25 million tons, USDA data show. Industrial uses grow fastest at 7.8% a year as PVC makers adopt epoxidized oil additives under REACH phthalate limits, which Ineris documents, panel makers drop formaldehyde resins and the 2025 Bioeconomy Strategy plans bio-based content targets.
Why does transport lead while healthcare grows fastest?
Based on end-use industry, the market is categorized into automotive and transportation, food processing, packaging, construction, healthcare and others. Automotive & Transportation led with 25.0% of 2025 value because diesel sold in Europe typically carries 7% biodiesel, and RED III allows up to 10%, Fastmarkets reported in July 2026. Rapeseed oil remains the dominant crop feedstock, however, so soy esters hold only a minority of this outlet, according to the European Biodiesel Board. Healthcare grows fastest at 7.8% a year from a small base, as Lasenor of Olesa de Montserrat, Spain, supplies non-GM and organic soy lecithin to pharmaceutical excipient buyers from six production centers.
| Segment Group | Leading Sub-segment | Share, 2025 | Fastest-growing Sub-segment | CAGR, 2026–2035 |
|---|---|---|---|---|
| By Type | Soy Oil | 36.0% | Soy-Based Polymers | 8.3% |
| By Application | Food & Beverages | 33.0% | Industrial | 7.8% |
| By End-Use Industry | Automotive & Transportation | 25.0% | Healthcare | 7.8% |
Vegetable oil benchmarks set the floor for soy derivatives
Pricing starts with crude soybean oil, which accounts for most of the cash cost of methyl esters, lecithin, epoxidized oil and wax. European buyers pay benchmark-linked prices plus origin premiums, which now include the cost of proving deforestation-free supply. Biodiesel made from soybean oil competes on price with used cooking oil methyl ester, so crusher margins on the fuel outlet depend on that spread. Lecithin, plasticizers and adhesives sell at a premium on specification and non-GM status, but suppliers do not publish contract prices, so the lecithin range is a Credence Research estimate.
| Product or reference | Typical price or fee | Basis |
|---|---|---|
| Soybean oil benchmark, 2024 average | USD 1,022 per metric ton | World Bank Pink Sheet, May 2026 |
| Soybean oil benchmark, 2025 average | USD 1,140 per metric ton | World Bank Pink Sheet, May 2026 |
| Soybean oil benchmark, April 2026 | USD 1,624 per metric ton | World Bank Pink Sheet, May 2026 |
| Used cooking oil methyl ester, FOB ARA | USD 1,599.75 per metric ton | Fastmarkets, July 9, 2026 |
| Fluid soy lecithin, food grade, bulk | About USD 1,400-2,400 per metric ton | Credence Research estimate from oil cost, degumming yield and non-GM premiums |
Request a Free Sample
Fill in your details and we'll send you a free sample report.
- Sample data tables & charts
- Research methodology
Crush scale, non-GM food grades and bio-based policy
Port crush plants keep soybean oil flowing
Large port crush plants are the supply base for every soy derivative in Europe, because they convert imported beans into oil close to food, fuel and chemical buyers. EU soybean crush reached 15.40 million metric tons in 2024/25 and is estimated at 15.00 million metric tons in 2025/26, according to the USDA Foreign Agricultural Service. USDA expects the crush to ease to 14.85 million metric tons in 2026/27, which caps how fast oil supply can grow. Oil makes up only about 18% of the bean by weight, Donau Soja notes, so crushers sell it as a coproduct of meal and price it to clear. Derivative makers next to these plants, including producers of oleochemicals, gain freight and supply security.
Non-GM food grades pull processing investment
Food companies in Europe pay for non-GM and identity-preserved soy, which pushes crushers to segregate lines and lifts the value of lecithin and refined oil. ADM said its new non-GMO soy processing line in Mainz, Germany, is up and running, completing a multi-million-dollar investment announced in April 2022 to meet demand from the European food sector. Sternchemie draws on some 150 research and development specialists and the Stern-Technology Center in Ahrensburg to develop lecithin uses for food makers. Non-GM beans are getting scarcer, as Donau Soja expects EU soybean self-sufficiency to fall from about 8% in 2025/26 to 6% in 2026/27. Crushers with segregated non-GM capacity capture the premium, while commodity-only plants sell into price-driven channels.
Bio-based content policy widens industrial outlets
EU policy is turning bio-based content from a voluntary claim into a purchasing criterion, which opens industrial uses for soy oil derivatives. The Commission presented its new Bioeconomy Strategy on Nov. 27, 2025, valuing the bioeconomy at EUR 2.7 trillion in 2023 and counting more than 17 million jobs, about 8% of EU employment. The strategy plans to raise bio-based content in products, possibly through targets in relevant legislation. Cargill sells NatureWax soy waxes in Europe that comply with the RAL-GZ 041 candle quality standard, including an EU-origin non-GM grade. Suppliers of soy-based bio-lubricants, waxes and plasticizers with certified bio-based content gain an edge once such targets apply.
Biodiesel blending keeps a large ester outlet
Diesel blending mandates keep a steady outlet for soy methyl esters, although soybean oil competes with rapeseed oil and waste fats for that demand. EU producers made 10.5 million metric tons of FAME biodiesel in 2025, according to the European Biodiesel Board, with rapeseed oil the dominant crop feedstock. Imports of Argentine biodiesel, mostly made from soybean oil, fell to just over 300,000 tons in 2025, from about 1 million to 1.2 million tons a year under a 2019 agreement, Fastmarkets reported. That gap leaves more room for European crushers that also run biodiesel plants, since B7 blending across the region still needs large ester volumes.
Traceable soybeans, waste feedstocks and low-ILUC openings
Buyers shift toward traceable, lower-risk soybean origins
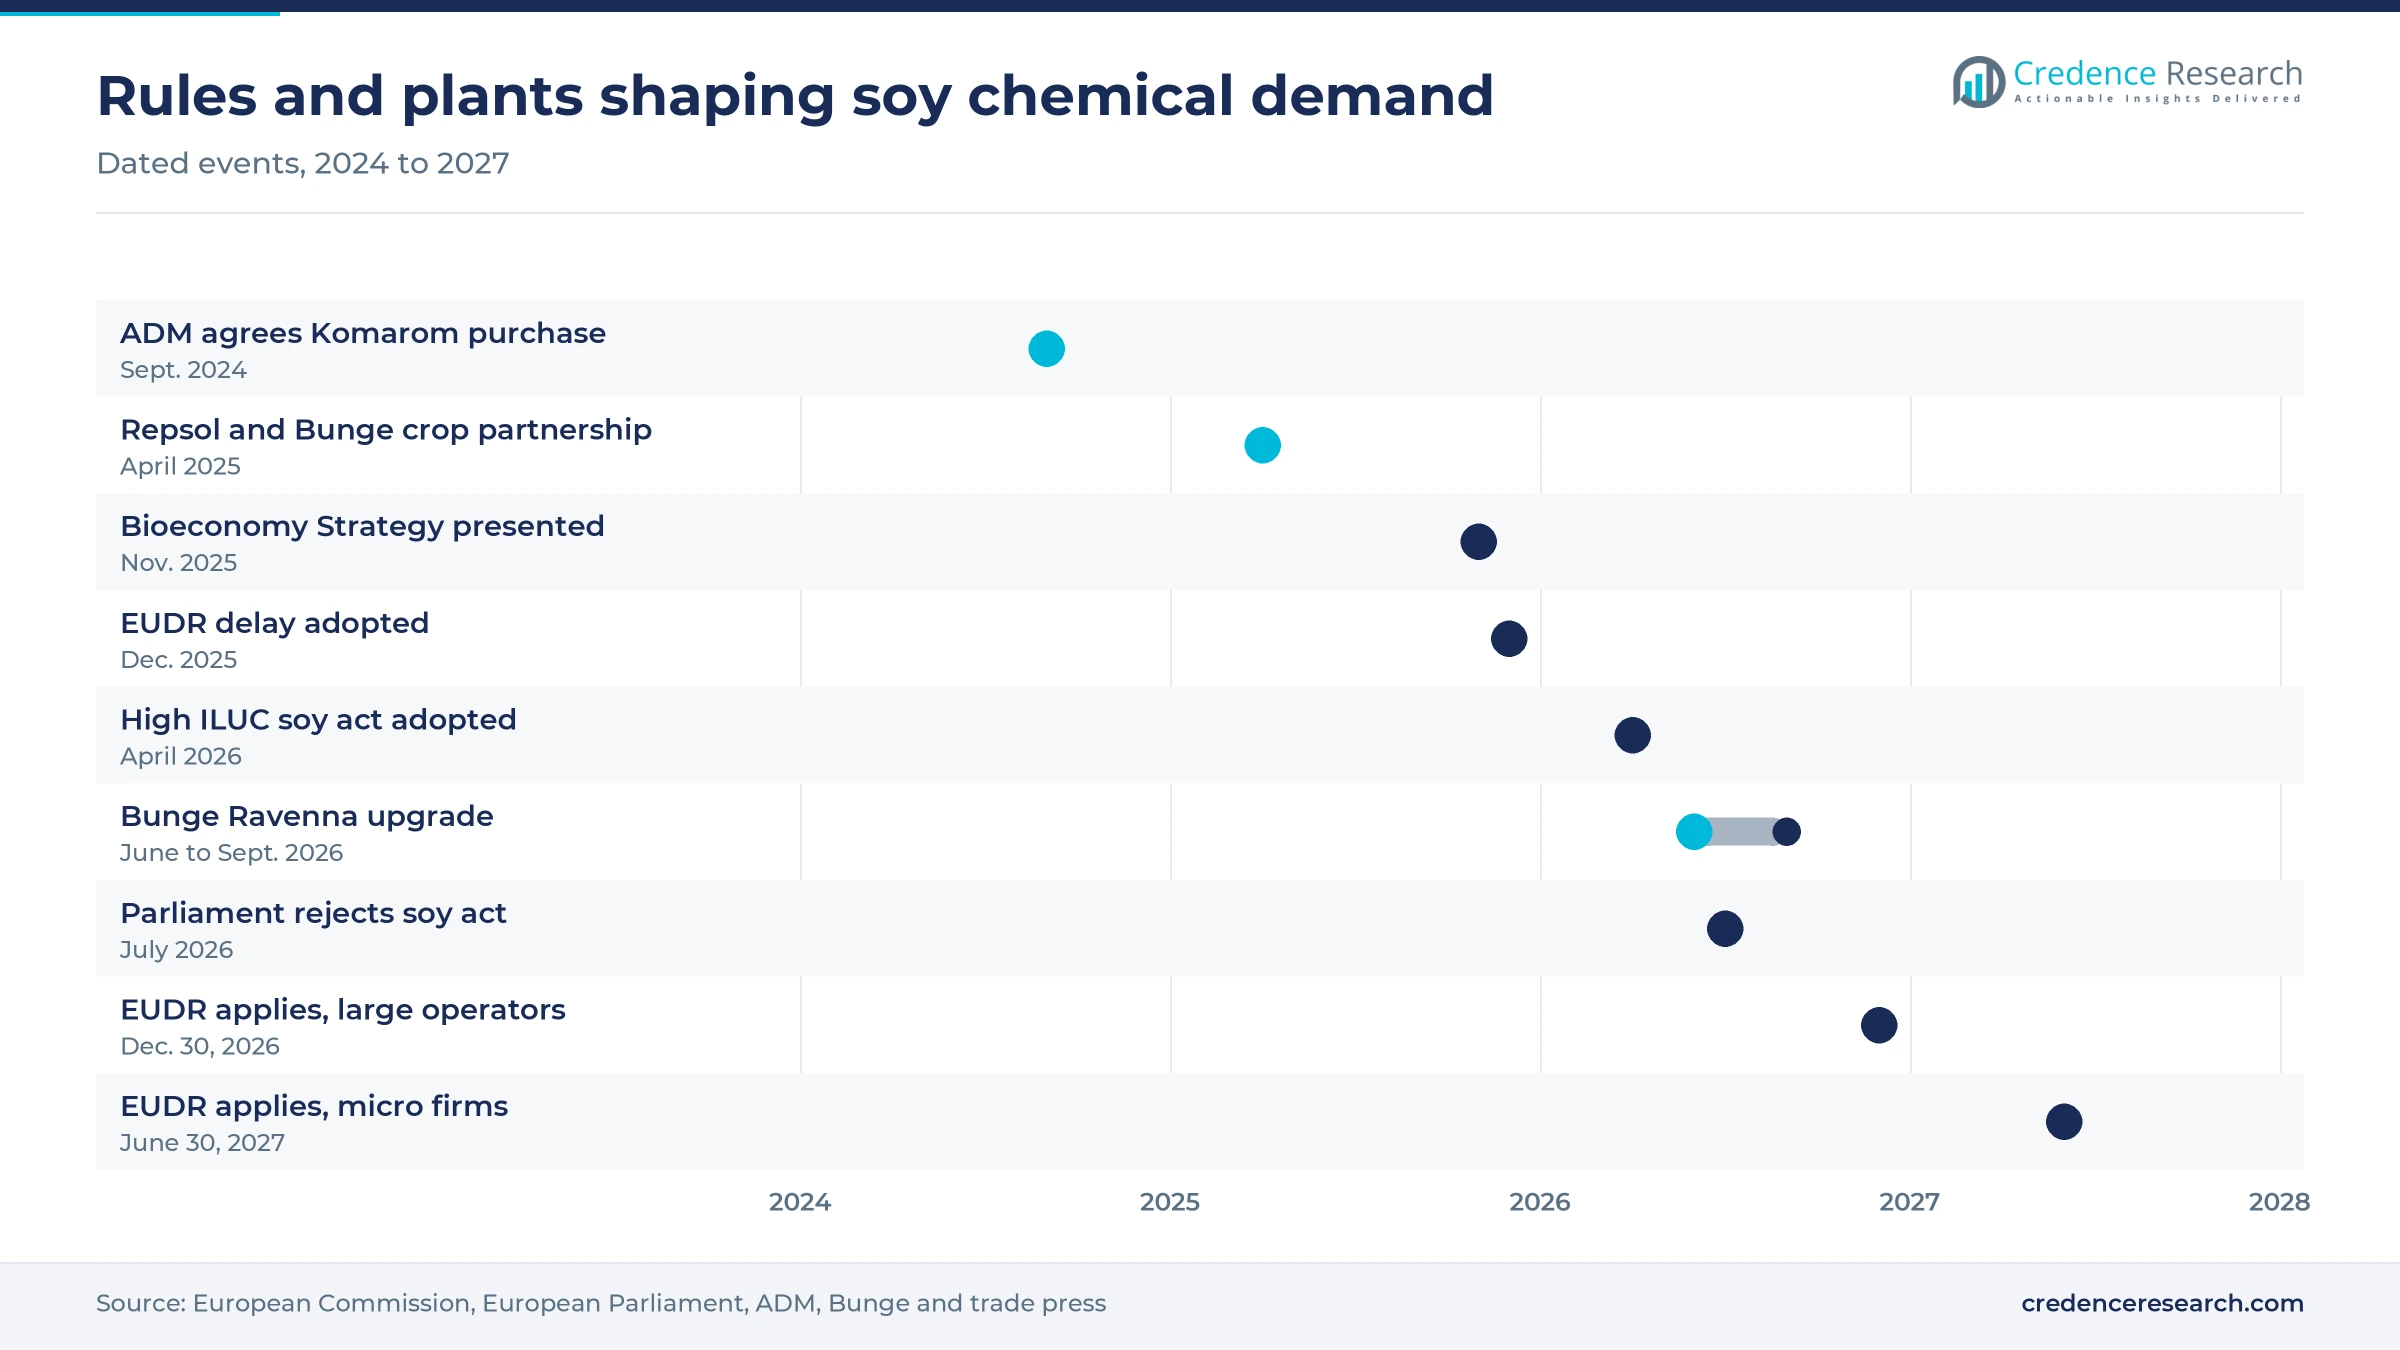
Importers are shifting toward soybeans that can pass deforestation due diligence, creating openings for traceable North American, Ukrainian and European beans across food and chemical grades. The EU deforestation regulation applies from Dec. 30, 2026 for large and medium operators and from June 30, 2027 for micro enterprises, under Regulation (EU) 2025/2650. EU soybean imports from July 1 to Dec. 21, 2025 totaled about 6 million tons, with 2.74 million tons from the United States, 2 million tons from Brazil and 599,000 tons from Ukraine, Commission data show. U.S. soybean exports to the EU were worth USD 2.2 billion in 2025, according to USDA. Crushers with segregated, mapped supply chains gain pricing power over buyers.
Fuel makers shift toward waste fats and renewable diesel
Fuel producers are shifting toward waste-based feedstocks and hydrotreated fuels to meet advanced biofuel targets, which reduces the share of soybean oil in European fuel demand. Annex IX waste feedstocks supplied 55% of EU biodiesel and bio-jet output in 2025, against 38% for crops, the European Biodiesel Board reported. Unblended HVO imports reached 1.76 million tons in 2025 and overtook biodiesel imports, Fastmarkets reported. Repsol and Bunge closed a partnership in April 2025 to grow camelina and safflower in Spain as feedstock for renewable diesel and aviation fuel. Soybean oil sellers need food and chemical outlets to offset that loss.
Domestic and Danube soybeans open a processing gap
Domestic soybean supply offers crushers a supply gap to fill, because European non-GM beans carry a premium and travel short distances to plants. Bunge invested EUR 4.4 million at Porto Corsini near Ravenna, Italy, to double processing of Italian-grown soybeans, with construction finished in June 2026 and full operation expected by the end of summer, World Grain reported. ADM agreed in September 2024 to buy a 700 metric ton per day non-GM soy and corn germ crush plant in Komarom, Hungary. ADM also says about 90% of the soy for its SojaProtein extrusion plant in Serbia grows within 100 km. Processors near growing regions can sell traceable oil and lecithin at a premium.
A redrafted ILUC rule opens room for certified soy oil
The rejected soy rule leaves an opening for certified low-risk soybean oil, because the Commission must now return with a new proposal before the 2030 phase-out it set out can apply. Parliament's July 8, 2026 objection means member states cannot adopt the act as it stood, and the soy coalition of COCERAL, COPA-COGECA, FEFAC, FEDIOL and the European Biodiesel Board asked for a new framework, OFI reported. A USDA Foreign Agricultural Service report said the Commission will assess certification for low-ILUC biofuels, including sequential cropping and intercropping, DTN reported in April 2026. Crushers that can document low-risk origin and farming practice stand to keep soybean oil eligible for fuel targets.
Fuel outlets shrink while oil prices and rules swing
Industrial soybean oil use is shrinking
The largest non-food outlet for soybean oil is contracting as fuel blenders move to waste fats. USDA estimates EU industrial soybean oil use at 1.40 million metric tons in 2024/25, 1.25 million in 2025/26 and 1.20 million in 2026/27. Spanish biodiesel and HVO demand fell to about 1.1 million tons from January to September 2025, from 1.3 million a year earlier, Argus reported, citing Cores. Crushers without food or chemical customers are the most exposed to this shift.
ILUC classification threatens the fuel outlet
The April 10, 2026 Commission act would have phased soybean biofuels out of renewable targets by 2030, and a redraft could return. Biofuels can account for up to 80% of soybean oil revenue for some crushers, especially in landlocked regions, Donau Soja says. Inland crushers in Central and Eastern Europe are most exposed, because they lack port access to export oil if the fuel outlet closes. Diversifying into lecithin and industrial grades reduces that dependence on fuel.
Oil price spikes squeeze formulators
Soybean oil prices rose sharply in early 2026, which squeezes formulators that sell against petroleum grades. The World Bank benchmark in the pricing table reached USD 1,624 per metric ton in April 2026, about 42% above the 2025 average. Makers of epoxidized plasticizers, waxes and polyols are most exposed, because PVC, candle and foam customers compare prices with fossil alternatives each quarter. Index-linked contracts reduce, but do not remove, the margin risk.
Sunflower lecithin draws away food buyers
Food buyers that want allergen-free or non-GM labels can switch to sunflower lecithin, which caps soy lecithin prices. Soy must be declared as an allergen on EU food labels under Annex II of Regulation (EU) No 1169/2011 while sunflower need not, so chocolate and bakery brands seeking clean labels can switch with little reformulation. Sternchemie and Lasenor both sell sunflower and rapeseed lecithin, so the switch costs buyers little. Soy lecithin producers without non-GM or organic certification are most exposed.
Germany leads as Italy grows fastest
| Country | Value, 2025 (USD billion) | Share, 2025 | CAGR, 2026–2035 |
|---|---|---|---|
| Germany | 1.75 | 21.5% | 6.6% |
| Rest of Europe | 1.67 | 20.5% | 7.2% |
| Netherlands | 1.31 | 16.0% | 6.4% |
| Spain | 1.22 | 15.0% | 6.8% |
| Italy | 0.90 | 11.0% | 7.6% |
| France | 0.77 | 9.5% | 6.7% |
| United Kingdom | 0.53 | 6.5% | 6.4% |
Germany leads on crush and chemical demand
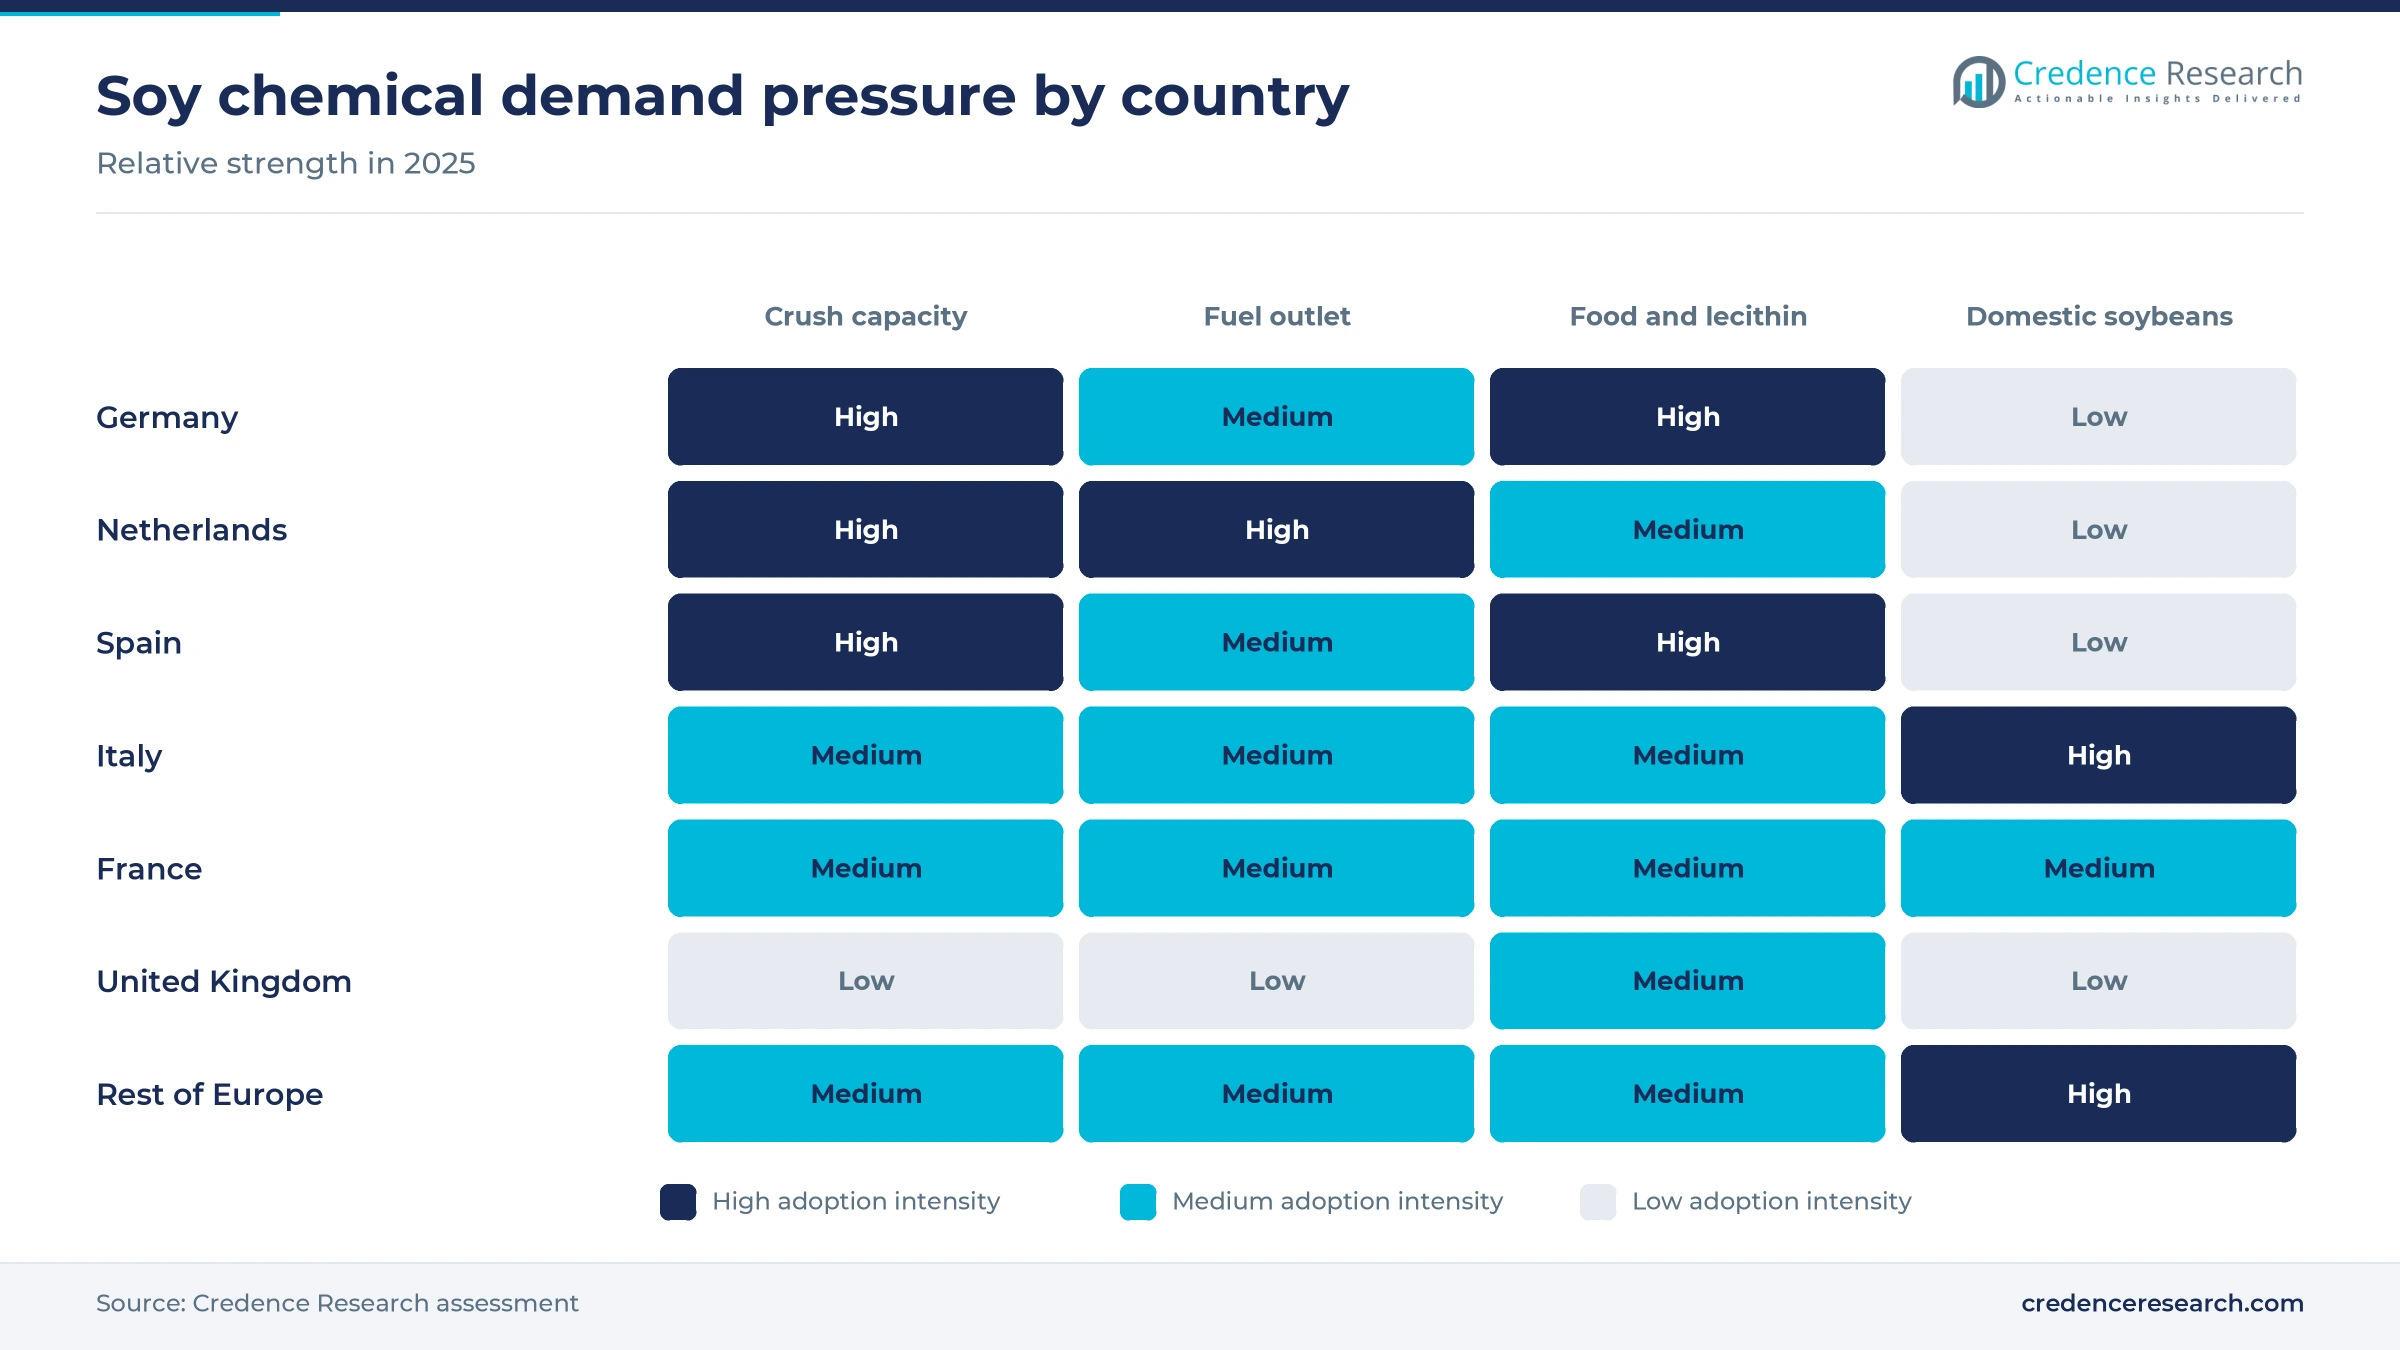
Germany held 21.5% of 2025 value and grows at 6.6% a year, because it pairs large crush plants with Europe's biggest chemical and food industries. Germany took 21% of EU soybean imports, making it the second-largest crushing member state, OFI reported in July 2023, citing USDA. ADM's non-GMO line in Mainz and Sternchemie's Hamburg lecithin business, both noted above, anchor the food grades. German soybean output is expected to rise 2.4% to 134,000 tons in 2026, Donau Soja reported, a small but growing local supply.
Netherlands runs the port crush and fuel hub
The Netherlands held 16.0% of 2025 value and grows at 6.4% a year, slower than the region, because its output depends on the fuel market. It took 25% of EU soybean imports, the largest share, according to the same 2023 USDA data. Bunge agreed in 2016 to buy Cargill's Amsterdam soybean and rapeseed crush plant with soybean oil refining, part of about 2 million tons of capacity, though current output there is not published. Planned removal of double counting in the Netherlands and Germany favors HVO and limits soy ester growth.
Spain crushes for its livestock and lecithin buyers
Spain held 15.0% of 2025 value and grows at 6.8% a year, in line with the region, because its crush serves a large export-oriented livestock sector. Spain has nearly 3.5 million tons a year of soybean crushing capacity in four plants, three run by Bunge in Barcelona, Bilbao and Cartagena and one by Cargill in Barcelona, OFI reported and Spain took 20% of EU soybean imports. Lasenor's Barcelona-area lecithin plant adds a specialty outlet for the oil, while weak domestic biodiesel demand limits the fuel outlet.
Italy grows fastest on domestic soybeans
Italy held 11.0% of 2025 value and grows fastest at 7.6% a year, because it is the EU's largest soybean grower and is adding processing for its own beans. Italy is expected to harvest about 900,000 tons in 2026, down 15% after heat and drought, Donau Soja reported in November 2026. The Ravenna upgrade noted above doubles processing of Italian beans, and Italian panel makers such as Panguaneta give soy adhesives a local buyer. Heat and drought swings remain the main constraint on growth.
France relies on port crush and food demand
France held 9.5% of 2025 value and grows at 6.7% a year, because its oilseed sector centers on rapeseed and sunflower, leaving soy a smaller role. Bunge agreed in 2016 to buy Cargill's soybean and rapeseed crush plant in the Port of Brest, although current output at the site is not published. Public data on French industrial soy derivative output are thin, so this share is a Credence Research estimate with a wide error range.
United Kingdom stays a smaller processing market
The United Kingdom held 6.5% of 2025 value and grows at 6.4% a year, below the regional average, because it has few soybean crush plants and imports most soy derivatives. Cargill kept its soybean processing plant in Liverpool in 2016, integrated with its local food and feed businesses, when it sold the Amsterdam and Brest sites. Public data on British soy chemical sales are limited, so this estimate rests on crush and trade proxies.
Rest of Europe gains on Danube soybean supply
The rest of Europe held 20.5% of 2025 value and grows at 7.2% a year, faster than the region, as Central and Eastern Europe and Ukraine expand non-GM soybean supply. Poland's 2026 crop is expected to rise more than 15% to 264,000 tons, while Austria's falls 36% to 180,000 tons, Donau Soja reported and Ukraine is expected to harvest about 4.4 million tons. Russian and Turkish crushers also supply soybean oil to the region, but public data on their derivative output are thin, so this share carries a wide error range.
ILUC vote, deforestation rules and crush upgrades
| Development | Status and market relevance |
|---|---|
| In September 2024, ADM agreed to acquire Vandamme Hungaria, a non-GM soy and corn germ crush plant in Komarom, Hungary. | Agreement announced in 2024; completion was not confirmed in public sources; the 700 metric ton per day plant adds non-GM oil and meal for European buyers. |
| In November 2025, the European Commission presented its new Bioeconomy Strategy, with plans to raise bio-based content in products. | Strategy announcement; targets would need separate legislation, which sets the pace for industrial soy derivative demand. |
| In December 2025, the EU adopted Regulation (EU) 2025/2650, delaying deforestation due diligence for soy and other commodities. | Adopted regulation; large and medium operators must comply from Dec. 30, 2026 and micro enterprises from June 30, 2027. |
| In April 2026, the Commission adopted Delegated Regulation (EU) 2026/2680, classing soybean biofuels as high ILUC risk. | Rejected; the European Parliament objected on July 8, 2026 by 388 votes to 248, according to HowTheyVote.eu roll-call data, so the Commission must redraft. |
| In July 2026, Bunge finished construction of a EUR 4.4 million upgrade at its Ravenna soybean plant in Italy. | Completed construction; full operation was expected by the end of summer 2026, doubling processing of Italian soybeans. |
Degumming, esterification and epoxidation widen uses
- Degumming of crude soybean oil separates the phospholipid gums that are dried and fractionated into fluid, deoiled and modified lecithins for food and pharmaceutical use.
- Transesterification with methanol turns soybean oil into methyl esters for biodiesel and low-odor solvents, with glycerin as a coproduct for other chemical uses.
- Epoxidation of soybean oil adds oxygen rings to the fatty acid chains, producing a plasticizer and heat stabilizer for PVC films, gaskets and coatings.
- Crosslinked soy flour adhesives react soy protein with a curing resin to bond plywood and engineered panels without added formaldehyde.
Need a Custom Version of This Report?
Tailor the scope, geography, or segments to your exact requirements.
- Custom geography or segment scope
- Direct access to our analyst team
Crushers own the oil while specialists own formulations
Competition turns on access to imported beans, port crush capacity, non-GM segregation and qualification with food and industrial formulators rather than on branding. ADM, Bunge and Cargill run port soybean crush plants across Europe and sell soybean oil, lecithin and industrial derivatives, and Cargill adds NatureWax soy waxes. ADM also owns SojaProtein in Serbia, which gives it Danube region origination. Sternchemie, part of the Stern-Wywiol Gruppe, and Lasenor compete in specialty lecithin, where certification and application support matter more than scale. Solenis supplies Soyad soy-flour adhesives to panel makers such as Panguaneta. Buyers usually qualify two oil sources but one lecithin or adhesive supplier per product line, which protects specialists. No European producer of epoxidized soybean oil or soy polyols could be verified for this update, so that tier is an evidence gap. The six companies profiled below cover crushing, lecithin, wax and adhesives.
How is the supply side organized and where do margins sit?
Supply of soy-based chemicals in Europe runs in two tiers. Integrated crushers such as ADM, Bunge and Cargill buy imported beans, sell crude and refined soybean oil, and also make lecithin, biodiesel or wax, which gives them feedstock cost advantages that independents cannot match. A second tier of soy-based chemicals specialists, including Sternchemie, Lasenor and Solenis, buys oil, gums or soy flour and sells formulated products on specification. Entry barriers sit in port access, non-GM segregation and customer qualification. Margins are thin in crude oil and esters and highest in certified lecithin and adhesives.
Companies profiled and their roles in this market
| Company | Type | Role in the market |
|---|---|---|
| Archer Daniels Midland Company | Integrated crusher | Crushes soybeans in Mainz, Germany and agreed in 2024 to buy a Hungarian crush plant |
| Bunge Global SA | Integrated crusher | Crushes soybeans in Spain and Italy and sells soybean oil and derivatives |
| Cargill, Incorporated | Integrated crusher | Crushes soybeans in Barcelona and sells lecithin and NatureWax soy waxes |
| Stern-Wywiol Gruppe (Sternchemie) | Lecithin specialist | Sells identity-preserved and organic soy lecithins from Hamburg for food uses |
| Lasenor | Lecithin specialist | Makes non-GM and organic soy lecithin in Spain for food and pharmaceutical buyers |
| Solenis LLC | Specialty chemical maker | Sells Soyad formaldehyde-free soy-flour adhesives to plywood and panel makers |
Biofuel rules decide what soybean oil earns
Credence Research's view is that biofuel policy decides what soybean oil earns in European soy-based chemicals more than chemistry does. The crushers that own port plants capture most of the value, but their fuel outlet now depends on a Commission rule that Parliament has rejected once and that may return in a new form. Specialists in lecithin, waxes and adhesives can grow regardless, because they sell on specification and certification. Buyers should secure traceable, deforestation-checked oil before due diligence starts at the end of 2026, when origin premiums are likely to widen.
Earlier estimate rolled forward and tested on oil supply
The report uses 2025 as the base year and forecasts to 2035. The earlier Credence Research estimate for 2024 was rolled forward one year at its own growth rate and tested against EU soybean oil output, oil supply in non-EU European countries, benchmark oil prices and typical conversion margins on derivatives. Country and segment shares are Credence Research estimates based on crush data, trade flows, biofuel blending and food and chemical output. Sources include USDA, World Bank, European Commission and European Biodiesel Board data, company pages and trade press. No interviews or surveys were conducted for this update of the estimate.
Rule clarity and traceable supply set growth to 2035
Growth to 2035 depends on whether soybean oil keeps its place in EU fuel targets and on how quickly traceable supply replaces unverified imports. The base case assumes soy stays eligible, deforestation checks start as scheduled and oil prices ease after the 2026 spike. Within soy-based chemicals, polymers, lecithin and industrial grades should gain share as bio-based content rules and formaldehyde limits favor them, while methyl esters lose ground to waste-based fuels. Italy and the Danube region add domestic beans, while port crush in Germany, the Netherlands and Spain remains the core.
Biofuel rules and oil prices set the range of outcomes
The spread of outcomes depends mainly on whether a redrafted Commission act again classes soybean oil as high ILUC risk and on how smoothly deforestation due diligence starts. Oil prices also decide whether industrial buyers keep switching from petroleum grades. A renewed phase-out would cut the fuel outlet and lower growth, while bio-based content targets and certified low-risk supply are the main upside.
| Scenario | CAGR, 2026–2035 | Value, 2035 | What has to hold |
|---|---|---|---|
| Downside | 5.2% | USD 13.80 billion | A redrafted act phases soybean biofuels out by 2030 and oil stays above USD 1,500 a ton |
| Base | 6.84% | USD 15.81 billion | Soy stays eligible for fuel targets, due diligence starts on time and oil prices stabilize |
| Upside | 7.8% | USD 17.19 billion | Bio-based content targets enter EU law and certified low-ILUC soy wins fuel volumes |
Frequently Asked Questions
How big is the Europe soy-based chemicals market?
Which type of soy chemical holds the largest share in Europe?
Which country leads the European soy chemical market?
Who are the main soy chemical suppliers in Europe?
Did the EU ban soybean oil in biofuels?
How much soybean oil does the EU produce?
When does deforestation due diligence apply to soy?
How fast do soy-based polymers grow in Europe?
Table of Content
Chapter 1 Market Segmentation
- 1.1 Segmentation Framework
- 1.1.1 Product and Service Classification
- 1.1.2 Application and End-Use Classification
- 1.1.3 Technology and Solution Classification
- 1.1.4 Customer and Distribution Channel Classification
- 1.1.5 Geographic Segmentation
- 1.1.6 Market Segment Definitions and Boundaries
- 1.2 By Type
- 1.2.1 Soy Oil
- 1.2.2 Soy Methyl Esters
- 1.2.3 Soy Fatty Acids & Lecithin
- 1.2.4 Soy-Based Polymers
- 1.2.5 Soy Wax
- 1.3 By Application
- 1.3.1 Food & Beverages
- 1.3.2 Industrial
- 1.3.3 Biofuels & Energy
- 1.3.4 Cosmetics & Personal Care
- 1.3.5 Others (Pharmaceuticals, Agriculture)
- 1.4 By End-Use Industry
- 1.4.1 Automotive & Transportation
- 1.4.2 Food Processing
- 1.4.3 Packaging
- 1.4.4 Construction
- 1.4.5 Healthcare
- 1.4.6 Others
- 1.5 By Country
- 1.5.1 Germany
- 1.5.2 Netherlands
- 1.5.3 Spain
- 1.5.4 Italy
- 1.5.5 France
- 1.5.6 United Kingdom
- 1.5.7 Rest of Europe
Chapter 2 Introduction
- 2.1 Report Objectives and Scope
- 2.2 Product Definition and Industry Terminology
- 2.3 Market Inclusions and Exclusions
- 2.4 Research Process
- 2.4.1 Primary Research and Expert Interviews
- 2.4.2 Secondary Research and Source Review
- 2.4.3 Top-Down and Bottom-Up Estimation
- 2.4.4 Data Triangulation and Verification
- 2.5 Market Size Measurement Basis
- 2.5.1 2025: USD 8.16 billion → 2035: USD 15.81 billion
- 2.6 Historical and Forecast Reference Periods
- 2.6.1 Historical Period: 2018-2025
- 2.6.2 Base Year: 2025
- 2.6.3 Forecast Period: 2025-2035
- 2.7 Research Assumptions and Limitations
Chapter 3 Executive Summary
- 3.1 Market Snapshot and Key Findings
- 3.2 Base-Year Market Size, 2025
- 3.3 Forecast Market Size, 2035
- 3.4 Revenue and Volume Growth Outlook
- 3.5 Key Demand and Supply Indicators
- 3.6 Leading Market Segments
- 3.7 Fastest-Growing Market Opportunities
- 3.8 Regional Performance Highlights
- 3.9 Technology and Industry Transformation
- 3.10 Competitive Landscape Summary
- 3.11 Analyst View and Strategic Implications
Chapter 4 Europe Soy-Based Chemicals Market Trends and Developments
- 4.1 Historical Industry Development, 2018-2025
- 4.2 Recent Market Trends and Developments
- 4.3 Demand and Customer Behavior Trends
- 4.4 Technology and Product Innovation
- 4.5 Artificial Intelligence, Automation and Digitalization
- 4.6 Local Manufacturing and Supply Chain Realignment
- 4.7 Industry Partnerships, Mergers and Acquisitions
- 4.8 Sustainability and Circular Economy Developments
- 4.9 Government and Private Sector Investment Trends
- 4.10 Emerging Business Models and Commercialization
- 4.11 Industry Developments and Announcements
Chapter 5 Europe Soy-Based Chemicals Market Production, Supply and Demand Analysis
- 5.1 Demand Trend and Consumption Analysis, 2018-2025
- 5.2 Demand Forecast, 2025-2035
- 5.3 Production and Output Trend, 2018-2025
- 5.4 Production and Output Forecast, 2025-2035
- 5.5 Installed Capacity and Capacity Utilization
- 5.6 Company-Wise Production Plants and Statistics
- 5.6.1 Installed Production Capacity
- 5.6.2 Actual Production
- 5.6.3 Planned Capacity and Expansion Targets
- 5.7 Supply Chain Structure and Procurement Trends
- 5.8 Supply-Demand Gap and Bottlenecks
- 5.9 Import Dependence and Sourcing Structure
- 5.10 Contract Manufacturing and Outsourcing
- 5.11 Regional Supply and Demand Concentration
Chapter 6 Europe Soy-Based Chemicals Market Pricing Analysis
- 6.1 Pricing Structure and Measurement
- 6.2 Historical Pricing Trends, 2018-2025
- 6.3 Pricing Outlook, 2025-2035
- 6.4 Average Selling Price and Unit Economics
- 6.5 Pricing by Product and Market Segment
- 6.6 Geographic Pricing Differences
- 6.7 Key Input, Energy, Labor and Logistics Costs
- 6.8 Contract Pricing and Purchasing Models
- 6.9 Pricing Sensitivity and Competitive Positioning
- 6.10 Price, Margin and Profitability Implications
Chapter 7 Europe Soy-Based Chemicals Market Dynamics
- 7.1 Market Growth Drivers
- 7.1.1 Demand-Side Drivers
- 7.1.2 Technology and Innovation Drivers
- 7.1.3 Infrastructure and Investment Drivers
- 7.1.4 Regulatory and Policy Drivers
- 7.2 Market Restraints
- 7.2.1 Cost and Affordability Constraints
- 7.2.2 Technology and Adoption Barriers
- 7.2.3 Supply Chain and Operational Constraints
- 7.3 Market Challenges
- 7.3.1 Competitive Pressure and Margin Erosion
- 7.3.2 Skills, Infrastructure and Implementation Gaps
- 7.4 Emerging Market Opportunities
- 7.5 Market Dynamics Impact and Time-Horizon Assessment
Chapter 8 Europe Soy-Based Chemicals Value Chain Analysis
- 8.1 Industry Value Chain Overview
- 8.2 Upstream Suppliers and Critical Inputs
- 8.3 Technology and Component Providers
- 8.4 Manufacturing or Service Delivery
- 8.5 Distribution, Channel Partners and Integrators
- 8.6 Downstream Applications and End Users
- 8.7 Value Addition and Profit Pools
- 8.8 Vertical Integration and Outsourcing
- 8.9 Supplier Concentration and Risk
- 8.10 Supply Chain Localization and Resilience
Chapter 9 Europe Soy-Based Chemicals Market Regulations and Policies
- 9.1 Relevant Laws, Standards and Compliance Frameworks
- 9.2 Product, Service, Safety and Quality Requirements
- 9.3 Government Policies, Incentives and Subsidies
- 9.4 Imports, Exports and Trade Barriers
- 9.5 Public Procurement and Local Content Requirements
- 9.6 Environmental and Sustainability Compliance
- 9.7 Upcoming Policy Changes and Market Implications
Chapter 10 Europe Soy-Based Chemicals Market Hotspots and Opportunities
- 10.1 Market Opportunity Mapping and Growth Hotspots
- 10.2 High-Growth Applications and Customer Groups
- 10.3 Underserved Markets and White-Space Opportunities
- 10.4 Emerging Technology and Product Opportunities
- 10.5 New Capacity and Investment Hotspots
- 10.6 Market Entry and Expansion Opportunities
- 10.7 Distribution and Partnership Opportunities
- 10.8 Near-Term and Long-Term Commercial Potential
- 10.9 Opportunity Attractiveness and Execution Risks
Chapter 11 Europe Soy-Based Chemicals Market Outlook, 2025-2035
- 11.1 Market Size and Analysis
- 11.1.1 Revenue (Market Measurement: 2025: USD 8.16 billion → 2035: USD 15.81 billion)
- 11.1.2 Market Volume and Quantity Sold
- 11.1.3 Historical Market Size, 2018-2025
- 11.1.4 Base-Year Market Size, 2025
- 11.2 Market Forecast, 2025-2035
- 11.2.1 Revenue Forecast to 2035
- 11.2.2 Volume Forecast to 2035
- 11.2.3 CAGR and Year-on-Year Growth
- 11.2.4 Incremental Revenue Opportunity
- 11.3 Forecast Assumptions and Scenario Analysis
- 11.3.1 Base-Case Forecast
- 11.3.2 Optimistic and Conservative Scenarios
- 11.3.3 Technology, Pricing and Policy Sensitivities
- 11.4 Market Attractiveness and Growth Outlook
Chapter 12 Europe Soy-Based Chemicals Market Segmentation and Outlook
- 12.1 Segmentation Summary and Market Shares, 2025
- 12.2 Largest and Fastest-Growing Segments
- 12.3 By Type - Market Size and Forecast, 2025-2035
- 12.3.1 Segment Definition and Scope
- 12.3.2 Historical Market Size, 2018-2025
- 12.3.3 Revenue Forecast, 2025-2035
- 12.3.4 Volume Forecast, 2025-2035
- 12.3.5 Base-Year Market Share, 2025
- 12.3.6 Segment CAGR and Growth Drivers
- 12.3.7 Subsegment Market Size and Forecast
- 12.3.7.1 Soy Oil
- 12.3.7.2 Soy Methyl Esters
- 12.3.7.3 Soy Fatty Acids & Lecithin
- 12.3.7.4 Soy-Based Polymers
- 12.3.7.5 Soy Wax
- 12.3.8 Subsegment Pricing and Adoption Trends
- 12.3.9 Leading Suppliers and Competition
- 12.3.10 Regional Demand and Opportunities
- 12.4 By Application - Market Size and Forecast, 2025-2035
- 12.4.1 Segment Definition and Scope
- 12.4.2 Historical Market Size, 2018-2025
- 12.4.3 Revenue Forecast, 2025-2035
- 12.4.4 Volume Forecast, 2025-2035
- 12.4.5 Base-Year Market Share, 2025
- 12.4.6 Segment CAGR and Growth Drivers
- 12.4.7 Subsegment Market Size and Forecast
- 12.4.7.1 Food & Beverages
- 12.4.7.2 Industrial
- 12.4.7.3 Biofuels & Energy
- 12.4.7.4 Cosmetics & Personal Care
- 12.4.7.5 Others (Pharmaceuticals, Agriculture)
- 12.4.8 Subsegment Pricing and Adoption Trends
- 12.4.9 Leading Suppliers and Competition
- 12.4.10 Regional Demand and Opportunities
- 12.5 By End-Use Industry - Market Size and Forecast, 2025-2035
- 12.5.1 Segment Definition and Scope
- 12.5.2 Historical Market Size, 2018-2025
- 12.5.3 Revenue Forecast, 2025-2035
- 12.5.4 Volume Forecast, 2025-2035
- 12.5.5 Base-Year Market Share, 2025
- 12.5.6 Segment CAGR and Growth Drivers
- 12.5.7 Subsegment Market Size and Forecast
- 12.5.7.1 Automotive & Transportation
- 12.5.7.2 Food Processing
- 12.5.7.3 Packaging
- 12.5.7.4 Construction
- 12.5.7.5 Healthcare
- 12.5.7.6 Others
- 12.5.8 Subsegment Pricing and Adoption Trends
- 12.5.9 Leading Suppliers and Competition
- 12.5.10 Regional Demand and Opportunities
- 12.6 By Country - Market Size and Forecast, 2025-2035
- 12.6.1 Segment Definition and Scope
- 12.6.2 Historical Market Size, 2018-2025
- 12.6.3 Revenue Forecast, 2025-2035
- 12.6.4 Volume Forecast, 2025-2035
- 12.6.5 Base-Year Market Share, 2025
- 12.6.6 Segment CAGR and Growth Drivers
- 12.6.7 Subsegment Market Size and Forecast
- 12.6.7.1 Germany
- 12.6.7.2 Netherlands
- 12.6.7.3 Spain
- 12.6.7.4 Italy
- 12.6.7.5 France
- 12.6.7.6 United Kingdom
- 12.6.7.7 Rest of Europe
- 12.6.8 Subsegment Pricing and Adoption Trends
- 12.6.9 Leading Suppliers and Competition
- 12.6.10 Regional Demand and Opportunities
- 12.7 Segment Growth Comparison
- 12.8 Segment Attractiveness and Priority Matrix
Chapter 13 Europe Soy-Based Chemicals End-Use and Application Market Outlook
- 13.1 End-Use Industry and Customer Demand Structure
- 13.2 Leading Applications and Customer Groups
- 13.3 End-Use Market Size, Share and Forecast
- 13.4 Major End-Use Industry Deep Dives
- 13.4.1 Customer Requirements and Use Cases
- 13.4.2 Demand and Replacement Cycles
- 13.4.3 Technical and Regulatory Considerations
- 13.4.4 Purchasing and Procurement Models
- 13.4.5 Leading Vendors and Distribution Channels
- 13.4.6 Forecast and Commercial Opportunities
- 13.5 Emerging Applications and Cross-Segment Demand
- 13.6 End-Use Industry Investment Priorities
Chapter 14 Europe Soy-Based Chemicals Geographic Market Outlook, 2025-2035
- 14.1 Regional Market Size and Country-Level Shares, 2025
- 14.2 Country Market Size Comparison, 2025
- 14.3 Country Market Forecasts, 2025-2035
- 14.4 Subregional Industrial and Demand Clusters
- 14.5 Intra-Regional Pricing and Cost Differences
- 14.6 Cross-Border Trade and Supply Networks
- 14.7 Regional Supply and Demand Balances
- 14.8 Country Opportunity Comparison and Prioritization
Note: Every listed country is covered on the structure shown under the first country.
Chapter 15 Europe Soy-Based Chemicals Technology, Innovation and Sustainability Outlook
- 15.1 Technology Landscape and Maturity
- 15.2 Product, Process and Service Innovation
- 15.3 AI, Automation and Digital Tools in the Industry
- 15.4 Technology Adoption and Performance Benchmarking
- 15.5 Innovation Pipeline and R&D Investment
- 15.6 Patent and Intellectual Property Trends
- 15.7 Energy Efficiency and Resource Management
- 15.8 Sustainability, Recycling and Circularity
- 15.9 Technology Roadmap, 2025-2035
- 15.10 Risks of Obsolescence and Technology Substitution
Chapter 16 Europe Soy-Based Chemicals Market Key Strategic Imperatives
- 16.1 Growth and Market Entry Priorities
- 16.2 High-Return Products and Segments
- 16.3 Pricing, Profitability and Cost Optimization
- 16.4 Technology Investment and Product Differentiation
- 16.5 Supply Chain Localization and Resilience
- 16.6 Distribution and Customer Acquisition
- 16.7 Partnership, Acquisition and Capacity Strategy
- 16.8 Regional Expansion Priorities
- 16.9 Short-, Medium- and Long-Term Actions
Chapter 17 Competition Outlook
- 17.1 Industry Competition Characteristics
- 17.2 Market Structure and Concentration
- 17.3 Market Share and Competitive Positioning, 2025
- 17.4 Company-Wise Revenue and Product Benchmarking
- 17.5 Production and Service Capacity Benchmarking
- 17.6 Technology, Pricing and Differentiation
- 17.7 Regional Footprint and Distribution Strength
- 17.8 Mergers, Acquisitions and Strategic Alliances
- 17.9 New Entrants and Competitive Threats
- 17.10 Porter's Five Forces and Industry Attractiveness
- 17.11 Competitive Outlook, 2025-2035
Chapter 18 Company Profiles
- 18.1 Company Coverage and Selection Criteria
- 18.2 Archer Daniels Midland Company
- 18.2.1 Business Description
- 18.2.2 Company Ownership and Geographic Presence
- 18.2.3 Product and Service Portfolio
- 18.2.4 Manufacturing and Operating Footprint
- 18.2.5 Production Capacity and Expansion Plans
- 18.2.6 Financial Performance and Investment
- 18.2.7 Market Share and Competitive Position
- 18.2.8 Technology and Innovation Capabilities
- 18.2.9 Strategic Alliances or Partnerships
- 18.2.10 Recent Developments
- 18.2.11 Growth Strategy and Outlook
- 18.3 Bunge Global SA
- 18.4 Cargill, Incorporated
- 18.5 Stern-Wywiol Gruppe (Sternchemie)
- 18.6 Lasenor
- 18.7 Solenis LLC
- 18.8 Other Relevant Market Participants
Note: Every listed company is profiled on the structure shown under the first company. The company list is preliminary and may change based on research findings, market developments, data availability and client requirements.
Chapter 19 Disclaimer
- 19.1 Research and Forecast Disclaimer
- 19.2 Data Source and Estimation Limitations
Note: The depth of individual sections depends on data availability for this market. Volume, capacity, trade and other unit-based metrics are included where applicable.

