Market Overview:
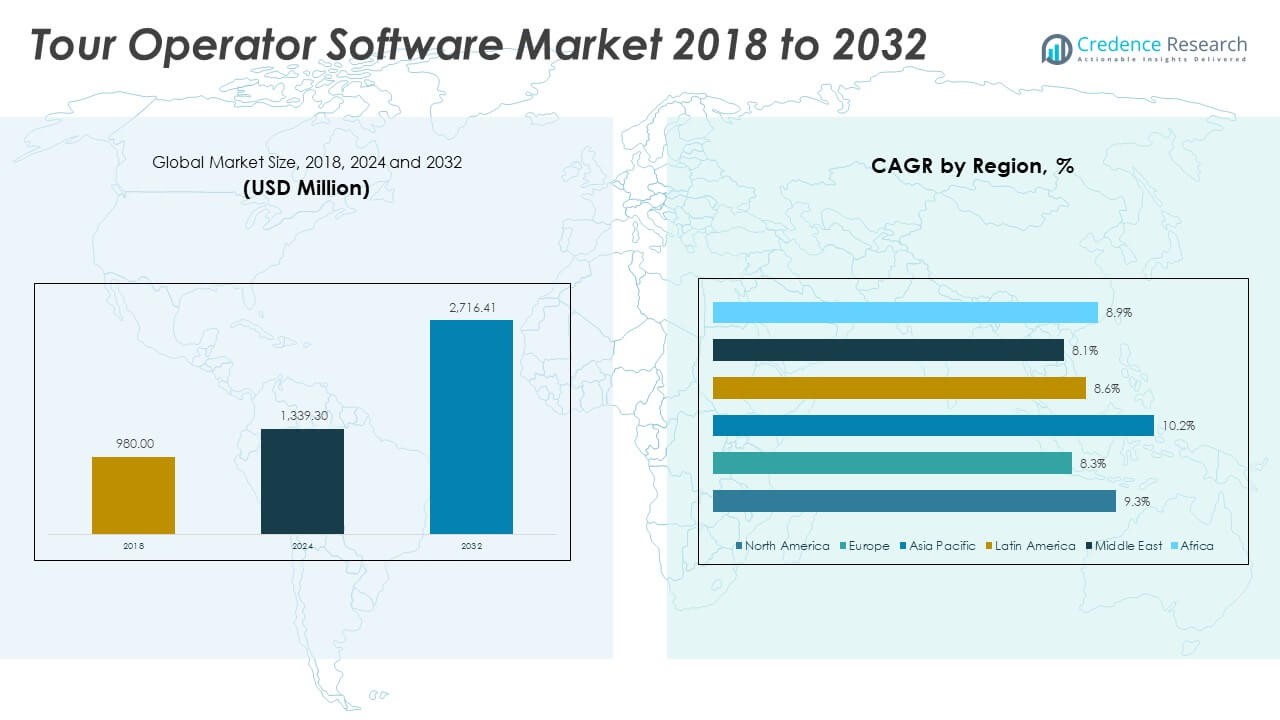
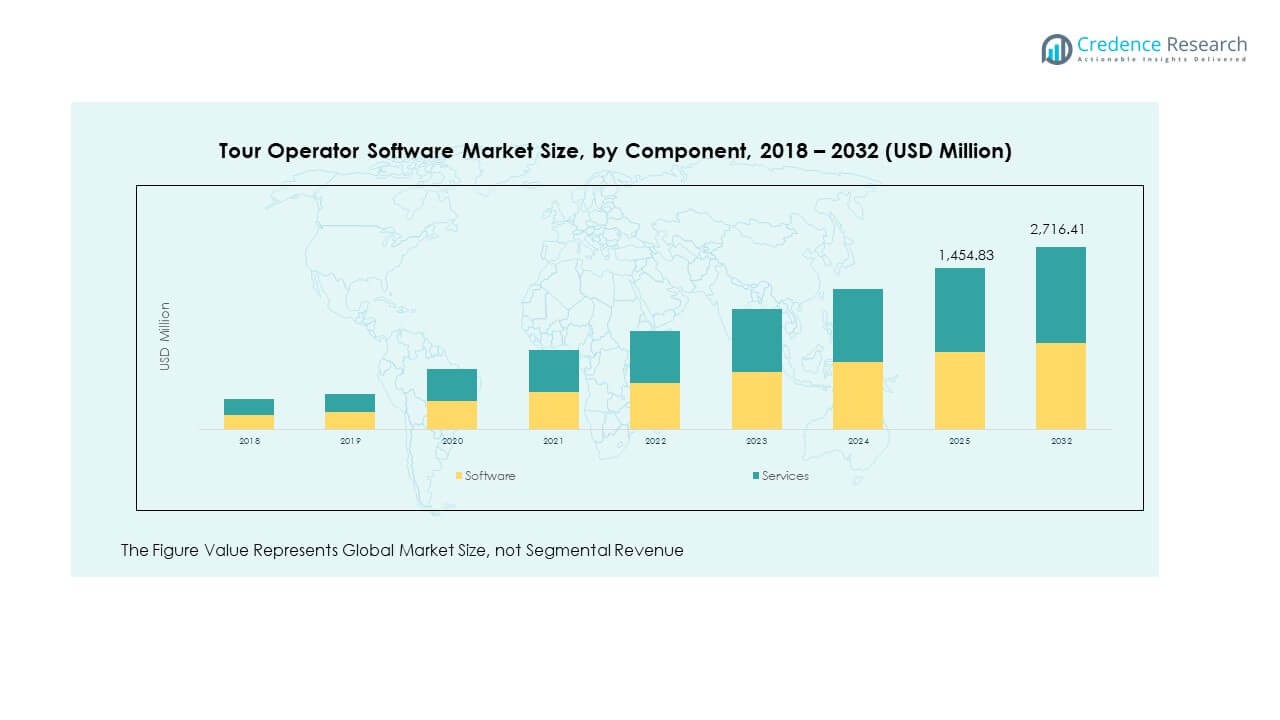
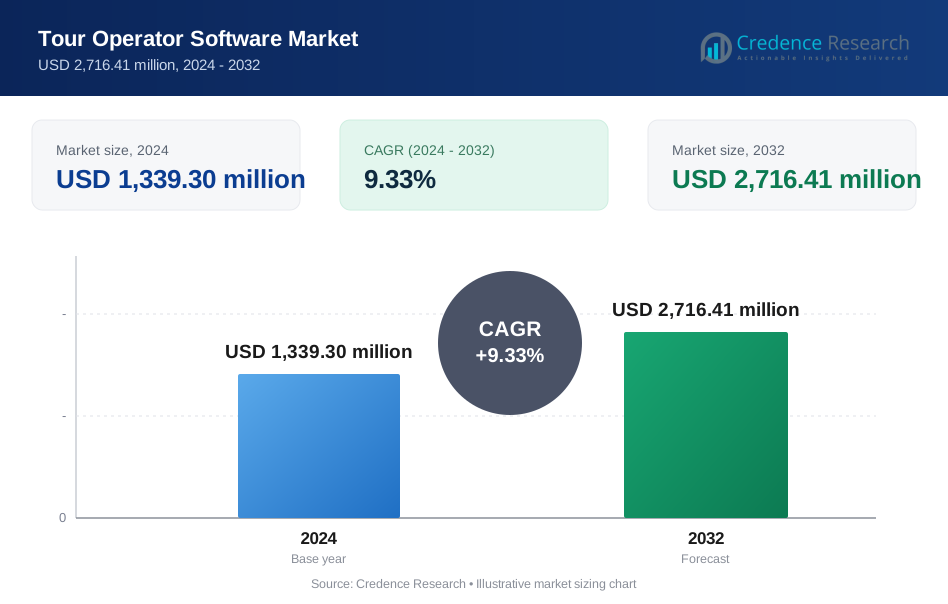
The Global Tour Operator Software Market size was valued at USD 980.00 million in 2018 to USD 1,339.30 million in 2024 and is anticipated to reach USD 2,716.41 million by 2032, at a CAGR of 9.33% during the forecast period.
| REPORT ATTRIBUTE | DETAILS |
|---|---|
| Historical Period | 2020-2023 |
| Base Year | 2024 |
| Forecast Period | 2025-2032 |
| Tour Operator Software Market Size 2024 | USD 1,339.30 Million |
| Tour Operator Software Market, CAGR | 9.33% |
| Tour Operator Software Market Size 2032 | USD 2,716.41 Million |
The market growth is driven by the rising adoption of digital platforms that enhance booking efficiency, improve customer engagement, and streamline operations for travel agencies. Increasing demand for personalized travel packages, coupled with the growing penetration of mobile applications and cloud-based solutions, has further boosted adoption. The need for real-time updates, seamless payment systems, and automated back-office processes also strengthens market expansion, making software a critical tool for tour operators.
Geographically, North America and Europe lead the market due to advanced technology adoption, strong tourism infrastructure, and established players. Asia Pacific is emerging rapidly, supported by rising disposable incomes, expanding internet penetration, and increasing outbound tourism. The Middle East and Latin America are also witnessing growth, driven by government initiatives to promote tourism and the increasing role of online travel agencies in improving accessibility.
Market Insights:
- The Global Tour Operator Software Market was valued at USD 980.00 million in 2018, reached USD 1,339.30 million in 2024, and is projected to attain USD 2,716.41 million by 2032, growing at a CAGR of 9.33%.
- North America holds 28.2% share in 2024, driven by advanced digital adoption, Europe follows with 18.8% due to strong inbound and outbound travel, and Asia Pacific captures 20% supported by internet penetration and rising middle-class tourism demand.
- Asia Pacific is the fastest-growing region, holding 20% in 2024, fueled by expanding outbound tourism, digital infrastructure, and government-backed travel promotion.
- The software segment accounted for roughly 65% of the Global Tour Operator Software Market in 2024, reflecting demand for booking systems, analytics, and mobile-first platforms.
- Services represented nearly 35% of the Global Tour Operator Software Market in 2024, with growth driven by customization, consulting, and integration support.
Market Drivers:
Rising Demand for Digitalization and Automation in Tour Operations:
The Global Tour Operator Software Market benefits from the increasing preference for digital tools that automate daily tasks and reduce operational complexity. Businesses in the travel sector seek solutions that optimize booking systems, manage customer data efficiently, and track itineraries with minimal manual input. It enables agencies to deliver faster responses, increase accuracy, and maintain consistent service quality. Travel companies adopt automation to lower administrative costs and improve workforce productivity. The growing expectation for seamless online reservations from customers further accelerates adoption. Operators value software that supports integration with external platforms such as hotels and airlines. Real-time analytics helps them identify market trends and adjust strategies quickly. This demand for efficiency continues to strengthen adoption rates across large and mid-sized operators.
- For instance, Amadeus supports real-time travel reservations and ticket processing through its GDS and airline IT systems, and in 2023 it further enhanced automation by deploying robotic process automation and automatic ticket-change features to improve booking efficiency.
Expanding Role of Personalization and Customer Engagement Tools:
Customer expectations for tailored travel experiences drive investment in advanced software platforms. The Global Tour Operator Software Market reflects this demand through features that track customer preferences and deliver targeted offers. It allows operators to analyze past behavior, suggest relevant packages, and improve loyalty. Companies rely on personalized communication methods, including mobile notifications and AI chat support, to engage travelers. Customization options increase satisfaction and strengthen repeat business. The industry shifts toward delivering unique cultural, adventure, or luxury experiences, supported by software tools. Firms use data-driven insights to design itineraries that align with client lifestyles. A strong emphasis on personalization creates a competitive advantage for operators using modern platforms.
Strong Growth of Mobile and Cloud-Based Technology Adoption:
Mobile and cloud platforms support flexible access, scalable systems, and reduced infrastructure costs. The Global Tour Operator Software Market gains momentum from rising mobile penetration and cloud-hosted solutions that simplify remote management. It provides operators with flexibility to manage bookings, payments, and communication from any location. Customers demand instant access to reservations through mobile apps, further increasing reliance on such platforms. Secure payment gateways and integrated customer support within mobile systems enhance convenience. Cloud-based models allow easy updates, continuous service availability, and improved collaboration across teams. Travel firms reduce upfront capital expenditure by shifting toward subscription models. Enhanced mobile and cloud adoption keeps operators competitive in the evolving tourism sector.
Integration of Analytics and Real-Time Decision-Making Tools:
Data-driven strategies improve forecasting, resource allocation, and customer engagement. The Global Tour Operator Software Market leverages analytics to generate insights on pricing, seasonal demand, and customer behavior. It supports decision-making that aligns packages with peak travel periods or targeted demographics. Operators gain advantages from predictive analytics that reduce risks associated with cancellations or demand fluctuations. Real-time dashboards provide transparent visibility into revenue streams and booking patterns. Integration with CRM systems ensures smooth coordination across sales and service functions. Companies use analytical tools to maintain profitability and adapt to dynamic travel market changes. Investment in intelligent software reinforces long-term growth and operational resilience.
- For instance, Expedia Group enhanced forecasting accuracy by 15–20% through AI-powered predictive analytics, enabling operators to adjust pricing in real time and drive higher sales of personalized travel packages.
Market Trends:
Expansion of Artificial Intelligence and Machine Learning Applications:
Artificial intelligence reshapes how travel agencies deliver services by enabling predictive and adaptive solutions. The Global Tour Operator Software Market adopts AI to recommend travel options, predict demand, and improve chat-based customer support. It enables automation of complex processes, including itinerary planning and instant customer response. Machine learning models detect patterns in consumer behavior, allowing operators to optimize offers. AI-driven tools support fraud detection and secure payment systems. Predictive models provide operators with strategies to enhance revenue. It also reduces dependence on manual forecasting by streamlining decision-making. AI continues to influence new product developments and service upgrades.
- For example, as reported on the Expedia Group Tech blog in July 2023, the company's AI-powered virtual agent has handled over 30 million customer conversations since its 2020 launch. This initiative has saved over 8 million hours of agent time and generated an estimated USD 150 million in operational cost savings.
Integration of Blockchain for Transparency and Security:
Blockchain adoption brings improved transparency, secure transactions, and reliable contract validation. The Global Tour Operator Software Market explores blockchain solutions to address growing concerns about fraud and data security. It allows tour operators to manage payments, reservations, and contracts with greater accuracy. Distributed ledgers enhance trust between service providers and travelers. Blockchain supports tamper-proof verification of tickets, vouchers, and loyalty programs. Firms reduce disputes by using immutable records of bookings and payments. The technology also enables cross-border transactions with fewer intermediaries. Increased focus on trust and transparency supports wider blockchain experimentation across tourism networks.
Growth of Omnichannel Engagement and Cross-Platform Solutions:
Omnichannel strategies deliver consistent experiences across web, mobile, and in-person platforms. The Global Tour Operator Software Market evolves toward integrated systems that unify customer interactions. It supports communication through chat, email, social media, and direct booking systems. Operators aim to provide seamless connectivity regardless of customer device or location. Platforms that synchronize messages and reservations improve engagement rates. Businesses benefit from consistent branding and customer retention through unified experiences. Omnichannel systems also streamline service delivery by consolidating data across channels. This focus on cross-platform integration reflects a strong market trend toward customer-centric services.
Increasing Focus on Virtual Reality and Augmented Reality Adoption:
Virtual and augmented reality enhance pre-travel decision-making by offering immersive previews. The Global Tour Operator Software Market incorporates these technologies to create interactive tour demonstrations. It enables travelers to visualize destinations and experiences before booking. Operators use VR headsets or AR apps to attract customers through engaging content. The tools help reduce uncertainties about destinations and improve customer confidence. Agencies leverage immersive features to differentiate from competitors. It strengthens marketing campaigns by making travel promotion more interactive. VR and AR adoption continues to expand as travelers seek more informed booking decisions.
- For instance, Thomas Cook’s “Try Before You Fly” VR campaign allowed customers in stores to preview destinations like New York using immersive headsets. This initiative delivered a 190% boost in New York excursion bookings after customers experienced the VR content
Market Challenges Analysis:
High Implementation Costs and Limited Adoption by Small Operators:
The Global Tour Operator Software Market faces cost-related barriers that restrict access for smaller businesses. It requires significant investment in licensing, training, and system integration. Many small agencies struggle to justify these expenses against tight margins. Lack of technical expertise further delays adoption among emerging operators. Resistance to digital transformation in some regions continues to create gaps in adoption. Companies that fail to modernize risk losing competitiveness. Concerns about maintenance costs also discourage wider implementation. Price sensitivity among smaller firms remains a pressing challenge for industry expansion.
Data Security Concerns and Complexity of Integration Across Platforms:
Security threats create serious risks for both operators and customers in the tourism sector. The Global Tour Operator Software Market must address issues around secure transactions, data protection, and compliance. It faces growing risks of cyberattacks targeting customer databases and financial information. Integration with third-party platforms often exposes systems to vulnerabilities. Businesses must allocate resources to strengthen cybersecurity infrastructure. Concerns about compliance with global privacy regulations add to complexity. Operators struggle with technical barriers while linking software to multiple travel ecosystems. Failure to address these issues impacts trust and slows adoption of digital platforms.
Market Opportunities:
Rising Popularity of Experiential and Niche Travel Segments:
Experiential tourism creates demand for customized, immersive packages across global markets. The Global Tour Operator Software Market captures this opportunity by enabling operators to design flexible itineraries. It supports cultural, adventure, and eco-tourism packages aligned with traveler interests. Customers prefer curated journeys that deliver value beyond standard packages. Agencies leverage software to combine services like transport, activities, and lodging into one platform. Integration with real-time booking systems increases efficiency in niche tourism segments. Operators gain new revenue streams by targeting travelers seeking unique experiences. The trend expands software adoption across diverse tourism ecosystems.
Growing Government Support and Investments in Tourism Infrastructure:
Government initiatives to strengthen tourism infrastructure create favorable conditions for technology adoption. The Global Tour Operator Software Market benefits from public investments in airports, hotels, and digital platforms. It aligns with programs that promote sustainable tourism and smart travel solutions. Agencies use advanced software to capitalize on new travel routes and expanded destinations. National campaigns supporting digital transformation encourage operators to modernize their systems. International collaborations also open opportunities for global integration of travel services. Operators equipped with software tools remain better positioned to capture growth from infrastructure expansion. This alignment of public and private investment enhances market potential.
Market Segmentation Analysis:
The Global Tour Operator Software Market is segmented
By type
Into homegrown, third party developer, and fee-based models. Homegrown solutions attract small operators seeking customization and cost control, while third party developer platforms dominate due to scalability, integration, and reliability. Fee-based models gain traction among operators valuing premium support and advanced analytics. This segmentation highlights diverse adoption patterns shaped by business size and digital maturity.
- For example, FareHarbor fits into the Third Party Developer and Fee Based segments, powering over 20,000 businesses worldwide. It integrates with more than 200 OTAs, helping operators manage bookings efficiently and expand their market reach.
By component
The market divides into software and services. Software platforms form the backbone of tour management systems, offering booking, scheduling, and payment integration. Services provide customization, consulting, and maintenance support, ensuring optimal performance. Demand for cloud-based deployment strengthens the software segment, while professional services deliver flexibility for operators adapting to digital transformation.
- For instance, Adamo Software delivers tailored implementation projects featuring multi-stage consulting and maintenance, which clients report significantly reduced post-deployment issues through structured support and proactive project guidance.
By operator type
The market includes inbound tour operators, outbound tour operators, destination management companies (DMCs), and ground operators. Outbound operators drive adoption with cross-border packages requiring multilingual and multi-currency features. DMCs use software for coordination across accommodation, transport, and local experiences. Ground operators rely on real-time updates to manage logistics and customer communication.
By tour style
Segments cover escorted, guided/hosted, independent vacations, river cruises, rail tours, and others such as cultural or private tours. Escorted and guided tours favor robust group management tools, while independent vacations benefit from flexible booking features.
By end user
Domestic, international, business, adventure, wildlife, and other specialized tours shape demand. International tours lead growth with rising global travel, while niche categories like adventure and wildlife tours expand software usage among specialized operators.
Segmentation:
By Type
- Homegrown
- Third Party Developer
- Fee Based
By Component
- Software
- Services
By Operator Type
- Inbound Tour Operators
- Outbound Tour Operators
- Destination Management Company (DMC)
- Ground Operators
By Tour Style
- Escorted Tour
- Guided/Hosted Tour
- Independent Vacation
- River Cruise
- Rail Tour
- Others (Private, Cultural, etc.)
By End User
- Domestic Tours
- International Tours
- Business Tours
- Adventure Tours
- Wildlife Tours
- Others
By Region
- North America (U.S., Canada, Mexico)
- Europe (UK, France, Germany, Italy, Spain, Russia, Rest of Europe)
- Asia Pacific (China, Japan, South Korea, India, Australia, Southeast Asia, Rest of Asia Pacific)
- Latin America (Brazil, Argentina, Rest of Latin America)
- Middle East (GCC Countries, Israel, Turkey, Rest of Middle East)
- Africa (South Africa, Egypt, Rest of Africa)
Regional Analysis:
North America
The North America Global Tour Operator Software Market size was valued at USD 280.77 million in 2018 to USD 377.81 million in 2024 and is anticipated to reach USD 763.01 million by 2032, at a CAGR of 9.2% during the forecast period. North America accounts for 28.2% of the global market in 2024, supported by advanced digital adoption and a mature tourism infrastructure. The Global Tour Operator Software Market in this region benefits from high consumer expectations for personalization and seamless booking. It is driven by U.S. and Canadian operators who adopt cloud-hosted systems with strong security and mobile-first features. Strategic collaborations with software providers boost competitiveness. Established vendors maintain dominance through regular feature upgrades. Rising outbound tourism continues to fuel growth. Regional operators prioritize innovation and reliable digital platforms.
Europe
The Europe Global Tour Operator Software Market size was valued at USD 193.84 million in 2018 to USD 251.22 million in 2024 and is anticipated to reach USD 471.44 million by 2032, at a CAGR of 8.2% during the forecast period. Europe represents 18.8% of the global share in 2024, supported by strong inbound and outbound travel activity. The Global Tour Operator Software Market here benefits from complex multi-country tours and demand for luxury and cultural packages. Operators in Germany, the UK, France, and Italy lead adoption, using platforms for itinerary planning and group management. Advanced digital systems support segments such as river cruises, rail tours, and independent vacations. Regulators enforce transparency and consumer protection, which strengthens reliance on secure booking tools. Mobile applications and AI-driven platforms improve customer engagement. Vendors emphasize integration with airlines and hospitality providers. Tourism growth across EU and non-EU regions sustains demand.
Asia Pacific
Asia Pacific contributes 20% of the global Tour Operator Software Market in 2024. Rapid digitization and a rising middle class drive demand across domestic and outbound tourism. The Global Tour Operator Software Market in this region thrives on strong internet penetration and mobile-first adoption. China, India, and Southeast Asia emerge as high-growth markets, requiring multi-language and multi-currency support. Cloud deployment models appeal to operators seeking scalability and affordability. Governments invest in tourism promotion and digital infrastructure, encouraging modernization. Regional competition fuels innovation in mobile applications and AI tools. Expanding adventure and cultural travel further boosts adoption. Asia Pacific positions itself as the fastest-growing market for tour operator platforms.
Latin America
Latin America holds 10% of the global market in 2024, supported by growing demand in Brazil, Mexico, and Argentina. The Global Tour Operator Software Market benefits from expanding online travel networks and rising preference for adventure and cultural tours. Local operators favor cost-efficient, flexible platforms suited for diverse packages. Cloud adoption grows as mid-sized firms seek lower upfront costs. Partnerships with airlines and hotel groups strengthen integration capabilities. Tourism infrastructure improvements across key economies increase digital adoption. Governments promote cultural and eco-tourism, enhancing demand for tailored software systems. Mobile-friendly solutions gain momentum among younger travelers. Latin America establishes itself as a promising emerging market.
Middle East
The Middle East contributes 3% of the global share in 2024, fueled by luxury tourism, pilgrimage travel, and cultural attractions. The Global Tour Operator Software Market in this region benefits from strong inbound visitor flows and government diversification programs. Dubai, Saudi Arabia, and Turkey dominate adoption through advanced multi-language and multi-currency systems. Operators invest in cloud solutions to align with smart city initiatives. Advanced analytics support targeted marketing and customer engagement strategies. Rising demand for seamless booking and payment systems accelerates modernization. Local firms integrate platforms with hospitality networks for comprehensive packages. The region’s investments in tourism expansion sustain strong software adoption.
Africa
Africa represents 3% of the global Tour Operator Software Market in 2024, supported by safari, wildlife, and adventure tourism. The Global Tour Operator Software Market in this region gains traction with rising smartphone penetration and digital infrastructure growth. South Africa, Kenya, and Egypt remain key markets, where operators adopt affordable, mobile-first solutions. International partnerships support modernization and skill transfer. Governments promote tourism through cultural and wildlife initiatives, creating opportunities for digital adoption. Operators prioritize user-friendly systems to serve diverse customer bases. Adoption is still early-stage but shows steady acceleration. Infrastructure development and rising inbound visitors provide long-term momentum.
Key Player Analysis:
- Ker & Downey
- Greaves Tours
- Jacada Travel
- DuVine Cycling + Adventure Co.
- Classic Journeys
- Quasar Expeditions
- Black Tomato
- Nesaza
- Lemax
- Intuitive Systems
- Inspiretec
- Open Destinations
Competitive Analysis:
The Global Tour Operator Software Market features a mix of established providers and emerging players competing for share through innovation and customer-centric solutions. Leading companies such as Lemax, Intuitive Systems, Inspiretec, and Open Destinations focus on developing scalable platforms with advanced booking, payment, and customer engagement features. It emphasizes integration with mobile applications, cloud-based deployment, and real-time analytics to meet rising customer expectations. Smaller firms and niche providers target regional markets by offering cost-efficient and customizable solutions. Competitive intensity is shaped by mergers, product launches, and partnerships that expand global reach. Vendors prioritize differentiation through AI-driven personalization, secure payment systems, and multilingual capabilities. Continuous investment in research and development supports feature upgrades and improved user experience. The landscape remains dynamic, with players striving to align platforms with the diverse requirements of inbound, outbound, and specialty tour operators.
Recent Developments:
- In June 2025, Ker & Downey Africa revealed a bold brand evolution through the unveiling of a refined new logo. This marks the beginning of a rebranding journey designed to reflect the company’s commitment to transformative travel experiences in Africa. In conjunction with this, the company announced plans to launch a newly designed website later in the year, reinforcing its ongoing dedication to crafting immersive and purposeful journeys for luxury travelers.
- In June 2025, TourRadar launched TourRadar Moments, a new feature within its app that enables travelers to discover, share, and book multi-day tours using user‑generated short-form videos and photos. This innovation marks a shift toward social and visual discovery in organized adventure travel
- In March 2023, Travelsoft completed the acquisition of Travel Compositor, a Spain-based travel booking solutions provider. The move expanded Travelsoft’s portfolio, strengthening its booking software services and enhancing its global SaaS offerings.
Report Coverage:
The research report offers an in-depth analysis based on Type, Component, Operator Type, Tour Style and End User. It details leading market players, providing an overview of their business, product offerings, investments, revenue streams, and key applications. Additionally, the report includes insights into the competitive environment, SWOT analysis, current market trends, as well as the primary drivers and constraints. Furthermore, it discusses various factors that have driven market expansion in recent years. The report also explores market dynamics, regulatory scenarios, and technological advancements that are shaping the industry. It assesses the impact of external factors and global economic changes on market growth. Lastly, it provides strategic recommendations for new entrants and established companies to navigate the complexities of the market.
Future Outlook:
- The Global Tour Operator Software Market will expand with rising adoption of cloud-based deployment across travel businesses.
- AI-powered personalization will reshape customer engagement, offering tailored recommendations and enhanced loyalty programs.
- Mobile-first platforms will dominate as travelers demand instant booking, real-time updates, and seamless payment integration.
- Integration with virtual and augmented reality will increase, providing immersive previews of destinations before purchase.
- Blockchain adoption will gain traction for secure payments, transparent contracts, and fraud prevention in global transactions.
- Partnerships between software providers and airlines, hotels, and OTAs will strengthen ecosystem connectivity.
- Demand for scalable solutions among mid-sized and small operators will rise, supporting wider software penetration.
- Analytics-driven decision-making will become central, enabling operators to optimize pricing, demand forecasting, and resource allocation.
- Government-backed tourism promotion and digital transformation initiatives will accelerate adoption in emerging markets.
- The market will remain highly competitive, with vendors focusing on innovation, service quality, and regional expansion.
Request a Free Sample
Fill in your details and we'll send you a free sample report.
- Sample data tables & charts
- Research methodology
Market Dynamics
Digitalization and Automation of Tour Operations
Tour operators are increasingly adopting digital platforms and automation tools to streamline booking, itinerary management, and customer data handling, reducing manual workload and operational costs while improving service speed and accuracy.
Personalization and Customer Engagement
Growing traveler expectations for tailored experiences are driving investment in software that enables operators to track preferences, deliver targeted offers, and engage customers through AI-powered communication and loyalty programs.
Mobile and Cloud-Based Technology Adoption
The proliferation of mobile devices and cloud infrastructure allows operators and travelers to access booking systems, payments, and support from anywhere, increasing flexibility, scalability, and reducing upfront IT costs.
Integration of Analytics and Real-Time Decision Tools
Advanced analytics and real-time dashboards empower operators to optimize pricing, forecast demand, and allocate resources efficiently, enabling data-driven strategies that enhance profitability and responsiveness to market trends.
Expansion of AI, Blockchain, and Immersive Technologies
The adoption of AI for predictive analytics and customer support, blockchain for secure transactions, and VR/AR for immersive destination previews is transforming the competitive landscape and elevating the value proposition of tour operator software.
Need a Custom Version of This Report?
Tailor the scope, geography, or segments to your exact requirements.
- Custom geography or segment scope
- Direct access to our analyst team
Frequently Asked Questions
What is the current market size for Global Tour Operator Software Market, and what is its projected size in 2032?
At what Compound Annual Growth Rate is the Global Tour Operator Software Market projected to grow between 2024 and 2032?
Which Global Tour Operator Software Market segment held the largest share in 2024?
What are the primary factors fueling the growth of the Global Tour Operator Software Market?
Who are the leading companies in the Global Tour Operator Software Market?
Which region commanded the largest share of the Global Tour Operator Software Market in 2024?
Table of Content
Chapter 1 Market Segmentation
- 1.1 Segmentation Framework
- 1.1.1 Product and Service Classification
- 1.1.2 Application and End-Use Classification
- 1.1.3 Technology and Solution Classification
- 1.1.4 Customer and Distribution Channel Classification
- 1.1.5 Geographic Segmentation
- 1.1.6 Market Segment Definitions and Boundaries
- 1.2 By Type
- 1.2.1 Homegrown
- 1.2.2 Third Party Developer
- 1.2.3 Fee Based
- 1.3 By Component
- 1.3.1 Software
- 1.3.2 Services
- 1.4 By Tour Style
- 1.4.1 Escorted Tour
- 1.4.2 Guided/Hosted Tour
- 1.4.3 Independent Vacation
- 1.4.4 River Cruise
- 1.4.5 Rail Tour
- 1.4.6 Others (Private, Cultural, etc.)
- 1.5 By Operator Type
- 1.5.1 Inbound Tour Operators
- 1.5.2 Outbound Tour Operators
- 1.5.3 Destination Management Company (DMC)
- 1.5.4 Ground Operators
Chapter 2 Introduction
- 2.1 Report Objectives and Scope
- 2.2 Product Definition and Industry Terminology
- 2.3 Market Inclusions and Exclusions
- 2.4 Research Process
- 2.4.1 Primary Research and Expert Interviews
- 2.4.2 Secondary Research and Source Review
- 2.4.3 Top-Down and Bottom-Up Estimation
- 2.4.4 Data Triangulation and Verification
- 2.5 Market Size Measurement Basis
- 2.5.1 2024: USD 1,339.30 million → 2032: USD 2,716.41 million
- 2.6 Historical and Forecast Reference Periods
- 2.6.1 Base Year: 2024
- 2.6.2 Forecast Period: 2024-2032
- 2.7 Research Assumptions and Limitations
Chapter 3 Executive Summary
- 3.1 Market Snapshot and Key Findings
- 3.2 Base-Year Market Size, 2024
- 3.3 Forecast Market Size, 2032
- 3.4 Revenue and Volume Growth Outlook
- 3.5 Key Demand and Supply Indicators
- 3.6 Leading Market Segments
- 3.7 Fastest-Growing Market Opportunities
- 3.8 Regional Performance Highlights
- 3.9 Technology and Industry Transformation
- 3.10 Competitive Landscape Summary
- 3.11 Analyst View and Strategic Implications
Chapter 4 Global Tour Operator Software Market Trends and Developments
- 4.1 Historical Industry Development
- 4.2 Recent Market Trends and Developments
- 4.3 Demand and Customer Behavior Trends
- 4.4 Technology and Product Innovation
- 4.5 Artificial Intelligence, Automation and Digitalization
- 4.6 Local Manufacturing and Supply Chain Realignment
- 4.7 Industry Partnerships, Mergers and Acquisitions
- 4.8 Sustainability and Circular Economy Developments
- 4.9 Government and Private Sector Investment Trends
- 4.10 Emerging Business Models and Commercialization
- 4.11 Industry Developments and Announcements
Chapter 5 Global Tour Operator Software Market Supply and Demand Analysis
- 5.1 Demand Trend and Consumption Analysis
- 5.2 Demand Forecast, 2024-2032
- 5.3 Supply Chain Structure and Procurement Trends
- 5.4 Supply-Demand Gap and Bottlenecks
- 5.5 Import Dependence and Sourcing Structure
- 5.6 Regional Supply and Demand Concentration
Chapter 6 Global Tour Operator Software Market Pricing Analysis
- 6.1 Pricing Structure and Measurement
- 6.2 Historical Pricing Trends
- 6.3 Pricing Outlook, 2024-2032
- 6.4 Pricing by Product and Market Segment
- 6.5 Geographic Pricing Differences
- 6.6 Key Input, Energy, Labor and Logistics Costs
- 6.7 Contract Pricing and Purchasing Models
- 6.8 Pricing Sensitivity and Competitive Positioning
- 6.9 Price, Margin and Profitability Implications
Chapter 7 Global Tour Operator Software Market Dynamics
- 7.1 Market Growth Drivers
- 7.1.1 Demand-Side Drivers
- 7.1.2 Technology and Innovation Drivers
- 7.1.3 Infrastructure and Investment Drivers
- 7.1.4 Regulatory and Policy Drivers
- 7.2 Market Restraints
- 7.2.1 Cost and Affordability Constraints
- 7.2.2 Technology and Adoption Barriers
- 7.2.3 Supply Chain and Operational Constraints
- 7.3 Market Challenges
- 7.3.1 Competitive Pressure and Margin Erosion
- 7.3.2 Skills, Infrastructure and Implementation Gaps
- 7.4 Emerging Market Opportunities
- 7.5 Market Dynamics Impact and Time-Horizon Assessment
Chapter 8 Global Tour Operator Software Value Chain Analysis
- 8.1 Industry Value Chain Overview
- 8.2 Upstream Suppliers and Critical Inputs
- 8.3 Technology and Component Providers
- 8.4 Manufacturing or Service Delivery
- 8.5 Distribution, Channel Partners and Integrators
- 8.6 Downstream Applications and End Users
- 8.7 Value Addition and Profit Pools
- 8.8 Vertical Integration and Outsourcing
- 8.9 Supplier Concentration and Risk
- 8.10 Supply Chain Localization and Resilience
Chapter 9 Global Tour Operator Software Market Regulations and Policies
- 9.1 Relevant Laws, Standards and Compliance Frameworks
- 9.2 Product, Service, Safety and Quality Requirements
- 9.3 Government Policies, Incentives and Subsidies
- 9.4 Imports, Exports and Trade Barriers
- 9.5 Public Procurement and Local Content Requirements
- 9.6 Data Protection, AI and Cybersecurity Compliance
- 9.7 Upcoming Policy Changes and Market Implications
Chapter 10 Global Tour Operator Software Market Hotspots and Opportunities
- 10.1 Market Opportunity Mapping and Growth Hotspots
- 10.2 High-Growth Applications and Customer Groups
- 10.3 Underserved Markets and White-Space Opportunities
- 10.4 Emerging Technology and Product Opportunities
- 10.5 New Capacity and Investment Hotspots
- 10.6 Market Entry and Expansion Opportunities
- 10.7 Distribution and Partnership Opportunities
- 10.8 Near-Term and Long-Term Commercial Potential
- 10.9 Opportunity Attractiveness and Execution Risks
Chapter 11 Global Tour Operator Software Market Outlook, 2024-2032
- 11.1 Market Size and Analysis
- 11.1.1 Revenue (Market Measurement: 2024: USD 1,339.30 million → 2032: USD 2,716.41 million)
- 11.1.2 Historical Market Size
- 11.1.3 Base-Year Market Size, 2024
- 11.2 Market Forecast, 2024-2032
- 11.2.1 Revenue Forecast to 2032
- 11.2.2 CAGR and Year-on-Year Growth
- 11.2.3 Incremental Revenue Opportunity
- 11.3 Forecast Assumptions and Scenario Analysis
- 11.3.1 Base-Case Forecast
- 11.3.2 Optimistic and Conservative Scenarios
- 11.3.3 Technology, Pricing and Policy Sensitivities
- 11.4 Market Attractiveness and Growth Outlook
Chapter 12 Global Tour Operator Software Market Segmentation and Outlook
- 12.1 Segmentation Summary and Market Shares, 2024
- 12.2 Largest and Fastest-Growing Segments
- 12.3 By Type - Market Size and Forecast, 2024-2032
- 12.3.1 Segment Definition and Scope
- 12.3.2 Historical Market Size
- 12.3.3 Revenue Forecast, 2024-2032
- 12.3.4 Base-Year Market Share, 2024
- 12.3.5 Segment CAGR and Growth Drivers
- 12.3.6 Subsegment Market Size and Forecast
- 12.3.6.1 Homegrown
- 12.3.6.2 Third Party Developer
- 12.3.6.3 Fee Based
- 12.3.7 Subsegment Pricing and Adoption Trends
- 12.3.8 Leading Suppliers and Competition
- 12.3.9 Regional Demand and Opportunities
- 12.4 By Component - Market Size and Forecast, 2024-2032
- 12.4.1 Segment Definition and Scope
- 12.4.2 Historical Market Size
- 12.4.3 Revenue Forecast, 2024-2032
- 12.4.4 Base-Year Market Share, 2024
- 12.4.5 Segment CAGR and Growth Drivers
- 12.4.6 Subsegment Market Size and Forecast
- 12.4.6.1 Software
- 12.4.6.2 Services
- 12.4.7 Subsegment Pricing and Adoption Trends
- 12.4.8 Leading Suppliers and Competition
- 12.4.9 Regional Demand and Opportunities
- 12.5 By Tour Style - Market Size and Forecast, 2024-2032
- 12.5.1 Segment Definition and Scope
- 12.5.2 Historical Market Size
- 12.5.3 Revenue Forecast, 2024-2032
- 12.5.4 Base-Year Market Share, 2024
- 12.5.5 Segment CAGR and Growth Drivers
- 12.5.6 Subsegment Market Size and Forecast
- 12.5.6.1 Escorted Tour
- 12.5.6.2 Guided/Hosted Tour
- 12.5.6.3 Independent Vacation
- 12.5.6.4 River Cruise
- 12.5.6.5 Rail Tour
- 12.5.6.6 Others (Private, Cultural, etc.)
- 12.5.7 Subsegment Pricing and Adoption Trends
- 12.5.8 Leading Suppliers and Competition
- 12.5.9 Regional Demand and Opportunities
- 12.6 By Operator Type - Market Size and Forecast, 2024-2032
- 12.6.1 Segment Definition and Scope
- 12.6.2 Historical Market Size
- 12.6.3 Revenue Forecast, 2024-2032
- 12.6.4 Base-Year Market Share, 2024
- 12.6.5 Segment CAGR and Growth Drivers
- 12.6.6 Subsegment Market Size and Forecast
- 12.6.6.1 Inbound Tour Operators
- 12.6.6.2 Outbound Tour Operators
- 12.6.6.3 Destination Management Company (DMC)
- 12.6.6.4 Ground Operators
- 12.6.7 Subsegment Pricing and Adoption Trends
- 12.6.8 Leading Suppliers and Competition
- 12.6.9 Regional Demand and Opportunities
- 12.7 Segment Growth Comparison
- 12.8 Segment Attractiveness and Priority Matrix
Chapter 13 Global Tour Operator Software Geographic Market Outlook, 2024-2032
- 13.1 Regional Market Size and Share, 2024
- 13.2 Regional Market Forecast, 2024-2032
- 13.3 Regional Pricing, Production and Demand Differences
- 13.4 North America
- 13.4.1 United States
- 13.4.2 Canada
- 13.4.3 Mexico
- 13.5 Europe
- 13.5.1 Germany
- 13.5.2 France
- 13.5.3 Italy
- 13.5.4 United Kingdom
- 13.5.5 Spain
- 13.5.6 Poland
- 13.5.7 Russia
- 13.5.8 Netherlands
- 13.5.9 Belgium
- 13.5.10 Sweden
- 13.5.11 Denmark
- 13.5.12 Norway
- 13.5.13 Rest of Europe
- 13.6 Asia Pacific
- 13.6.1 China
- 13.6.2 India
- 13.6.3 Japan
- 13.6.4 South Korea
- 13.6.5 Thailand
- 13.6.6 Indonesia
- 13.6.7 Vietnam
- 13.6.8 Malaysia
- 13.6.9 Australia
- 13.6.10 Rest of Asia Pacific
- 13.7 Latin America
- 13.7.1 Brazil
- 13.7.2 Argentina
- 13.7.3 Colombia
- 13.7.4 Chile
- 13.7.5 Rest of Latin America
- 13.8 Middle East
- 13.8.1 Saudi Arabia
- 13.8.2 United Arab Emirates
- 13.8.3 Turkey
- 13.8.4 Israel
- 13.8.5 Iran
- 13.8.6 Rest of the Middle East
- 13.9 Africa
- 13.9.1 South Africa
- 13.9.2 Egypt
- 13.9.3 Nigeria
- 13.9.4 Morocco
- 13.9.5 Rest of Africa
- 13.10 Regional Investment, Policy and Supply Chain Differences
- 13.11 Regional Competitive Landscape
- 13.12 Geographic Growth Hotspots
Chapter 14 Global Tour Operator Software Technology, Innovation and Sustainability Outlook
- 14.1 Technology Landscape and Maturity
- 14.2 Product, Process and Service Innovation
- 14.3 AI, Automation and Digital Tools in the Industry
- 14.4 Technology Adoption and Performance Benchmarking
- 14.5 Innovation Pipeline and R&D Investment
- 14.6 Patent and Intellectual Property Trends
- 14.7 Energy Efficiency and Resource Management
- 14.8 Sustainability, Recycling and Circularity
- 14.9 Technology Roadmap, 2024-2032
- 14.10 Risks of Obsolescence and Technology Substitution
Chapter 15 Global Tour Operator Software Market Key Strategic Imperatives
- 15.1 Growth and Market Entry Priorities
- 15.2 High-Return Products and Segments
- 15.3 Pricing, Profitability and Cost Optimization
- 15.4 Technology Investment and Product Differentiation
- 15.5 Supply Chain Localization and Resilience
- 15.6 Distribution and Customer Acquisition
- 15.7 Partnership, Acquisition and Capacity Strategy
- 15.8 Regional Expansion Priorities
- 15.9 Short-, Medium- and Long-Term Actions
Chapter 16 Competition Outlook
- 16.1 Industry Competition Characteristics
- 16.2 Market Structure and Concentration
- 16.3 Market Share and Competitive Positioning, 2024
- 16.4 Company-Wise Revenue and Product Benchmarking
- 16.5 Production and Service Capacity Benchmarking
- 16.6 Technology, Pricing and Differentiation
- 16.7 Regional Footprint and Distribution Strength
- 16.8 Mergers, Acquisitions and Strategic Alliances
- 16.9 New Entrants and Competitive Threats
- 16.10 Porter's Five Forces and Industry Attractiveness
- 16.11 Competitive Outlook, 2024-2032
Chapter 17 Company Profiles
- 17.1 Company Coverage and Selection Criteria
- 17.2 Lemax
- 17.2.1 Business Description
- 17.2.2 Company Ownership and Geographic Presence
- 17.2.3 Product and Service Portfolio
- 17.2.4 Manufacturing and Operating Footprint
- 17.2.5 Financial Performance and Investment
- 17.2.6 Market Share and Competitive Position
- 17.2.7 Technology and Innovation Capabilities
- 17.2.8 Strategic Alliances or Partnerships
- 17.2.9 Recent Developments
- 17.2.10 Growth Strategy and Outlook
- 17.3 Intuitive Systems
- 17.4 Inspiretec
- 17.5 Open Destinations
- 17.6 FareHarbor
- 17.7 Adamo Software
- 17.8 TourRadar
- 17.9 Travelsoft
- 17.10 Ker & Downey
- 17.11 Jacada Travel
- 17.12 Other Relevant Market Participants
Note: Every listed company is profiled on the structure shown under the first company. The company list is preliminary and may change based on research findings, market developments, data availability and client requirements.
Chapter 18 Disclaimer
- 18.1 Research and Forecast Disclaimer
- 18.2 Data Source and Estimation Limitations
Note: The depth of individual sections depends on data availability for this market. Volume, capacity, trade and other unit-based metrics are included where applicable.