Home » Information and Communications Technology » IT & Telecom » Robotic Process Automation (RPA) Market

Robotic Process Automation (RPA) Market By Solution (Software, Services), By Automation Type (Attended, Un-attended, Hybrid), By Deployment (On-cloud, On-premise), By Enterprise Size (Large, SMEs), By Industry Verticals (BFSI, Telecom, Retail, Healthcare, Manufacturing, Others) – Growth, Future Prospects, and Competitive Analysis, 2019 – 2027

Price: $4699

Published: | Report ID: 10102 | Report Format : PDF

Robotic process automation (RPA) adding value to the businesses worldwide

Robotic process automation (RPA) uses software bots to automate highly repetitive, routine tasks normally performed by knowledge workers. Automating repetitive tasks saves time and money. Robotic process automation bots expand the value of an automation platform by completing tasks faster, allowing employees to perform higher-value work. It helps carry out high-volume and repetitive tasks that take a lot of time for humans to accomplish and are typically monotonous to perform in the robotic process automation market.

Technological advancements have influenced businesses worldwide to overcome new challenges to cope with changing consumer demand and requirements. Also, it is helping these businesses to be competitive in the global market. RPA has the ability to deliver seamless operation coupled with significant value addition from the resources. These organizations worldwide are continually looking to identify processes that can be automated to accelerate productivity. In the recent past, large enterprises, as well as SMEs, are increasingly adopting robotic process automation, considering the benefits it is providing to their businesses.

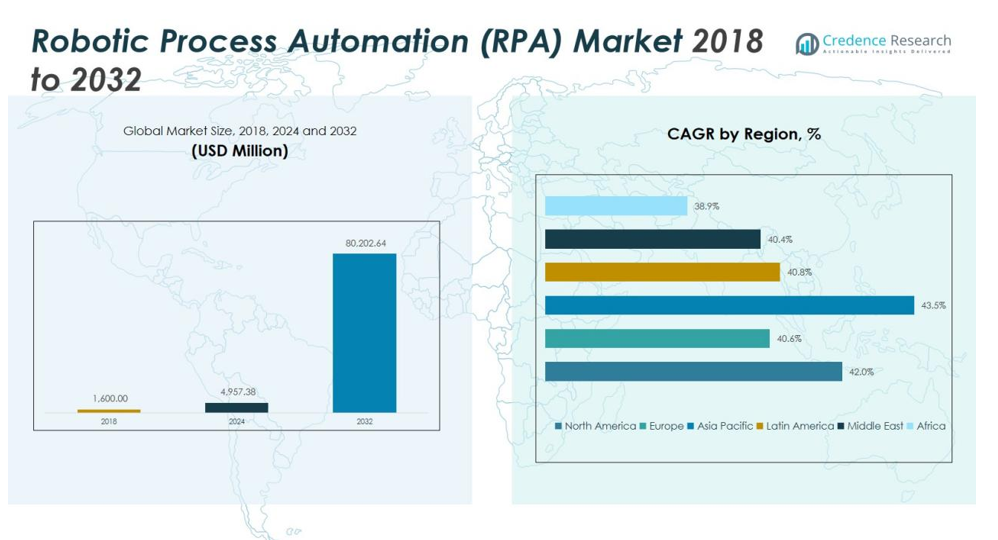
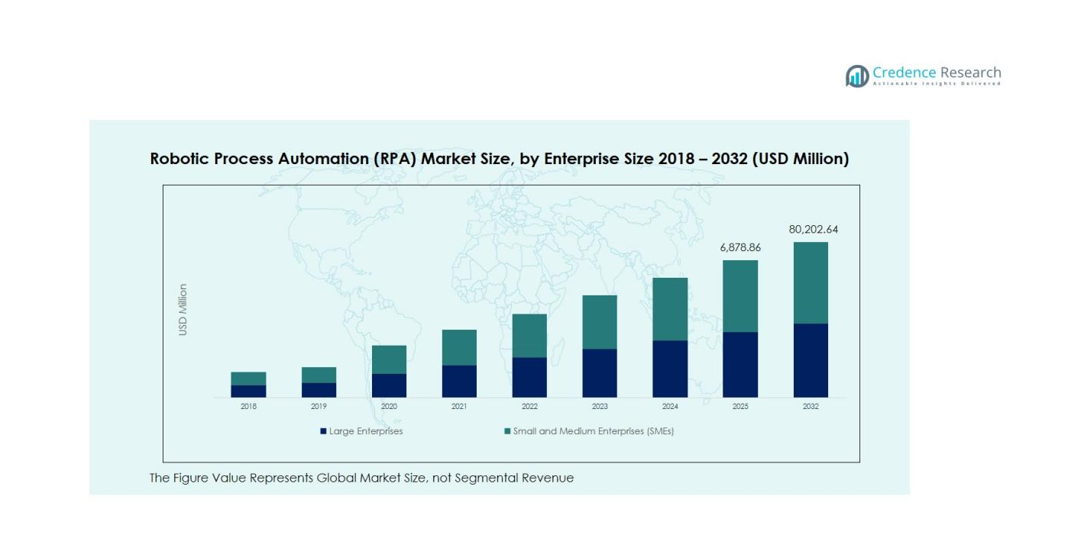
With the increasing competitiveness among the market players, there is a decreasing cost of automation software and services. In addition, a surge in demand for virtual workforce also supports the growth of the market across the globe. Overall, the global robotic process automation market was US$ 898.3 Mn in 2018 and is expected to reach US$ 10,781.0 Mn by 2027, growing at a CAGR of 31.8% from 2019 to 2027.

Design Element 2

Access crucial information at unmatched prices!

Request your free sample report today & start making informed decisions powered by Credence Research!

Download Free Sample

CTA Design Element 3

Market Snapshot

RPA Type Segment Analysis

Service segment dominating the market

The RPA type segment is segmented into software and service. The service segment accounted for the largest share of the RPA market size in 2018. The service segment accounted for around 60% of the overall revenue share of the market for robotic process automation in 2018. The growing competition among the service providers is continuously enhancing advisory, consulting, and training services. This, in turn, helps the software user and service takers to achieve reduced costs and increased scalability. During the forecast period, it is estimated that the service segment will keep its dominance.

Regional Analysis

North America dominating the global market by region

The North American region dominated the market for robotic process automation in 2018, and it is expected to continue its dominance over the forecast period. The increased penetration of automation and process management solutions across the well-established and technologically advanced industries present in the region has added advantages to the market. Furthermore, SMEs are increasingly adopting RPA technology within their business functions, such as accounting/finance, human resource-related processes, and procurement. In addition, strong support from the U.S. government has encouraged all other state government agencies to implement robotic process automation, which has fostered market growth.

The Asia Pacific region is expected to witness the fastest CAGR over the forecast period. Rising awareness about automation in the region is also expected to boost demand. Strong industrial growth and increasing investment from global players have added advantages to adopting RPA in the region. Furthermore, the increasing demand for business process automation solutions in the BPO sector in China and India contributes to regional growth. However, the lack of trained and skilled employees is the major concern in the region, and that is obstructing regional market growth. Furthermore, those SMEs having budget constraints have affordability issues that are challenging for the RPA vendors.

Growing partnerships is keeping the market competitive

The global robotic process automation market is competitive. Prominent players operating in the robotic process automation market are adopting strategies such as a partnership with other companies and the acquisition of smaller players to increase their client base and geographical reach. Following is the list of players included in the published reports.

List of Companies Covered:

  • UiPath
  • Automation Anywhere Inc.
  • Blue Prism Ltd.
  • NICE
  • Pegasystems Inc.
  • Kofax Inc.
  • NTT Advanced Technology Corporation
  • EdgeVerve Systems Ltd.
  • ActiveOps Ltd.
  • HelpSystems
  • Others

Key Industry Development:

  • In May 2019, UiPath and Mannai Trading Co. WLL, the largest Systems Integrator & leading provider of Business Process Management (BPM) automation in Qatar, announced a technological partnership to drive a new level of integration of RPA to organizations in Qatar. This partnership with UiPath will provide customers in Qatar with access to best-of-breed implementation and management services along with industry-leading RPA and Intelligent Automation technology.
  • In May 2019, UiPath, the leading enterprise Robotic Process Automation (RPA) software company, announced that it has partnered with PFS Tech, a boutique IT company offering digital consultancy, technology, and outsourcing services to provide solutions that increase operational efficiency and improve business performance using RPA to automate repetitive, time-consuming tasks. Through this partnership, PFS Tech will enlist its extensive experience in digital transformation and process automation and utilize UiPath’s AI-powered RPA platform to deliver fully integrated solutions to PFS Tech clients.

Historical & Forecast Period

The research report presents the analysis of each segment from 2017 to 2027, considering 2018 as the base year for the research. Compounded annual growth rate (CAGR) for each respective segment calculated for the forecast period from 2019 to 2027.

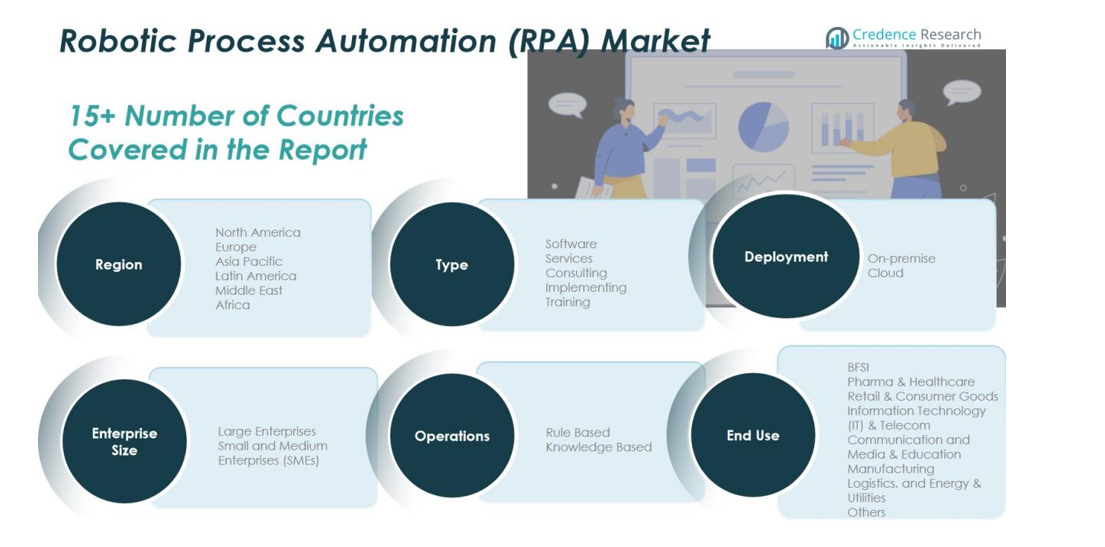
Market Segmentation

Segmentation Solution Segment (2017-2027; US$ Mn)

  • Software
  • Services
  • Consulting
  • Implementation
  • Training

 Automation Type Segment (2017-2027; US$ Mn)

  • Attended
  • Un-attended
  • Hybrid

 Deployment Type Segment (2017-2027; US$ Mn)

  • On-cloud
  • On-premise

 Enterprise Size Segment (2017-2027; US$ Mn)

  • Large
  • SMEs

 Industry Verticals Segment (2017-2027; US$ Mn)

  • BFSI
  • Telecom
  • Retail
  • Healthcare
  • Manufacturing
  • Others

 Geography Segment (2017–2027; US$ Mn)

  • North America (U.S. and Rest of North America)
  • Europe (U.K., Germany, France, and Rest of Europe)
  • Asia Pacific (Japan, China, India, and Rest of Asia Pacific)
  • Rest of World (Middle East & Africa (MEA), Latin America)

The current report also comprehends qualitative market valuation factors such as key market drivers, market trends, restraints, and opportunities that give a better market understanding of the global robotic process automation market. The global report also comprises a graphical representation of a competitive landscape based on market initiatives and strategies, product portfolio, and business strengths.

Unique data points of this report

  • Recent trends across different regions in terms of development of the robotic process automation market
  • Attractive investment proposition for application segment as well as geography

What is the market for RPA?

RPA is a term for robotic process automation. RPA can be used to automate tasks in business processes, such as customer service, accounting, manufacturing, and shipping. Some common uses of RPA include reducing the need for human input, improving efficiency and accuracy, and reducing costs. As a result, the market for RPA is increasing and is expected to reach US$ 10,781.0 Mn by 2027.

What are some benefits of using RPA?

RPA can be used to automate tasks in business processes, such as customer service, accounting, manufacturing, and shipping. Some expected benefits of using RPA include reducing the need for human input, improving efficiency and accuracy, and reducing costs.

How is RPA being used currently?

Currently, RPA is being used to automate tasks in several different business processes. For example, RPA is being used to reduce the need for human input in customer service scenarios. Additionally, RPA is being used to improve efficiency and accuracy in accounting and manufacturing scenarios. Finally, in shipping scenarios, RPA is used to reduce the time needed to complete specific tasks.

Who is the market leader in RPA?

There are a few market leaders in the robotic process automation (RPA) industry. Some of the most significant players include Workday, IBM, and Microsoft. These companies have been able to gain a considerable share of the market due to their expansive product portfolios and aggressive marketing efforts. However, several smaller players are also doing well.

Is RPA still in demand?

Yes, RPA is still in demand. Some major players in the RPA market include Alphabet Inc’s Google, Microsoft Corp, Fujitsu Ltd, and Intel Corp.. These companies focus on developing artificial intelligence (AI) capabilities for their respective RPA platforms.

How big is the Process Automation market?

As per Credence Research, the global robotic process automation market was US$ 898.3 Mn in 2018 and is expected to reach US$ 10,781.0 Mn by 2027, growing at a CAGR of 31.8% from 2019 to 2027.

Does RPA have a future?

Yes

IBM launches Watson for Business artificial intelligence platform

Oracle unveils new RPA technology for automating business processes

Microsoft launches Azure Bot Service to automate tasks across businesses

Wipro launches Wingify – an AI platform for automating repetitive work

What is the future scope of RPA?

The robotic process automation (RPA) market is expected to grow at a CAGR of around 31.8% during the forecast period. The RPA market has benefited from the increasing demand for automation in various industries, such as banking, retail, and manufacturing.

How fast is RPA growing?

The robotic process automation (RPA) market is proliferating, with a CAGR of over 31.8%. This growth is due to the increasing use of RPA in banking, manufacturing, and healthcare industries. In terms of revenue, the banking and financial services sector is expected to account for the largest share of the market. The following are some of the reasons why the RPA market is proliferating:

Increasing demand from businesses for automation that can save time and money

Growing trend toward digitalization across various industries

Advancements in artificial intelligence and machine learning capabilities are Driving the Adoption of RPA

Which RPA tool is best in the market?

As the world moves towards a more automated economy, businesses are turning to robotic process automation (RPA) tools to streamline their workflows. To help companies to choose the best RPA tool for their needs, we analyzed the market and evaluated two of the most popular tools.

1. DragonFlow 

DragonFlow is a cloud-based RPA tool that allows users to connect to different applications and data sources from anywhere in the world. This makes it ideal for larger businesses with multiple offices across the globe. DragonFlow also has a wide range of integrations, allowing it to work with various systems. In addition, DragonFlow offers a wide range of features, including task management, workflow automation, and job management.

2. PowToon 

PowToon is a desktop RPA tool that lets users create automated videos from scratch or import footage from other video sources. PowToon also has built-in transcription and voice recognition capabilities, making it perfect for automating text or audio input workflows. PowToon also offers advanced reporting and task management features, making it.

Which is better, Selenium or RPA?

The debate between Selenium and RPA is still a hot topic, with both sides claiming that their technology is the best for specific tasks. Here, we look at the two technologies and consider which is better for different purposes.

Selenium vs. RPA: Which is better for web scraping?

When it comes to web scraping, Selenium is the better option. Selenium has been around for many years, and its capabilities have been significantly enhanced. For example, selenium can capture screenshots and logs of the browser session, allowing you to quickly reproduce the issue or problem you are trying to address. Additionally, Selenium can automate user interaction with websites- something that is difficult to do with RPA.

RPA is more suited for tasks requiring you to automate repeated or complex tasks on a website. For example, you could use RPA to create a process that automatically updates customer information from a database. While Selenium can be used to automate user interaction with websites, it is not as powerful as RPA when it comes to automating repeated or complex tasks. So which technology is better? It depends on the task at hand.

What is RPA revenue?

The RPA market is estimated to grow from US$ 898.3 Mn in 2018 to US$ 10,781.0 Mn by 2027, at a Compound Annual Growth Rate (CAGR) of 31.8%.

How long will RPA last?

The adoption of RPA may face some challenges. For instance, some employees may find it difficult to shift their workstyle and learn new skills. Another challenge is that RPA requires a high level of automation, which can be expensive to implement.

Which part of the world has the largest RPA market size?

The North American market is expected to grow at the highest rate during the forecast period, followed by Asia Pacific, Europe, and Latin America.

Increased adoption of artificial intelligence (AI) and increasing demand for data analytics also contribute to the RPA market’s growth.

How much do RPA developers make?

The average salary for an RPA developer is $92,760 per year, according to Glassdoor.com. The lowest 10% of salary earners make an average of $57,120 per year, while the top 10% make an average of $127,000 per year.

RPA developers typically need a bachelor’s degree in computer science or engineering. Many RPA developers also hold certifications such as the Certified Scrum Master (CSM) or Certified Project Manager (CPM).

RPA Vendors

Some of the leading players in the Robotic Process Automation market are IBM (US), SAP SE (Germany), Hitachi (Japan), Korea Electronics Industries (KEI) Corporation (South Korea), National Instruments (US), Siemens AG (Germany), and Samsung Electronics Co., Ltd.

What is the demand and scope of RPA tools in the IT sector?

The demand for RPA tools is increasing in the IT sector because they help reduce the time it takes to automate tasks. RPA tools are also expanding to include more areas, such as business process management (BPM) and data governance.

RPA tools are primarily used in the IT sector to automate data entry and reporting tasks. They are also used to improve efficiencies by automating repetitive tasks.

How does robotic process automation lower human workload?

The benefits of robotic process automation are manifold. It can help to lower human workload, automate processes, and improve efficiency. Here are four key benefits:

1. Reduced Workload:

One of the main benefits of robotic process automation is that it can reduce human workload. This is because robots do the work that people would otherwise do. This can save time and energy, which can be used elsewhere in the business.

2. Automation:

Robotic process automation also automates processes, reducing the need for human involvement. This can speed up processes and make them more efficient. It also helps to ensure that all procedures are carried out correctly and without errors.

3. Improved Efficiency:

Another benefit of robotic process automation is that it can improve efficiency overall. This is because it eliminates the need for many manual tasks and allows for more focused efforts on those that are necessary. This can enable businesses to operate more quickly and at a lower cost overall.

4. Increased Productivity:

Lastly, robotic process automation can also increase productivity levels within an organization. This is because it allows employees to focus on more critical tasks.

Shape Your Report to Specific Countries or Regions & Enjoy 30% Off!

What is the difference between collection and work queues in Blue Prism?
The two queues in Blue Prism are collection and work queues. Collection queues manage incoming requests from users, while work queues are used to manage outgoing requests. Collection queues help you handle the incoming requests by automatically sorting and organizing them. In contrast, work queues allow you control the outgoing requests by managing the workflow of the tasks that need to be completed.

Do all the RPA tools provide both front and back office automation?

Robotic Process Automation (RPA) tools can help automate various back office processes, such as customer service and accounting. However, not all RPA tools provide front office automation, which can be helpful for tasks such as email processing and social media engagement. Therefore, it’s crucial to determine what type of automation is most important to your business before investing in an RPA tool.

1. Preface
1.1. Report Description
1.1.1. Purpose of the Report
1.1.2. Target Audience
1.1.3. USP and Key Offerings
1.2. Research Scope
1.3. Research Methodology
1.3.1. Phase I – Secondary Research
1.3.2. Phase II – Primary Research
1.3.3. Phase III – Expert Panel Review
1.3.4. Approach Adopted
1.3.4.1. Top-Down Approach
1.3.4.2. Bottom-Up Approach
1.3.5. Assumptions
1.4. Market Segmentation

2. Executive Summary
2.1. Market Snapshot: Global Robotic Process Automation (RPA) Market
2.2. Global RPA Market, by Solution, 2018 (US$ Mn)
2.3. Global RPA Market, by Automation Type, 2018 (US$ Mn)
2.4. Global RPA Market, by Process, 2018 (US$ Mn)
2.5. Global RPA Market, by Deployment, 2018 (US$ Mn)
2.6. Global RPA Market, by Enterprise Size, 2018 (US$ Mn)
2.7. Global RPA Market, by Industry Size, 2018 (US$ Mn)
2.8. Global RPA Market, by Geography, 2018 (US$ Mn)

3. Market Dynamics
3.1. Introduction
3.1.1. Global RPA Market Value, 2017 – 2027, (US$ Mn)
3.2. Market Dynamics
3.2.1. Market Drivers
3.2.2. Market Restraints
3.2.3. Market Opportunities
3.2.4. Market Trends
3.3. Attractive Investment Proposition, by Geography, 2018
3.4. Market Positioning of Key Players, 2018
3.4.1. Major Strategies Adopted by Key Players

4. Global Robotic Process Automation (RPA) Market, by Solution , 2017 – 2027 (US$ Mn)
4.1. Overview
4.2. Software
4.3. Services

5. Global Robotic Process Automation (RPA) Market, by Automation Type, 2017 – 2027 (US$ Mn)
5.1. Overview
5.2. Attended
5.3. Un-attended
5.4. Hybrid

6. Global Robotic Process Automation (RPA) Market, by Process, 2017 – 2027 (US$ Mn)
6.1. Overview
6.2. Automation
6.3. Decision Support
6.4. Management
6.5. Interaction

7. Global Robotic Process Automation (RPA) Market, by Deployment, 2017 – 2027 (US$ Mn)
7.1. Overview
7.2. On-cloud
7.3. On-premise

8. Global Robotic Process Automation (RPA) Market, by Enterprise Size, 2017 – 2027 (US$ Mn)
8.1. Overview
8.2. Large
8.3. SMEs

9. Global Robotic Process Automation (RPA) Market, by Enterprise Size, 2017 – 2027 (US$ Mn)
9.1. Overview
9.2. BFSI
9.3. Telecom
9.4. Retail
9.5. Healthcare
9.6. Manufacturing
9.7. Others

10. North America Robotic Process Automation (RPA) Analysis, 2017 – 2027 (US$ Mn)
10.1. Overview
10.1.1. North America RPA Market Value and Growth, 2017 – 2027, (US$ Mn)
10.2. North America RPA Market Value, By Solution, 2017 – 2027 (US$ Mn)
10.2.1. Market Analysis
10.3. North America RPA Market Value, By Automation Type, 2017 – 2027 (US$ Mn)
10.3.1. Market Analysis
10.4. North America RPA Market Value, By Process, 2017 – 2027 (US$ Mn)
10.4.1. Market Analysis
10.5. North America RPA Market Value, By Deployment Type, 2017 – 2027 (US$ Mn)
10.5.1. Market Analysis
10.6. North America RPA Market Value, By Enterprise Size, 2017 – 2027 (US$ Mn)
10.6.1. Market Analysis
10.7. North America RPA Market Value, By Industry Vertical, 2017 – 2027 (US$ Mn)
10.7.1. Market Analysis
10.8. North America RPA Market Value, By Region/Country, 2017 – 2027 (US$ Mn)
10.8.1. Market Analysis
10.8.2. U.S.
10.8.3. Rest of North America

11. Europe Robotic Process Automation (RPA) Analysis, 2017 – 2027 (US$ Mn)
11.1. Overview
11.1.1. Europe RPA Market Value and Growth, 2017 – 2027, (US$ Mn)
11.2. Europe RPA Market Value, By Solution, 2017 – 2027 (US$ Mn)
11.2.1. Market Analysis
11.3. Europe RPA Market Value, By Automation Type, 2017 – 2027 (US$ Mn)
11.3.1. Market Analysis
11.4. Europe RPA Market Value, By Process, 2017 – 2027 (US$ Mn)
11.4.1. Market Analysis
11.5. Europe RPA Market Value, By Deployment Type, 2017 – 2027 (US$ Mn)
11.5.1. Market Analysis
11.6. Europe RPA Market Value, By Enterprise Size, 2017 – 2027 (US$ Mn)
11.6.1. Market Analysis
11.7. Europe RPA Market Value, By Industry Vertical, 2017 – 2027 (US$ Mn)
11.7.1. Market Analysis
11.8. Europe RPA Market Value, By Region/Country, 2017 – 2027 (US$ Mn)
11.8.1. Market Analysis
11.8.2. U.K.
11.8.3. Germany
11.8.4. France
11.8.5. Rest of Europe

12. Asia Pacific Robotic Process Automation (RPA) Analysis, 2017 – 2027 (US$ Mn)
12.1. Overview
12.1.1. Asia Pacific RPA Market Value and Growth, 2017 – 2027, (US$ Mn)
12.2. Asia Pacific RPA Market Value, By Solution, 2017 – 2027 (US$ Mn)
12.2.1. Market Analysis
12.3. Asia Pacific RPA Market Value, By Automation Type, 2017 – 2027 (US$ Mn)
12.3.1. Market Analysis
12.4. Asia Pacific RPA Market Value, By Process, 2017 – 2027 (US$ Mn)
12.4.1. Market Analysis
12.5. Asia Pacific RPA Market Value, By Deployment Type, 2017 – 2027 (US$ Mn)
12.5.1. Market Analysis
12.6. Asia Pacific RPA Market Value, By Enterprise Size, 2017 – 2027 (US$ Mn)
12.6.1. Market Analysis
12.7. Asia Pacific RPA Market Value, By Industry Vertical, 2017 – 2027 (US$ Mn)
12.7.1. Market Analysis
12.8. Asia Pacific RPA Market Value, By Region/Country, 2017 – 2027 (US$ Mn)
12.8.1. Market Analysis
12.8.2. Japan
12.8.3. China
12.8.4. India
12.8.5. Rest of Asia Pacific

13. Rest of the World Robotic Process Automation (RPA) Market Analysis, 2017 – 2027 (US$ Mn)
13.1. Overview
13.1.1. Rest of the World RPA Market Value and Growth, 2017 – 2027, (US$ Mn)
13.2. Rest of the World RPA Market Value, By Solution, 2017 – 2027 (US$ Mn)
13.2.1. Market Analysis
13.3. Rest of the World RPA Market Value, By Automation Type, 2017 – 2027 (US$ Mn)
13.3.1. Market Analysis
13.4. Rest of the World RPA Market Value, By Process, 2017 – 2027 (US$ Mn)
13.4.1. Market Analysis
13.5. Rest of the World RPA Market Value, By Deployment Type, 2017 – 2027 (US$ Mn)
13.5.1. Market Analysis
13.6. Rest of the World RPA Market Value, By Enterprise Size, 2017 – 2027 (US$ Mn)
13.6.1. Market Analysis
13.7. Rest of the World RPA Market Value, By Industry Vertical, 2017 – 2027 (US$ Mn)
13.7.1. Market Analysis
13.8. Rest of the World RPA Market Value, By Region, 2017 – 2027 (US$ Mn)
13.8.1. Market Analysis
13.8.2. Middle East & Africa
13.8.3. Latin America

14. Company Profiles
14.1. AIQ UiPath
14.2. Automation Anywhere
14.3. Blue Prism
14.4. NICE
14.5. Pegasystems
14.6. Kofax
14.7. NTT-AT
14.8. EdgeVerve Systems
14.9. OpenConnect
14.10. HelpSystems

List Of Figures

FIG. 1 Global Robotic Process Automation (RPA) Market: Research Methodology
FIG. 2 Market Size Estimation – Top Down & Bottom up Approach
FIG. 3 Global RPA Market Segmentation
FIG. 4 Global RPA Market, by Solution, 2018, (US$ Mn)
FIG. 5 Global RPA Market, by Automation Type, 2018, (US$ Mn)
FIG. 6 Global RPA Market, by Process, 2018, (US$ Mn)
FIG. 7 Global RPA Market, by Deployment Type, 2018, (US$ Mn)
FIG. 8 Global RPA Market, by Enterprise Size, 2018, (US$ Mn)
FIG. 9 Global RPA Market, by Industry Vertical, 2018, (US$ Mn)
FIG. 10 Global RPA Market, by Geography, 2018 (US$ Mn)
FIG. 11 Global RPA Market Value, 2017 – 2027, (US$ Mn)
FIG. 12 Attractive Investment Proposition, by Geography, 2018
FIG. 13 Global Market Positioning of Key RPA Manufacturers & Providers, 2018
FIG. 14 Global RPA Market Value Share, by Solution, 2018 & 2027 (Value %)
FIG. 15 Global RPA Market Value for Software, 2017 – 2027, (US$ Mn)
FIG. 16 Global RPA Market Value for Services, 2017 – 2027, (US$ Mn)
FIG. 17 Global RPA Market Value Share, by Automation Type, 2018 & 2027 (Value %)
FIG. 18 Global RPA Market Value for Attended, 2017 – 2027, (US$ Mn)
FIG. 19 Global RPA Market Value for Un-attended, 2017 – 2027, (US$ Mn)
FIG. 20 Global RPA Market Value for Hybrid, 2017 – 2027, (US$ Mn)
FIG. 21 Global RPA Market Value Share, by Process, 2018 & 2027 (Value %)
FIG. 22 Global RPA Market Value for Automation, 2017 – 2027, (US$ Mn)
FIG. 23 Global RPA Market Value for Decision Support, 2017 – 2027, (US$ Mn)
FIG. 24 Global RPA Market Value for Management, 2017 – 2027, (US$ Mn)
FIG. 25 Global RPA Market Value for Interaction, 2017 – 2027, (US$ Mn)
FIG. 26 Global RPA Market Value Share, by Deployment Type, 2018 & 2027 (Value %)
FIG. 27 Global RPA Market Value for On-cloud, 2017 – 2027, (US$ Mn)
FIG. 28 Global RPA Market Value for On-premise, 2017 – 2027, (US$ Mn)
FIG. 29 Global RPA Market Value Share, by Enterprise Size, 2018 & 2027 (Value %)
FIG. 30 Global RPA Market Value for Large Enterprise, 2017 – 2027, (US$ Mn)
FIG. 31 Global RPA Market Value for SMEs, 2017 – 2027, (US$ Mn)
FIG. 32 Global RPA Market Value Share, by Industry Vertical, 2018 & 2027 (Value %)
FIG. 33 Global RPA Market Value for BFSI, 2017 – 2027, (US$ Mn)
FIG. 34 Global RPA Market Value for Telecom, 2017 – 2027, (US$ Mn)
FIG. 35 Global RPA Market Value for Retail, 2017 – 2027, (US$ Mn)
FIG. 36 Global RPA Market Value for Healthcare, 2017 – 2027, (US$ Mn)
FIG. 37 Global RPA Market Value for Manufacturing, 2017 – 2027, (US$ Mn)
FIG. 38 Global RPA Market Value for Others, 2017 – 2027, (US$ Mn)
FIG. 39 North America RPA Market Value, 2017 – 2027, (US$ Mn)
FIG. 40 Europe RPA Market Value, 2017 – 2027, (US$ Mn)
FIG. 41 Asia Pacific RPA Market Value, 2017 – 2027, (US$ Mn)
FIG. 42 Rest of the World RPA Market Value, 2017 – 2027, (US$ Mn)

List Of Tables

TABLE 1 Market Snapshot: Global Robotic Process Automation (RPA) Market Value
TABLE 2 Impact Indicators
TABLE 3 Impact Analysis of Drivers and Restraints
TABLE 4 Global RPA Market, by Solution, 2017-2027, (US$ Mn)
TABLE 5 Global RPA Market, by Automation Type, 2017-2027, (US$ Mn)
TABLE 6 Global RPA Market, by Process, 2017-2027, (US$ Mn)
TABLE 7 Global RPA Market, by Deployment Type, 2017-2027, (US$ Mn)
TABLE 8 Global RPA Market, by Enterprise Size, 2017-2027, (US$ Mn)
TABLE 9 Global RPA Market, by Industry Vertical, 2017-2027, (US$ Mn)
TABLE 10 Global RPA Market Value, by Region/Country, 2017 – 2027, (US$ Mn)
TABLE 11 North America RPA Market, by Solution, 2017-2027, (US$ Mn)
TABLE 12 North America RPA Market, by Automation Type, 2017-2027, (US$ Mn)
TABLE 13 North America RPA Market, by Process, 2017-2027, (US$ Mn)
TABLE 14 North America RPA Market, by Deployment Type, 2017-2027, (US$ Mn)
TABLE 15 North America RPA Market, by Enterprise Size, 2017-2027, (US$ Mn)
TABLE 16 North America RPA Market, by Industry Vertical, 2017-2027, (US$ Mn)
TABLE 17 North America RPA Market Value, by Region/Country, 2017 – 2027, (US$ Mn)
TABLE 18 Europe RPA Market, by Solution, 2017-2027, (US$ Mn)
TABLE 19 Europe RPA Market, by Automation Type, 2017-2027, (US$ Mn)
TABLE 20 Europe RPA Market, by Process, 2017-2027, (US$ Mn)
TABLE 21 Europe RPA Market, by Deployment Type, 2017-2027, (US$ Mn)
TABLE 22 Europe RPA Market, by Enterprise Size, 2017-2027, (US$ Mn)
TABLE 23 Europe RPA Market, by Industry Vertical, 2017-2027, (US$ Mn)
TABLE 24 Europe RPA Market Value, by Region/Country, 2017 – 2027, (US$ Mn)
TABLE 25 Asia Pacific RPA Market, by Solution, 2017-2027, (US$ Mn)
TABLE 26 Asia Pacific RPA Market, by Automation Type, 2017-2027, (US$ Mn)
TABLE 27 Asia Pacific RPA Market, by Process, 2017-2027, (US$ Mn)
TABLE 28 Asia Pacific RPA Market, by Deployment Type, 2017-2027, (US$ Mn)
TABLE 29 Asia Pacific RPA Market, by Enterprise Size, 2017-2027, (US$ Mn)
TABLE 30 Asia Pacific RPA Market, by Industry Vertical, 2017-2027, (US$ Mn)
TABLE 31 Asia Pacific RPA Market Value, by Region/Country, 2017 – 2027, (US$ Mn)
TABLE 32 Rest of the World RPA Market, by Solution, 2017-2027, (US$ Mn)
TABLE 33 Rest of the World RPA Market, by Automation Type, 2017-2027, (US$ Mn)
TABLE 34 Rest of the World RPA Market, by Process, 2017-2027, (US$ Mn)
TABLE 35 Rest of the World RPA Market, by Deployment Type, 2017-2027, (US$ Mn)
TABLE 36 Rest of the World RPA Market, by Enterprise Size, 2017-2027, (US$ Mn)
TABLE 37 Rest of the World RPA Market, by Industry Vertical, 2017-2027, (US$ Mn)
TABLE 38 Rest of the World RPA Market Value, by Region/Country, 2017 – 2027, (US$ Mn)
TABLE 39 UiPath: Company Snapshot (Business Description; Profile Type Portfolio; Financial Information; Business Overview and Recent Development)
TABLE 40 Automation Anywhere Inc.: Company Snapshot (Business Description; Profile Type Portfolio; Financial Information; Business Overview and Recent Development)
TABLE 41 Blue Prism Ltd.: Company Snapshot (Business Description; Profile Type Portfolio; Financial Information; Business Overview and Recent Development)
TABLE 42 NICE: Company Snapshot (Business Description; Profile Type Portfolio; Financial Information; Business Overview and Recent Development)
TABLE 43 Pegasystems Inc.: Company Snapshot (Business Description; Profile Type Portfolio; Financial Information; Business Overview and Recent Development)
TABLE 44 Kofax Inc.: Company Snapshot (Business Description; Profile Type Portfolio; Financial Information; Business Overview and Recent Development)
TABLE 45 NTT Advanced Technology Corp.: Company Snapshot (Business Description; Profile Type Portfolio; Financial Information; Business Overview and Recent Development)
TABLE 46 EdgeVerve Systems Ltd.: Company Snapshot (Business Description; Profile Type Portfolio; Financial Information; Business Overview and Recent Development)
TABLE 47 ActiveOps Ltd.: Company Snapshot (Business Description; Profile Type Portfolio; Financial Information; Business Overview and Recent Development)
TABLE 48 HelpSystems: Company Snapshot (Business Description; Profile Type Portfolio; Financial Information; Business Overview and Recent Development)

Frequnetly Asked Questions

What is the size of Robotic Process Automation (RPA) Market?

The market for Robotic Process Automation (RPA) is expected to reach US$ 10,781.0 Mn by 2027.

What is the Robotic Process Automation (RPA) Market CAGR?

The Robotic Process Automation (RPA) market is expected to see significant CAGR growth over the coming years, at 31.8%.

What is the Forecast period considered for Robotic Process Automation (RPA) Market?

The report is forecasted from 2019-2027.

What is the base year considered for Robotic Process Automation (RPA) Market?

The base year of this report is 2021.

Who are the major players in this market?

UiPath, Automation Anywhere Inc., Blue Prism Ltd., NICE, Pegasystems Inc., Kofax Inc., NTT Advanced Technology Corporation, EdgeVerve Systems Ltd., ActiveOps Ltd. are some of the major players in the global market.

Robotic Lawn Mowers Market

Published:
Report ID: 10104

Robotic Vacuum Cleaners Market

Published:
Report ID: 10101

Material Handling Robotics Market

Published:
Report ID: 56925

Space Robotic Solution Market

Published:
Report ID: 51501

Medical Robotic System Market

Published:
Report ID: 54425

Residential Robotic Vacuum Cleaner Market

Published:
Report ID: 48851

Robotic Flight Stimulator Surgery Market

Published:
Report ID: 50944

North America Robotic Laser Cutting Market

Published:
Report ID: 50685

Europe Robotic Laser Cutting Market

Published:
Report ID: 49791

Trade Surveillance Market

Published:
Report ID: 11522

Trade Management Software Market

Published:
Report ID: 11521

Tokenization Market

Published:
Report ID: 11405

Wi-Fi Home Gateway Market

Published:
Report ID: 12074

Thyristor Market

Published:
Report ID: 11279

Software Defined Perimeter (SDP) Market

Published:
Report ID: 10491

Power System Analysis Software Market

Published:
Report ID: 10967

Machine Learning As A Service Market

Published:
Report ID: 7883

Master Recharge API Market

Published:
Report ID: 8554

Industrial Cyber Security Solutions And Services Market

Published:
Report ID: 6773

Mass Notification Systems Market

Published:
Report ID: 8598

On-Shelf Availability Solutions Market

Published:
Report ID: 7728

Purchase Options

The report comes as a view-only PDF document, optimized for individual clients. This version is recommended for personal digital use and does not allow printing.
$4699

To meet the needs of modern corporate teams, our report comes in two formats: a printable PDF and a data-rich Excel sheet. This package is optimized for internal analysis and multi-location access, making it an excellent choice for organizations with distributed workforce.
$5699

The report will be delivered in printable PDF format along with the report’s data Excel sheet. This license offers 100 Free Analyst hours where the client can utilize Credence Research Inc.’s research team. It is highly recommended for organizations seeking to execute short, customized research projects related to the scope of the purchased report.
$7699

Smallform of Sample request

Have a question?

User Profile

Don’t settle for less – trust Mitul to help you find the best solution.

Report delivery within 24 to 48 hours

– Other Info –

What people say?-

User Review

I am very impressed with the information in this report. The author clearly did their research when they came up with this product and it has already given me a lot of ideas.

Jana Schmidt
CEDAR CX Technologies

– Connect with us –

Phone

+91 6232 49 3207


support

24/7 Research Support


sales@credenceresearch.com

– Research Methodology –

Going beyond the basics: advanced techniques in research methodology

– Trusted By –

Pepshi, LG, Nestle
Motorola, Honeywell, Johnson and johnson
LG Chem, SIEMENS, Pfizer
Unilever, Samsonite, QIAGEN