
Market Overview
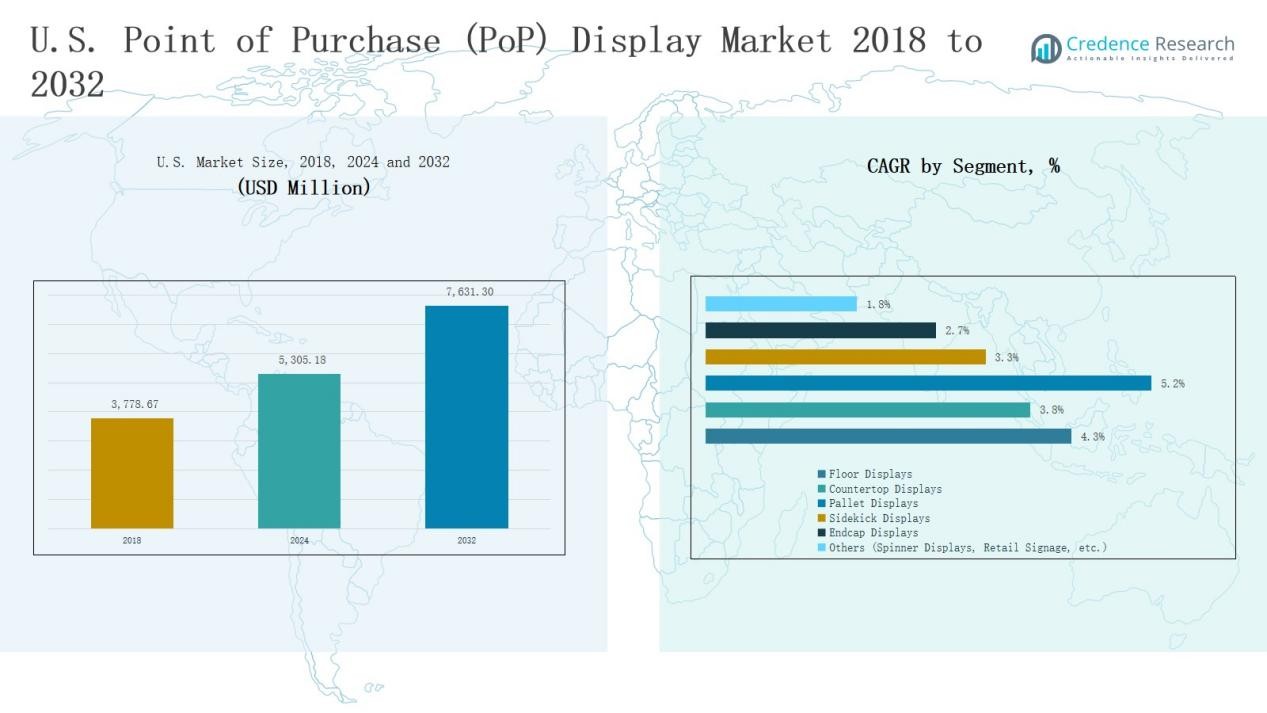
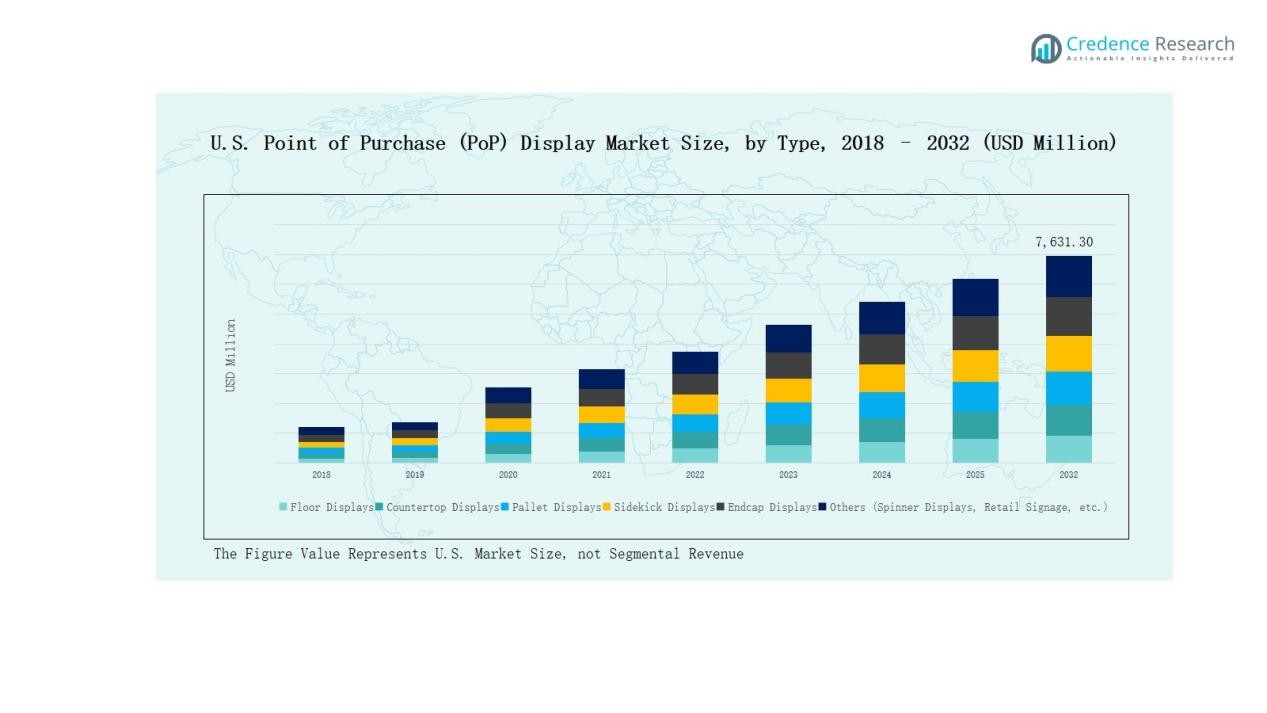
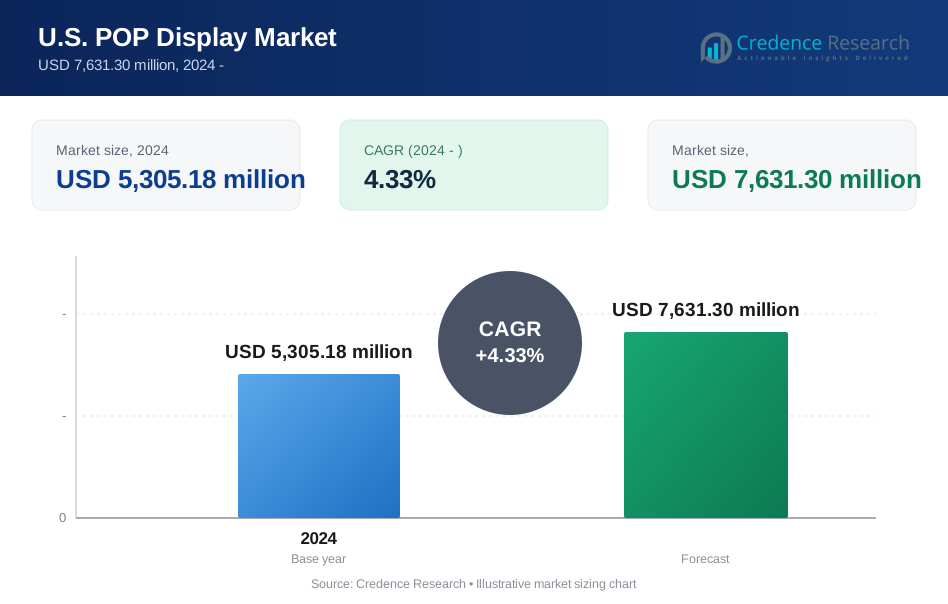
U.S. Point of Purchase (PoP) Display Market size was valued at USD 3,778.67 million in 2018 to USD 5,305.18 million in 2024 and is anticipated to reach USD 7,631.30 million by 2032, at a CAGR of 4.33% during the forecast period.
| REPORT ATTRIBUTE | DETAILS |
|---|---|
| Historical Period | 2020-2023 |
| Base Year | 2024 |
| Forecast Period | 2025-2032 |
| U.S. Point of Purchase (PoP) Display Market Size 2024 | USD 5,305.18 Million |
| U.S. Point of Purchase (PoP) Display Market, CAGR | 4.33% |
| U.S. Point of Purchase (PoP) Display Market Size 2032 | USD 7,631.30 Million |
The U.S. Point of Purchase (PoP) Display Market is characterized by strong competition among established players, including Creative Displays Now, Hawver Display, Keystone Display, Stephen Gould, Trion Industries, Kinter, Meridian Display & Merchandising, shopPOPdisplays, Braeside Displays, and U.S. Display Group. These companies focus on innovation, customization, and eco-friendly solutions to meet evolving retailer needs. The South stands as the leading regional market, commanding 35% share in 2024, driven by rapid retail expansion, high consumer demand, and extensive use of floor and pallet displays.
Market Insights
- The U.S. Point of Purchase (PoP) Display Market grew from USD 3,778.67 million in 2018 to USD 5,305.18 million in 2024 and will reach USD 7,631.30 million by 2032.
- Floor displays lead with 35% share, while pallet and endcap units strengthen promotional reach; countertop displays remain essential for impulse-driven sales in convenience outlets.
- Food and beverage dominate applications with 40% share, followed by cosmetics and personal care at 18%, while pharmaceuticals, electronics, and automotive maintain steady adoption.
- Temporary POP displays account for 60% share due to seasonal promotions, while permanent displays hold 40%, mainly in electronics and luxury cosmetics for long-term branding.
- The South leads regionally with 35% share, followed by the West at 23%, Northeast at 22%, and Midwest at 20%, reflecting strong nationwide retail expansion.
Market Segment Insights
By Type
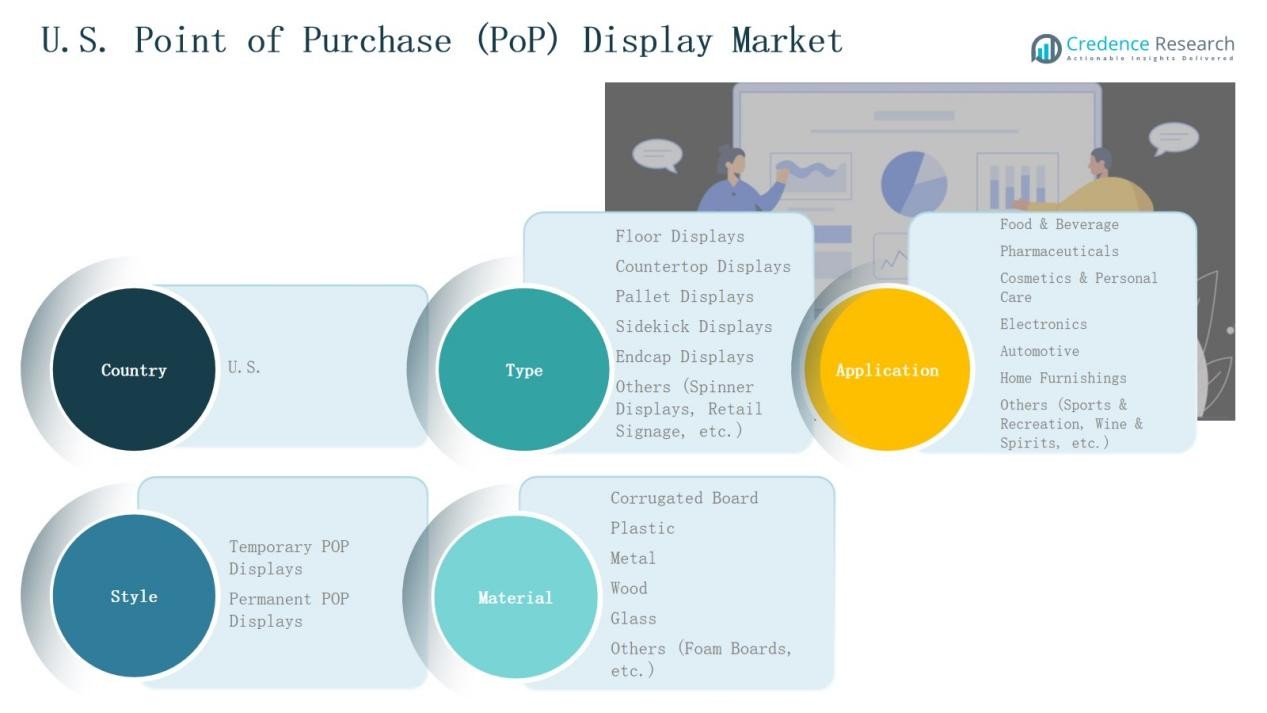
Floor displays lead the market with nearly 35% share, supported by high visibility and adaptability in large retail environments. Pallet displays and endcap units follow closely, boosting bulk sales and promotional reach in supermarkets. Countertop displays maintain strong adoption in convenience and pharmacy stores for impulse products. Sidekick and other formats hold niche roles, mainly enhancing branding, aisle exposure, and targeted promotions across specialized product categories.
By Application
The food and beverage sector dominates with 40% share, driven by frequent promotional campaigns and high product turnover. Cosmetics and personal care contribute around 18%, reflecting premium placements in specialty stores. Pharmaceuticals hold nearly 12%, supported by countertop displays in pharmacies. Electronics account for 10%, while automotive and home furnishings together represent about 15%. Sports, recreation, and wine & spirits capture the remaining share through targeted promotional strategies.
- For instance, Coca‑Cola launched limited‑edition FIFA World Cup promotional displays across over 10,000 retail outlets in Europe, boosting seasonal sales.
By Style
Temporary POP displays hold 60% share, favored for seasonal campaigns, launches, and low-cost promotions. Their flexibility and easy setup make them a strong choice for fast-moving consumer goods. Permanent displays command 40%, used mainly for premium and high-value goods like electronics and luxury cosmetics. Their durability and integration into store design improve long-term visibility, enhance customer experience, and reinforce consistent branding across retail chains.
- For instance, Procter & Gamble deployed temporary cardboard displays for Tide’s new cold-water detergent in North American retail chains, boosting in-store trial visibility.
Key Growth Drivers
Rising Retail Promotions and Brand Visibility
Retailers and brands increasingly rely on POP displays to boost in-store promotions and highlight product visibility. In the U.S., consumer goods companies invest heavily in seasonal campaigns, cross-merchandising, and impulse-driven sales. Floor and pallet displays are particularly effective in supermarkets and warehouse clubs, enhancing brand recall and driving purchase decisions. This growth driver is further supported by heightened competition among consumer brands, where differentiated visual marketing strategies are critical for winning customer attention at the point of sale.
- For instance, Coca-Cola Amatil installed transparent LCD cooler doors with interactive screens in convenience stores, leading to a 12% average sales increase, with some promotions producing up to 120% monthly sales lift.
Expansion of Supermarkets and Convenience Stores
The continued expansion of supermarkets, hypermarkets, and convenience stores fuels demand for POP displays across the U.S. These retail formats prioritize displays that support quick restocking, organized product presentation, and impactful promotions. Floor and endcap displays dominate in large stores, while countertop units thrive in convenience outlets. The growing footprint of retail chains in suburban and urban areas ensures steady adoption. This expansion, combined with rising consumer footfall, creates strong opportunities for display providers to capture market growth.
- For instance, 7‑Eleven expanded its convenience store network with over 100 new outlets in the U.S., increasing the use of countertop and compact POP units optimized for impulse buys near checkout counters.
Growth of FMCG and Packaged Goods Sector
The U.S. FMCG sector, including food, beverages, personal care, and household products, remains a primary driver of POP display demand. High competition in these categories pushes brands to adopt eye-catching temporary displays for new launches and promotional offers. With short product cycles and frequent campaigns, demand for low-cost, customizable displays is rising. Corrugated board and plastic displays dominate in this space, offering flexibility and cost efficiency. The continuous growth of packaged goods sales sustains long-term expansion for POP display manufacturers.
Key Trends & Opportunities
Integration of Digital and Interactive Displays
A growing trend in the U.S. market is the adoption of digital POP displays with interactive features. Retailers are embedding LED screens, motion sensors, and QR codes to engage customers and deliver personalized promotions. This creates opportunities for brands to merge physical and digital retail experiences, boosting shopper engagement. As consumers embrace omnichannel shopping, interactive displays provide valuable data insights and enhance purchase intent, positioning technology-enabled POP displays as a key growth opportunity.
- For instance, Coca-Cola Amatil’s interactive coolers with transparent LCD doors and motion-activated screens increased product sales by 12% on average during trial runs, with a special promotion driving a 120% sales increase in one month.
Sustainability and Eco-Friendly Displays
Sustainability is shaping demand for eco-friendly POP displays in the U.S. Brands are shifting toward recyclable corrugated boards, biodegradable plastics, and reusable permanent displays to align with consumer environmental expectations. Retailers also prefer materials that reduce waste and support corporate sustainability goals. This trend creates opportunities for manufacturers to innovate with green materials and modular designs. Companies that emphasize eco-friendly solutions are likely to gain competitive advantages, as sustainability increasingly influences purchasing decisions and retailer partnerships.
- For instance, Euromon PLV developed a sustainable MDF wood display for Pringles that combines durability with environmental responsibility.
Key Challenges
High Competition and Cost Pressure
The U.S. POP display market faces intense competition, with numerous regional and global players offering similar solutions. Price sensitivity among retailers, especially for temporary displays, creates cost pressure. Manufacturers often struggle to balance affordability with quality and innovation. This challenge intensifies as raw material costs fluctuate, limiting margins. Companies must adopt efficient production strategies and value-added services to differentiate themselves while managing cost competitiveness in a crowded market environment.
Shift Toward Online Shopping
The rapid rise of e-commerce in the U.S. poses a significant challenge to POP display demand. Online platforms reduce reliance on in-store promotions, limiting opportunities for physical displays. Consumer preference for doorstep delivery and digital marketing campaigns reduces foot traffic in brick-and-mortar stores. While hybrid shopping remains, the trend toward online-first purchasing pressures POP display providers to rethink strategies. This shift necessitates integration of digital features or hybrid solutions to remain relevant in a retail landscape dominated by e-commerce.
Limited Lifespan of Temporary Displays
Temporary displays, which dominate the U.S. market, face challenges related to durability and short usage cycles. While cost-efficient, they often fail to withstand extended campaigns or heavy customer interaction, leading to frequent replacements. This raises concerns for both brands and retailers regarding waste, logistics, and cost efficiency. Increasing sustainability awareness further amplifies the issue, as temporary units are often discarded quickly. Manufacturers must focus on improving material quality and design innovations to address these concerns effectively.
Regional Analysis
Northeast
The Northeast holds 22% share of the U.S. Point of Purchase (PoP) Display Market, driven by its dense population and strong retail presence in states like New York, New Jersey, and Massachusetts. Supermarkets and convenience stores dominate demand, with floor and countertop displays widely used for food, beverages, and pharmaceuticals. It benefits from urban retail chains adopting both temporary and permanent displays. The region’s focus on premium products also supports demand for permanent POP units in cosmetics and electronics.
Midwest
The Midwest accounts for 20% share, with its strength rooted in large-format retail and warehouse clubs across states such as Illinois, Ohio, and Michigan. It plays a critical role in the adoption of pallet and endcap displays, favored by discount retailers and wholesale outlets. The market benefits from the region’s strong consumer goods sector, particularly packaged food and household products. It continues to emphasize cost-effective temporary displays, supporting FMCG promotions and bulk product visibility in retail channels.
South
The South leads with 35% share, making it the largest regional market. Its dominance is driven by rapid retail expansion in Texas, Florida, and Georgia, where supermarkets, hypermarkets, and convenience stores continue to grow. It shows strong adoption of floor and pallet displays for food and beverage promotions. The rising demand for cosmetics and personal care also supports countertop display sales. Retail chains in the South emphasize promotional campaigns, helping the region maintain leadership in the overall market.
West
The West contributes 23% share, led by California, Washington, and Arizona. It remains a dynamic market due to strong innovation in retail formats and technology-driven adoption of POP displays. The U.S. Point of Purchase (PoP) Display Market in this region reflects a growing shift toward eco-friendly materials and digital display integration. Electronics and premium cosmetics drive permanent display demand, while food and beverage promotions sustain growth in temporary displays. It continues to attract investment from leading display manufacturers.
Market Segmentations:
By Type
- Floor Displays
- Countertop Displays
- Pallet Displays
- Sidekick Displays
- Endcap Displays
- Others (Spinner Displays, Retail Signage, etc.)
By Application
- Food & Beverage
- Pharmaceuticals
- Cosmetics & Personal Care
- Electronics
- Automotive
- Home Furnishings
- Others (Sports & Recreation, Wine & Spirits, etc.
By Style
- Temporary POP Displays
- Permanent POP Displays
By Material
- Corrugated Board
- Plastic
- Metal
- Wood
- Glass
- Others (Foam Boards, etc.)
By Region
- Northeast
- Midwest
- South
- West
Competitive Landscape
The U.S. Point of Purchase (PoP) Display Market is highly competitive, with a strong presence of both established players and regional specialists. Leading companies such as Creative Displays Now, Hawver Display, Keystone Display, and Stephen Gould focus on innovative designs, customization, and cost efficiency to capture retailer demand. Trion Industries and Kinter emphasize durable solutions and metal-based displays, while shopPOPdisplays and Braeside Displays specialize in plastic and corrugated board units for temporary campaigns. U.S. Display Group and Meridian Display & Merchandising maintain a strong footprint in large-scale retail programs, offering turnkey solutions that cover design, manufacturing, and distribution. Competition is shaped by pricing pressure, sustainability requirements, and the rising adoption of digital or interactive POP units. Companies are actively investing in eco-friendly materials, modular systems, and automation to strengthen market position. Continuous innovation and tailored solutions remain central strategies, as brands seek impactful displays to differentiate in a crowded retail environment.
Key Players
- Creative Displays Now
- Hawver Display
- Keystone Display
- Stephen Gould
- Trion Industries
- Kinter (K International, Inc.)
- Meridian Display & Merchandising
- shopPOPdisplays
- Braeside Displays
- S. Display Group
Recent Developments
- In 2025, Displays2go introduced a new lineup of digital display solutions, including 43″–75″ non-touch kiosks, touch-screen digital posters, dual-sided interactive kiosks, and outdoor dvLED posters designed with weather resistance and Android 11 OS.
- In July 2025, The Royal Group (TRG) acquired Trans World Marketing, a leading provider of custom permanent retail displays. This strategic acquisition expands TRG’s capabilities in designing and delivering durable in-store display solutions.
- In August 2025, Prometheus Retail Solutions acquired the PackagingARTS division, a creative leader in packaging and retail display design for premium wine, spirits, and related displays. This deal enhances Prometheus’s full-service offering in the PoP display space.
- In June 2025, Hunter Displays was sold by Woodbridge to EK Group, merging with Bridge Metal Industries to strengthen EK’s New York-based POP display and custom metal fabrication operations.
Report Coverage
The research report offers an in-depth analysis based on Type, Application, Style, Material and Region. It details leading market players, providing an overview of their business, product offerings, investments, revenue streams, and key applications. Additionally, the report includes insights into the competitive environment, SWOT analysis, current market trends, as well as the primary drivers and constraints. Furthermore, it discusses various factors that have driven market expansion in recent years. The report also explores market dynamics, regulatory scenarios, and technological advancements that are shaping the industry. It assesses the impact of external factors and global economic changes on market growth. Lastly, it provides strategic recommendations for new entrants and established companies to navigate the complexities of the market.
Future Outlook
- Retailers will increase adoption of interactive and digital POP displays to enhance engagement.
- Sustainability will drive demand for recyclable and eco-friendly materials in display manufacturing.
- Temporary displays will remain dominant due to frequent promotional campaigns and seasonal sales.
- Permanent displays will grow in premium categories such as electronics and cosmetics.
- E-commerce growth will encourage hybrid display strategies combining physical and digital promotions.
- Supermarkets and hypermarkets will continue leading demand with high footfall-driven promotions.
- Convenience stores will expand use of countertop displays for impulse-driven product sales.
- Investments in automation and modular design will improve display efficiency and cost control.
- Branding strategies will focus more on customized displays to differentiate products in crowded aisles.
- Regional players will strengthen presence through flexible, low-cost solutions tailored for local retailers.
Request a Free Sample
Fill in your details and we'll send you a free sample report.
- Sample data tables & charts
- Research methodology
Need a Custom Version of This Report?
Tailor the scope, geography, or segments to your exact requirements.
- Custom geography or segment scope
- Direct access to our analyst team
Frequently Asked Questions
What is the current market size for the U.S. Point of Purchase (PoP) Display Market, and what is its projected size in 2032?
At what Compound Annual Growth Rate is the U.S. Point of Purchase (PoP) Display Market projected to grow between 2025 and 2032?
Which U.S. Point of Purchase (PoP) Display Market segment held the largest share in 2024?
What are the primary factors fueling the growth of the U.S. Point of Purchase (PoP) Display Market?
Who are the leading companies in the U.S. Point of Purchase (PoP) Display Market?
Which region commanded the largest share of the U.S. Point of Purchase (PoP) Display Market in 2024?
Table of Content
Chapter 1. Report Introduction
- 1.1 Report Description & Purpose
- 1.1.1 Report Title & Market Definition
- 1.1.2 Unique Selling Propositions (USP) & Key Differentiators
- 1.1.3 Value Proposition for Stakeholders
- 1.2 Research Objectives
- 1.2.1 Market Sizing Objectives (Volume & Revenue)
- 1.2.2 Segmentation Objectives
- 1.2.3 Competitive Intelligence Objectives
- 1.2.4 Forecast & Scenario Objectives
- 1.3 Report Scope
- 1.3.1 U.S. POP Display Scope – Types & Subtypes Covered
- 1.3.2 Geographic Scope – Regions & Countries Covered
- 1.3.3 Historical Period, Base Year & Forecast Period (2024; forecast to the forecast period)
- 1.3.4 Inclusions & Exclusions
- 1.4 HS Code & Classification Framework
- 1.5 Currency, Units & Pricing Basis
- 1.6 Target Stakeholders
- 1.7 Limitations & Assumptions
Chapter 2. Executive Summary
- 2.1 Global U.S. POP Display Market Snapshot
- 2.1.1 Market Size – Historical (2024) & Forecast (the forecast period) (2024: USD 5,305.18 million → forecast year: USD 7,631.30 million)
- 2.1.2 Volume & Revenue – Global Totals
- 2.1.3 Key Market Highlights – Top Five Facts
- 2.2 U.S. POP Display Market Segmentation Snapshot
- 2.2.1 Market Split by Region – 2024 vs.
- 2.3 Competitive Snapshot
- 2.3.1 Top 10 Players by Revenue Share – 2024
- 2.3.2 Top 10 Players by Volume Share – 2024
- 2.3.3 Recent Strategic Developments (18-Month Summary)
- 2.4 Key Investment Highlights & Strategic Conclusions
Chapter 3. U.S. POP Display Market Dynamics & Industry Analysis
- 3.1 Market Overview & Context
- 3.1.1 U.S. POP Display Market Position in the Broader Automotive Value Chain
- 3.1.2 OEM vs. Replacement Market Dynamics
- 3.1.3 Market Maturity & Development Stage by Region
- 3.2 U.S. POP Display Market Drivers
- 3.3 U.S. POP Display Market Restraints & Challenges
- 3.4 U.S. POP Display Market Opportunities
- 3.5 Porter's Five Forces Analysis
- 3.5.1 Threat of New Entrants
- 3.5.2 Bargaining Power of Suppliers
- 3.5.3 Bargaining Power of Buyers
- 3.5.4 Threat of Substitutes
- 3.5.5 Competitive Rivalry – Intensity Assessment
- 3.6 U.S. POP Display Value Chain Analysis
- 3.6.1 Upstream – Raw Material/Input Suppliers
- 3.6.1.1 Raw Material/Input 1
- 3.6.1.2 Raw Material/Input 2
- 3.6.1.3 Raw Material/Input 3
- 3.6.2 Midstream – Production/Manufacturing/Service Delivery
- 3.6.2.1 Production/Process Overview
- 3.6.2.2 Key Facility Locations & Capacity by Manufacturer
- 3.6.3 Downstream – Distribution & End Consumer
- 3.6.3.1 Primary Channel – B2B/OEM
- 3.6.3.2 Secondary Channels – Dealer, Retail, Online, Direct
- 3.6.4 Value Chain Profitability Analysis
- 3.6.1 Upstream – Raw Material/Input Suppliers
- 3.7 PESTEL Analysis
- 3.7.1 Political Factors
- 3.7.2 Economic Factors
- 3.7.3 Social Factors
- 3.7.4 Technological Factors
- 3.7.5 Environmental Factors
- 3.7.6 Legal Factors
- 3.8 U.S. POP Display Supply Chain Analysis
- 3.8.1 Raw Material/Input Supply Risk Assessment
- 3.8.2 Manufacturing Concentration Risk (Geographic Exposure)
- 3.8.3 Trade Disruption Impact Analysis
- 3.9 Regulatory & Policy Landscape
Note: The regulatory and policy landscape section covers regulations based on their applicability to the market, U.S. POP Display category, geography, and scope of the study. Only regulatory frameworks with a material impact on operations, compliance, trade, sustainability, or market access are analyzed in detail.
Chapter 4. Key Investment Pockets & Opportunity Analysis
- 4.1 U.S. POP Display Market Attractiveness Analysis
- 4.1.1 By Region – Investment Attractiveness Matrix (Volume × CAGR)
- 4.2 Absolute Revenue Growth Opportunity
- 4.2.1 By Region – Absolute USD Growth Through the forecast period
- 4.3 Incremental Volume Opportunity
- 4.3.1 By Region – Incremental Volume Through the forecast period
- 4.3.2 Segment – Incremental Volume
- 4.4 Emerging Submarket Opportunity Deep Dive (Subject to Applicability)
- 4.5 Emerging Market Opportunity Scorecards
- 4.5.1 United States
- 4.5.2 Europe
- 4.5.3 Asia
- 4.5.4 Middle East & Africa
Note: Emerging Market Opportunity Scorecards will be included based on relevance and strategic importance. Regions listed are indicative and may vary depending on data availability and market dynamics.
Chapter 5. U.S. POP Display Import-Export Analysis & Trade Flows
- 5.1 Global Trade Overview
- 5.1.1 Global Export Value by Country (2024)
- 5.1.2 Global Export Volume by Country (2024)
- 5.1.3 Global Import Value by Country (2024)
- 5.1.4 Global Import Volume by Country (2024)
- 5.1.5 Net Trade Balance by Country (2024)
- 5.2 Export Analysis – Segment
- 5.2.1 Type 1 (HS Code)
- 5.2.2 Type 2 (HS Code)
- 5.2.3 Type 3 (HS Code)
- 5.2.4 Type 4 (HS Code)
- 5.2.5 Type 5 (HS Code)
- 5.3 Import Analysis – Segment
- 5.3.1 Type 1 (HS Code)
- 5.3.2 Type 2 (HS Code)
- 5.3.3 Type 3 (HS Code)
- 5.3.4 Type 4 (HS Code)
- 5.3.5 Type 5 (HS Code)
- 5.4 Average Unit Trade Prices
- 5.4.1 Average Export Price – Segment & Country
- 5.4.2 Average Import Price – Segment & Source Country
- 5.4.3 Price Trends (2024)
- 5.5 Key Trade Route Analysis
- 5.5.1 Trade Route 1
- 5.5.2 Trade Route 2
- 5.5.3 Trade Route 3
- 5.5.4 Trade Route 4
- 5.5.5 Trade Route 5
- 5.6 Trade Policy Impact Assessment
- 5.6.1 US Anti-Dumping & Section 301 Tariffs
- 5.6.2 EU Customs Union Impact
- 5.6.3 Major Free Trade Agreements
- 5.6.4 USMCA Rules of Origin
Note: Trade policy analysis will be included only where relevant to the U.S. POP Display market.
Chapter 6. Competitive Landscape & Company Benchmarking
- 6.1 U.S. POP Display Market Concentration & Structure
- 6.1.1 Herfindahl-Hirschman Index (HHI) – vs. 2024
- 6.1.2 Tier 1, Tier 2 & Tier 3 Market Structure
- 6.1.3 Global, Regional & Local Player Dynamics
- 6.2 U.S. POP Display Market Share Analysis – 2024
- 6.2.1 Global Revenue Share by Company
- 6.2.2 Global Volume Share by Company
- 6.2.3 Regional Revenue Share
- 6.2.4 Market Share Evolution ( vs. 2024)
- 6.2.5 OEM Segment Share by Company
- 6.2.6 Replacement Segment Share by Company
- 6.3 Production/Delivery Capacity & Facility Analysis
- 6.3.1 Global Installed Capacity
- 6.3.2 Capacity Utilization Rates
- 6.3.3 Production/Output Volume
- 6.3.4 Facility Locations & Capacity Map
- 6.3.5 Planned Capacity Additions
- 6.4 U.S. POP Display Competitive Benchmarking Matrix
- 6.4.1 Revenue, Volume, CAGR & Profitability Comparison
- 6.4.2 Channel Revenue Mix
- 6.4.3 Geographic Revenue Exposure
- 6.4.4 R&D Intensity
- 6.4.5 Sustainability Maturity
- 6.5 Strategic Developments in U.S. POP Display (Last 24 Months)
- 6.5.1 Mergers, Acquisitions & Divestments
- 6.5.2 New U.S. POP Display Launches
- 6.5.3 Facility Expansions
- 6.5.4 Strategic Alliances, Joint Ventures & Partnerships
- 6.5.5 Distribution Expansion & Market Entry
- 6.5.6 Sustainability & ESG Initiatives
- 6.6 Competitive Strategy Mapping
- 6.6.1 Leader, Challenger, Follower & Niche Classification
- 6.6.2 Pricing Strategy Comparison
- 6.6.3 Channel Strategy Matrix
Note: Strategic developments are included based on their materiality and the availability of reliable information.
Chapter 7. Global U.S. POP Display Market – By Distribution Channel
- 7.1 Segment Overview
- 7.1.1 Volume & Revenue Split by Channel (2024 & )
- 7.1.2 Channel Mix Evolution (the forecast period)
Chapter 8. Regional Market Analysis – Global Overview
- 8.1 Global Regional Overview
- 8.1.1 Regional Volume Share
- 8.1.2 Regional Revenue Share
- 8.1.3 Regional Volume by Region
- 8.1.4 Regional Revenue by Region
- 8.1.5 Regional Forecast Through the forecast period
- 8.2 Cross-Regional Segment Analysis
- 8.2.1 By Distribution Channel
- 8.2.2 By Brand/Price Tier
Chapter 9. North America U.S. POP Display Market
- 9.1 United States
- 9.2 Canada
- 9.3 Mexico
Chapter 10. Europe U.S. POP Display Market
- 10.1 Germany
- 10.2 France
- 10.3 Italy
- 10.4 United Kingdom
- 10.5 Spain
- 10.6 Poland
- 10.7 Russia
- 10.8 Netherlands
- 10.9 Belgium
- 10.10 Sweden
- 10.11 Denmark
- 10.12 Norway
- 10.13 Rest of Europe
Chapter 11. Asia Pacific U.S. POP Display Market
- 11.1 China
- 11.2 India
- 11.3 Japan
- 11.4 South Korea
- 11.5 Thailand
- 11.6 Indonesia
- 11.7 Vietnam
- 11.8 Malaysia
- 11.9 Australia
- 11.10 Rest of Asia Pacific
Chapter 12. Latin America U.S. POP Display Market
- 12.1 Brazil
- 12.2 Argentina
- 12.3 Colombia
- 12.4 Chile
- 12.5 Rest of Latin America
Chapter 13. Middle East U.S. POP Display Market
- 13.1 Saudi Arabia
- 13.2 United Arab Emirates
- 13.3 Turkey
- 13.4 Israel
- 13.5 Iran
- 13.6 Rest of the Middle East
Chapter 14. Africa U.S. POP Display Market
- 14.1 South Africa
- 14.2 Egypt
- 14.3 Nigeria
- 14.4 Morocco
- 14.5 Rest of Africa
Chapter 15. U.S. POP Display Company Profiles
- 15.1 [Company 01]
- 15.1.1 Company Overview
- 15.1.2 Key Management Personnel
- 15.1.3 Products & Services Portfolio
- 15.1.4 Financial Performance
- 15.1.5 Key Market Focus & Geographic Presence
- 15.1.6 Recent Developments & Strategic Initiatives
Note: The company profile list is preliminary and may change based on research findings, market developments, data availability, and client requirements.
Chapter 16. Appendices
- Appendix A – List of Abbreviations & Acronyms
- Appendix B – Industry Classification Code Reference – Full Series
- Appendix C – Production & Capacity Data Tables
- Appendix D – End-Use & Demand Base Tables
- Appendix E – Consumption & Replacement Rate Assumptions
- Appendix F – ASP Reference Tables
- Appendix G – Manufacturing & Facility Database
- Appendix H – Import-Export Data Tables
- Appendix I – Regulatory Summary Tables
- Appendix J – Primary Research Participant List (Anonymized)
- Appendix K – Primary Research Questionnaire Framework
- Appendix L – Data Sources & Bibliography
- Appendix M – Market Size Divergence & Source Comparison
Chapter 17. Research Methodology
- 17.1 Research Framework & Philosophy
- 17.2 Secondary Research – Sources, Hierarchy & Data Extraction
- 17.3 Data Modeling – Bottom-Up & Top-Down Market Sizing
- 17.4 Primary Research – Stakeholder Framework, LOI & Sample Sizes
- 17.5 Forecast Methodology – Regression, Scenario & Sensitivity Analysis
- 17.6 Quality Control – Four-Layer Validation Framework
- 17.7 Limitations & Standard Assumptions
- 17.8 Disclaimer
