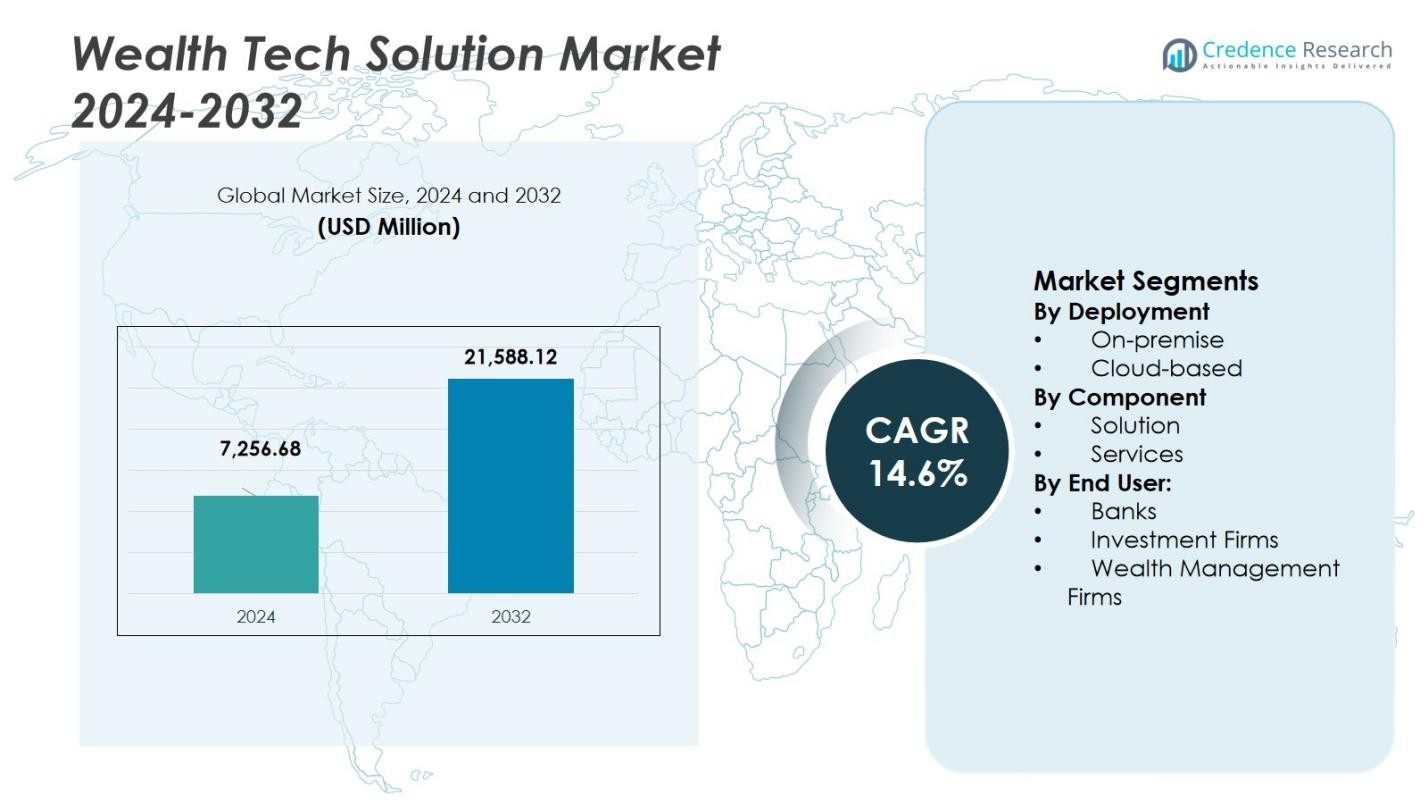
Global Wealth Tech Solution Market By Deployment Mode (Cloud and On-Premise), By Enterprise Size (Large Enterprises and Small and Medium-sized Enterprises) Growth, Future Prospects & Competitive Analysis, 2016 – 2030

Price: $4999

Published: | Report ID: 16791 | Report Format : PDF

Key Highlights of the report

How are the major segments performing in the WealthTech Solutions market?

  • In 2022, the solution segment held the prominent market share due to the high adoption of automation solutions across industries.
  • In 2022, the large enterprises segment held a prominent market share due to various major key players’ growing adoption of wealthtech solutions.
  • In 2022, wealth management firms were the fastest-growing category due to the growing popularity of AI-based wealthtech solutions in management firms.
  • In 2022, the on-premise segment held a prominent market share due to growing security concerns related to wealthtech solutions.

What is the Market Size of WealthTech Solutions regarding value?

The global wealthtech solutions market is anticipated to grow at a substantial CAGR of 15.30% in the upcoming years. The global wealthtech solutions industry was estimated to be worth USD 5.2 billion in 2022 and was expected to be worth USD 14.09 billion by 2028.

Design Element 2

Access crucial information at unmatched prices!

Request your free sample report today & start making informed decisions powered by Credence Research!

Download Free Sample
CTA Design Element 3

Which region dominated the WealthTech Solutions market?

In 2022, the North American region was anticipated to hold a prominent share of the global wealthtech solutions market. This is attributed to the expansion of industries in the region, which is anticipated to drive demand during the forecasted period. Moreover, implementing technologies in banks is another factor likely to increase demand for wealthtech solutions. These solutions can provide real-time data that assist businesses in making better investment decisions, which further helps to expand management efficiency and operational agility.

Wealth Tech Solution Market

How is US Market Performing in the WealthTech Solutions market?

In 2022, the US market experienced growth in the wealth management industry, largely due to the development of new and innovative business models, as well as the emergence of new competitors vying for a share of the world’s largest market for investment securities. Additionally, banks and private firms are increasingly expecting more from their wealth management advisors, which has created a significant demand for customized and advanced financial advice that meets their unique needs.

How is the economy impacting the global WealthTech Solutions growth?

In 2022, the COVID-19 pandemic hit the economy, and the consequent lockdown resulted in an acute financial crisis for consumers, which led them to postpone their wealth management. The fall in demand for WealthTech solutions was driven by job insecurity and economic uncertainty during the pandemic. However, the recession and Russia-Ukraine war also had a negative impact on the wealthtech solutions industry.

What is the competitive environment of the WealthTech Solutions market?

Key players like FinMason, Inc., InvestCloud, etc., Aixigo AG, and BlackRock, Inc., are entering into strategic partnerships and collaborations to expand the business. Market players are focused on new product launches and product enhancement in existing products to accelerate market growth. For instance, in November 2020, BlackRock, Inc. acquired Aperio Group, a provider of separately managed accounts (SMAs) headquartered in Massachusetts, United States. This acquisition took place for USD 1 billion, and BlackRock, Inc. aims to provide enhanced SMA portfolios for clients.

Executive Summary

What are the key trends in the WealthTech Solutions market?

  • The rising implementation of automation solutions in several verticals is a factor that boosts the growth of the market. WealthTech solutions permit businesses to identify new-generation customer requirements for small consulting enterprises and large banks, including tech-enabled financial solutions, automated rebalancing, and portfolio creation.
  • The growing adoption of automation solutions across industries is boosting the growth of the wealthtech solution market. With Wealthtech solutions, small consulting companies and major banks can understand new-generation client demands, such as tech-enabled financial solutions, automatic rebalancing, and portfolio building.

How does the rise in demand for predictive analytics technology create an opportunity in the wealthtech Solutions Market?

Predictive analytics refers to using statistics and modeling techniques to make predictions regarding future outcomes and performance. Predictive analytics looks at existing and historical data patterns to decide if those patterns are likely to emerge again. Moreover, predictive analytics in WealthTech management derive relevant information that gives advisors insight into their current clients and potential financial needs. In addition, predictive analytics technology is critical to WealthTech company survival because it helps win insights into client behavior and their needs to improve services and products. Furthermore, implementing predictive analytics technology will increase the revenue of WealthTech solution providers in the upcoming years. Therefore, these factors will provide major lucrative opportunities for the WealthTech solutions market share growth.

Which are the key investments by the wealthtech solutions market players?

Companies working in the wealthtech solutions market are heavily investing in research and development to develop new and innovative techniques to deliver social CRM solutions. The wealthtech solutions market is favorably fragmented, with numerous manufacturers in developed and developing regions. For instance, Wealthfront Corporation recently added a new feature to their investment portfolios in April 2021. This feature allows clients to choose socially responsible investing options and invest in a wider selection of exchange-traded funds (ETFs) that have been carefully evaluated.

Some major players in the wealthtech solutions market are 3rd-eyes analytics, Aixigo AG, BlackRock, Inc., BME inch, InvestCloud, Inc., InvestSuite, Valuefy, Wealthfront Corporation., WealthTechs Inc., and Synechron.

What are the Major Driving Factors for the WealthTech Solutions Market?

The increase in the adoption of automation solutions across industries is fueling the growth of the WealthTech solution market. Using WealthTech solutions, companies and banks can understand new-generation client demands, such as tech-enabled financial solutions, automatic rebalancing, and portfolio building. Moreover, WealthTech solution help companies discover the demands of the next generation of customers, including those for tech-enabled financial solutions, automatic rebalancing, and portfolio development. In addition, innovative WealthTech solution providers have developed numerous automation solutions for incumbents to enhance their operations and increase income by harnessing the potential of cutting-edge technologies like Al, machine learning, and blockchain. Therefore, this is a major growth factor for the wealthtech solutions market size.

What are the Major Risks for the WealthTech Solutions Market?

WealthTech management institutions have been dealing with greater complexity in areas of compliance and regulation. The increase in regulatory burdens by governments and the rise in costs of WealthTech solutions pose new challenges to WealthTech firms and their parent companies. For instance, in the past few years, the WealthTech businesses of several global banks have attracted significant regulatory action from the US government. Moreover, the cost of these risks is especially high for high-net-worth businesses such as private banks and their parent companies because of the huge range of their product offerings and the sensitive nature and high profile of their client base. Therefore, this major factor hampers the growth of the wealthtech solution market.

Which is the key application in the wealthtech solutions market?

The solution segment is expected to hold a prominent share of the global potassium market during the forecast period. This is attributed to individuals and companies changing how they manage their finances through WealthTech or wealth management technology. A digital financial ecosystem of tools like SaaS, big data, and Al controls the worldwide flow of money. Thus, these digital tools are major factors in the market’s growth. In addition, with more dynamic user interface (UI) and user experience (UX) features, the conventional WealthTech solutions interface is getting simpler to use and improving the end-user experience.

How is the WealthTech Solutions market performing in regions?

Asia Pacific market is expected to witness the fastest growth in the global wealthtech solutions market during the forecast period. Growing adoption of digitization and utilization of cloud-based WealthTech solutions across India, Singapore, South Korea and others are expected to drive market growth rapidly in this region. In addition, a prominent number of small and medium enterprises that are moving towards adopting SaaS and cloud-based technology to develop cost-effective and highly customizable financial planning solutions are propelling demand for wealthtech solutions in the region over the forecast period. Moreover, rising internet penetration in developing economies increases digitalization in the financial sector. WealthTech solutions provide relevant information along with regulatory requirements. Investors and investment managers are looking for digital communication platforms to ensure quick investment portfolio access.

What is the regulatory landscape for the wealthtech solutions market?

The emergence of a new breed of technology-driven financial institutions, the need for traditional financial institutions to redesign their processes, and the positioning of regulators during this evolution. While RegTech is a relatively new term that undoubtedly will continue to evolve in scope and meaning, an attempt by CB Insights to map the RegTech landscape showed the following key areas that are relevant to finance: compliance, monitoring, and reporting, including general compliance management, enterprise risk management, operations risk management, portfolio risk management, vendor risk management, tax management, and so on; anti-money laundering, know your customer, and customer due diligence; and information security/cyber security.

Shape Your Report to Specific Countries or Regions & Enjoy 30% Off!

What are the key players planning for the future of the wealthtech solutions market?

Growing regional existence and investment in downstream applications are anticipated to deliver a competitive edge in the market. For instance, in January 2023, InCred Capital entered into the retail wealthtech industry by acquiring Orowealth in an all-cash deal. With this acquisition, the company has launched InCred Money, a retail-focused digital investment platform.

REPORT ATTRIBUTE DETAILS
WealthTech Solutions Market by Volume Yes
WealthTech Solutions Market by Value Yes
WealthTech Solutions Market, Tornado Analysis Yes
WealthTech Solutions Market, STAR Analysis Yes
WealthTech Solutions Market, SRC Analysis Yes
WealthTech Solutions Market, Import-Export Data Yes (On Demand)
WealthTech Solutions Market Pricing Analysis Yes (On Demand)
WealthTech Solutions Market Segment Analysis By Deployment Mode (Cloud and On-Premise)

By Enterprise Size (Large Enterprises and Small and Medium-sized Enterprises)

By End Users (Banks, Wealth Management Firms, and Others)

By Component (Solution and Service)

WealthTech Solutions Market, Regional Analysis North America (US and Canada)

Europe (Germany, UK, France, Italy, Spain, and Rest of Europe)

Asia Pacific (China, India, Japan, South Korea, South East Asia, and Rest of Asia Pacific)

Latin America (Brazil, Mexico, and Rest of Latin America)

Middle East and Africa (GCC Countries, South Africa, and Rest of Middle East and Africa)

WealthTech Solutions Market Key Companies 3rd-eyes analytics, Aixigo AG, BlackRock, Inc., BME inntech, InvestCloud, Inc., InvestSuite, Valuefy, Wealthfront Corporation., WealthTechs Inc., Synechron
WealthTech Solutions Market Competitive Landscape Market Share Analysis

Competitive Benchmarking

Key Players Market Positioning

Geographical Presence Analysis

Major Strategies Adopted

Segmentation of Global WealthTech Solutions Market-

Global WealthTech Solutions Market – By Deployment Mode

  • Cloud
  • On-Premise

Global WealthTech Solutions Market – By Enterprise Size

  • Large Enterprises
  • Small and Medium-sized Enterprises

Global WealthTech Solutions Market – By End User

  • Banks
  • Wealth Management Firms
  • Others

Global WealthTech Solutions Market – By Component

  • Solution
  • Service

Global WealthTech Solutions Market – By Region

  • North America
    • U.S.
    • Canada
  • Europe
    • Germany
    • France
    • U.K.
    • Italy
    • Spain
    • Rest of Europe
  • Asia Pacific
    • China
    • Japan
    • India
    • South Korea
    • South-east Asia
    • Rest of Asia Pacific
  • Latin America
    • Brazil
    • Mexico
    • Rest of Latin America
  • Middle East & Africa
    • GCC Countries
    • South Africa
    • Rest of Middle East and Africa

1. Preface
1.1. Report Description
1.1.1. Purpose of the Report
1.1.2. Target Audience
1.1.3. USP and Key Offerings
1.2. Research Scope
1.3. Research Methodology
1.3.1. Phase I – Secondary Research
1.3.2. Phase II – Primary Research
1.3.3. Phase III – Expert Panel Review
1.3.4. Approach Adopted
1.3.4.1. Top-Down Approach
1.3.4.2. Bottom-Up Approach
1.3.5. Assumptions
1.4. Market Introduction
1.5. Market Research Scope

2. Executive Summary
2.1. Market Snapshot: Global WealthTech Solutions Market
2.2. Global WealthTech Solutions Market, By Component
2.3. Global WealthTech Solutions Market, By Enterprise Size
2.4. Global WealthTech Solutions Market, By Deployment Mode
2.5. Global WealthTech Solutions Market, By End User
2.6. Global WealthTech Solutions Market, By Region

3. Market Dynamics & Factors Analysis
3.1. Introduction
3.1.1. Global WealthTech Solutions Market Value, 2017-2030, (US$ Bn)
3.1.2. Y-o-Y Growth Trend Analysis
3.2. Market Dynamics
3.2.1. Market Drivers
3.2.2. Market Restraints
3.2.3. Market Opportunities
3.2.4. Major Industry Challenges
3.3. Growth and Development Patterns
3.4. Investment Feasibility Analysis
3.5. Market Opportunity Analysis
3.5.1. Component
3.5.2. Enterprise Size
3.5.3. Deployment Mode
3.5.4. End User
3.5.5. Geography

4. Premium Insights
4.1. STAR (Situation, Task, Action, Results) Analysis
4.2. Porter’s Five Forces Analysis
4.2.1. Threat of New Entrants
4.2.2. Bargaining Power of Buyers/Consumers
4.2.3. Bargaining Power of Suppliers
4.2.4. Threat of Substitute Types
4.2.5. Intensity of Competitive Rivalry
4.3. Key Market Trends
4.3.1. Demand Side Trends
4.3.2. Supply Side Trends
4.4. Value Chain Analysis
4.5. Technology Analysis
4.6. Analysis and Recommendations
4.7. Marketing Strategy Analysis
4.7.1. Direct Marketing
4.7.2. Indirect Marketing
4.7.3. Marketing Channel Development Trend

5. Market Positioning of Key Players, 2022
5.1. Company market share of key players, 2022
5.2. Competitive Benchmarking
5.3. Market Positioning of Key Vendors
5.4. Geographical Presence Analysis
5.5. Major Strategies Adopted by Key Players
5.5.1. Key Strategies Analysis
5.5.2. Mergers and Acquisitions
5.5.3. Partnerships
5.5.4. Product Launch
5.5.5. Geographical Expansion
5.5.6. Others

6. Economic Impact Analysis
6.1. Recession Impact
6.1.1. North America
6.1.2. Europe
6.1.3. Asia Pacific
6.1.4. Latin America
6.1.5. Middle East and Africa
6.2. Ukraine-Russia War Impact
6.2.1. North America
6.2.2. Europe
6.2.3. Asia Pacific
6.2.4. Latin America
6.2.5. Middle East and Africa
6.3. COVID-19 Impact Analysis
6.3.1. North America
6.3.2. Europe
6.3.3. Asia Pacific
6.3.4. Latin America
6.3.5. Middle East and Africa

7. Global WealthTech Solutions Market
7.1. Global WealthTech Solutions Market, by Component, 2017-2030(US$ Bn)
7.1.1. Overview
7.1.2. Global WealthTech Solutions Market, By Component, 2022 vs 2030 (in%)
7.1.3. Global WealthTech Solutions Market, By Solution, 2017-2030 (US$ Bn)
7.1.4. Global WealthTech Solutions Market, By Services, 2017-2030 (US$ Bn)
7.2. Global WealthTech Solutions Market, by Enterprise Size, 2017-2030(US$ Bn)
7.2.1. Overview
7.2.2. Global WealthTech Solutions Market, By Enterprise Size, 2022 vs 2030 (in%)
7.2.3. Global WealthTech Solutions Market, By Large Enterprises, 2017-2030 (US$ Bn)
7.2.4. Global WealthTech Solutions Market, By Small and Medium-sized Enterprises, 2017-2030 (US$ Bn)
7.3. Global WealthTech Solutions Market, by Deployment Mode, 2017-2030(US$ Bn)
7.3.1. Overview
7.3.2. Global WealthTech Solutions Market, By Deployment Mode, 2022 vs 2030 (in%)
7.3.3. Global WealthTech Solutions Market, By On-premise, 2017-2030 (US$ Bn)
7.3.4. Global WealthTech Solutions Market, By Cloud, 2017-2030 (US$ Bn)
7.4. Global WealthTech Solutions Market, by End User, 2017-2030(US$ Bn)
7.4.1. Overview
7.4.2. Global WealthTech Solutions Market, By End User, 2022 vs 2030 (in%)
7.4.3. Global WealthTech Solutions Market, By Banks, 2017-2030 (US$ Bn)
7.4.4. Global WealthTech Solutions Market, By Wealth Management Firms, 2017-2030 (US$ Bn)
7.4.5. Global WealthTech Solutions Market, By Others, 2017-2030 (US$ Bn)

8. North America WealthTech Solutions Market Analysis
8.1. North America WealthTech Solutions Market, by Component, 2017-2030(US$ Bn)
8.1.1. Overview
8.1.2. SRC Analysis
8.2. North America WealthTech Solutions Market, by Enterprise Size, 2017-2030(US$ Bn)
8.2.1. Overview
8.2.2. SRC Analysis
8.3. North America WealthTech Solutions Market, by Deployment Mode, 2017-2030(US$ Bn)
8.3.1. Overview
8.3.2. SRC Analysis
8.4. North America WealthTech Solutions Market, by End User, 2017-2030(US$ Bn)
8.4.1. Overview
8.4.2. SRC Analysis
8.5. North America WealthTech Solutions Market, by Country, 2017-2030 (US$ Bn)
8.5.1. U.S.
8.5.1.1. U.S. WealthTech Solutions Market Estimates and Forecast, 2017-2030 (US$ Bn)
8.5.1.2. U.S. WealthTech Solutions, By Component, 2017-2030 (US$ Bn)
8.5.1.3. U.S. WealthTech Solutions, By Enterprise Size, 2017-2030 (US$ Bn)
8.5.1.4. U.S. WealthTech Solutions, By Deployment Mode, 2017-2030 (US$ Bn)
8.5.1.5. U.S. WealthTech Solutions, By End User, 2017-2030 (US$ Bn)
8.5.2. Canada
8.5.2.1. Canada WealthTech Solutions Market Estimates and Forecast, 2017-2030 (US$ Bn)
8.5.2.2. Canada WealthTech Solutions, By Component, 2017-2030 (US$ Bn)
8.5.2.3. Canada WealthTech Solutions, By Enterprise Size, 2017-2030 (US$ Bn)
8.5.2.4. Canada WealthTech Solutions, By Deployment Mode, 2017-2030 (US$ Bn)
8.5.2.5. Canada WealthTech Solutions, By End User, 2017-2030 (US$ Bn)

9. Europe WealthTech Solutions Market Analysis
9.1. Europe WealthTech Solutions Market, by Component, 2017-2030(US$ Bn)
9.1.1. Overview
9.1.2. SRC Analysis
9.2. Europe WealthTech Solutions Market, by Enterprise Size, 2017-2030(US$ Bn)
9.2.1. Overview
9.2.2. SRC Analysis
9.3. Europe WealthTech Solutions Market, by Deployment Mode, 2017-2030(US$ Bn)
9.3.1. Overview
9.3.2. SRC Analysis
9.4. Europe WealthTech Solutions Market, by End User, 2017-2030(US$ Bn)
9.4.1. Overview
9.4.2. SRC Analysis
9.5. Europe WealthTech Solutions Market, by Country, 2017-2030 (US$ Bn)
9.5.1. Germany
9.5.1.1. Germany WealthTech Solutions Market Estimates and Forecast, 2017-2030 (US$ Bn)
9.5.1.2. Germany WealthTech Solutions, By Component, 2017-2030 (US$ Bn)
9.5.1.3. Germany WealthTech Solutions, By Enterprise Size, 2017-2030 (US$ Bn)
9.5.1.4. Germany WealthTech Solutions, By Deployment Mode, 2017-2030 (US$ Bn)
9.5.1.5. Germany WealthTech Solutions, By End User, 2017-2030 (US$ Bn)
9.5.2. France
9.5.2.1. France WealthTech Solutions Market Estimates and Forecast, 2017-2030 (US$ Bn)
9.5.2.2. France WealthTech Solutions, By Component, 2017-2030 (US$ Bn)
9.5.2.3. France WealthTech Solutions, By Enterprise Size, 2017-2030 (US$ Bn)
9.5.2.4. France WealthTech Solutions, By Deployment Mode, 2017-2030 (US$ Bn)
9.5.2.5. France WealthTech Solutions, By End User, 2017-2030 (US$ Bn)
9.5.3. UK
9.5.3.1. UK WealthTech Solutions Market Estimates and Forecast, 2017-2030 (US$ Bn)
9.5.3.2. UK WealthTech Solutions, By Component, 2017-2030 (US$ Bn)
9.5.3.3. UK WealthTech Solutions, By Enterprise Size, 2017-2030 (US$ Bn)
9.5.3.4. UK WealthTech Solutions, By Deployment Mode, 2017-2030 (US$ Bn)
9.5.3.5. UK WealthTech Solutions, By End User, 2017-2030 (US$ Bn)
9.5.4. Italy
9.5.4.1. Italy WealthTech Solutions Market Estimates and Forecast, 2017-2030 (US$ Bn)
9.5.4.2. Italy WealthTech Solutions, By Component, 2017-2030 (US$ Bn)
9.5.4.3. Italy WealthTech Solutions, By Enterprise Size, 2017-2030 (US$ Bn)
9.5.4.4. Italy WealthTech Solutions, By Deployment Mode, 2017-2030 (US$ Bn)
9.5.4.5. Italy WealthTech Solutions, By End User, 2017-2030 (US$ Bn)
9.5.5. Spain
9.5.5.1. Spain WealthTech Solutions Market Estimates and Forecast, 2017-2030 (US$ Bn)
9.5.5.2. Spain WealthTech Solutions, By Component, 2017-2030 (US$ Bn)
9.5.5.3. Spain WealthTech Solutions, By Enterprise Size, 2017-2030 (US$ Bn)
9.5.5.4. Spain WealthTech Solutions, By Deployment Mode, 2017-2030 (US$ Bn)
9.5.5.5. Spain WealthTech Solutions, By End User, 2017-2030 (US$ Bn)
9.5.6. Rest of Europe
9.5.6.1. Rest of Europe WealthTech Solutions Market Estimates and Forecast, 2017-2030 (US$ Bn)
9.5.6.2. Rest of Europe WealthTech Solutions, By Component, 2017-2030 (US$ Bn)
9.5.6.3. Rest of Europe WealthTech Solutions, By Enterprise Size, 2017-2030 (US$ Bn)
9.5.6.4. Rest of Europe WealthTech Solutions, By Deployment Mode, 2017-2030 (US$ Bn)
9.5.6.5. Rest of Europe WealthTech Solutions, By End User, 2017-2030 (US$ Bn)

10. Asia Pacific WealthTech Solutions Market Analysis
10.1. Asia Pacific WealthTech Solutions Market, by Component, 2017-2030(US$ Bn)
10.1.1. Overview
10.1.2. SRC Analysis
10.2. Asia Pacific WealthTech Solutions Market, by Enterprise Size, 2017-2030(US$ Bn)
10.2.1. Overview
10.2.2. SRC Analysis
10.3. Asia Pacific WealthTech Solutions Market, by Deployment Mode, 2017-2030(US$ Bn)
10.3.1. Overview
10.3.2. SRC Analysis
10.4. Asia Pacific WealthTech Solutions Market, by End User, 2017-2030(US$ Bn)
10.4.1. Overview
10.4.2. SRC Analysis
10.5. Asia Pacific WealthTech Solutions Market, by Country, 2017-2030 (US$ Bn)
10.5.1. China
10.5.1.1. China WealthTech Solutions Market Estimates and Forecast, 2017-2030 (US$ Bn)
10.5.1.2. China WealthTech Solutions, By Component, 2017-2030 (US$ Bn)
10.5.1.3. China WealthTech Solutions, By Enterprise Size, 2017-2030 (US$ Bn)
10.5.1.4. China WealthTech Solutions, By Deployment Mode, 2017-2030 (US$ Bn)
10.5.1.5. China WealthTech Solutions, By End User, 2017-2030 (US$ Bn)
10.5.2. Japan
10.5.2.1. Japan WealthTech Solutions Market Estimates and Forecast, 2017-2030 (US$ Bn)
10.5.2.2. Japan WealthTech Solutions, By Component, 2017-2030 (US$ Bn)
10.5.2.3. Japan WealthTech Solutions, By Enterprise Size, 2017-2030 (US$ Bn)
10.5.2.4. Japan WealthTech Solutions, By Deployment Mode, 2017-2030 (US$ Bn)
10.5.2.5. Japan WealthTech Solutions, By End User, 2017-2030 (US$ Bn)
10.5.3. India
10.5.3.1. India WealthTech Solutions Market Estimates and Forecast, 2017-2030 (US$ Bn)
10.5.3.2. India WealthTech Solutions, By Component, 2017-2030 (US$ Bn)
10.5.3.3. India WealthTech Solutions, By Enterprise Size, 2017-2030 (US$ Bn)
10.5.3.4. India WealthTech Solutions, By Deployment Mode, 2017-2030 (US$ Bn)
10.5.3.5. India WealthTech Solutions, By End User, 2017-2030 (US$ Bn)
10.5.4. South Korea
10.5.4.1. South Korea WealthTech Solutions Market Estimates and Forecast, 2017-2030 (US$ Bn)
10.5.4.2. South Korea WealthTech Solutions, By Component, 2017-2030 (US$ Bn)
10.5.4.3. South Korea WealthTech Solutions, By Enterprise Size, 2017-2030 (US$ Bn)
10.5.4.4. South Korea WealthTech Solutions, By Deployment Mode, 2017-2030 (US$ Bn)
10.5.4.5. South Korea WealthTech Solutions, By End User, 2017-2030 (US$ Bn)
10.5.5. South-East Asia
10.5.5.1. South-East Asia WealthTech Solutions Market Estimates and Forecast, 2017-2030 (US$ Bn)
10.5.5.2. South-East Asia WealthTech Solutions, By Component, 2017-2030 (US$ Bn)
10.5.5.3. South-East Asia WealthTech Solutions, By Enterprise Size, 2017-2030 (US$ Bn)
10.5.5.4. South-East Asia WealthTech Solutions, By Deployment Mode, 2017-2030 (US$ Bn)
10.5.5.5. South-East Asia WealthTech Solutions, By End User, 2017-2030 (US$ Bn)
10.5.6. Rest of Asia Pacific
10.5.6.1. Rest of Asia Pacific WealthTech Solutions Market Estimates and Forecast, 2017-2030 (US$ Bn)
10.5.6.2. Rest of Asia Pacific WealthTech Solutions, By Component, 2017-2030 (US$ Bn)
10.5.6.3. Rest of Asia Pacific WealthTech Solutions, By Enterprise Size, 2017-2030 (US$ Bn)
10.5.6.4. Rest of Asia Pacific WealthTech Solutions, By Deployment Mode, 2017-2030 (US$ Bn)
10.5.6.5. Rest of Asia Pacific WealthTech Solutions, By End User, 2017-2030 (US$ Bn)


11. Latin America WealthTech Solutions Market Analysis
11.1. Latin America WealthTech Solutions Market, by Component, 2017-2030(US$ Bn)
11.1.1. Overview
11.1.2. SRC Analysis
11.2. Latin America WealthTech Solutions Market, by Enterprise Size, 2017-2030(US$ Bn)
11.2.1. Overview
11.2.2. SRC Analysis
11.3. Latin America WealthTech Solutions Market, by Deployment Mode, 2017-2030(US$ Bn)
11.3.1. Overview
11.3.2. SRC Analysis
11.4. Latin America WealthTech Solutions Market, by End User, 2017-2030(US$ Bn)
11.4.1. Overview
11.4.2. SRC Analysis
11.5. Latin America WealthTech Solutions Market, by Country, 2017-2030 (US$ Bn)
11.5.1. Brazil
11.5.1.1. Brazil WealthTech Solutions Market Estimates and Forecast, 2017-2030 (US$ Bn)
11.5.1.2. Brazil WealthTech Solutions, By Component, 2017-2030 (US$ Bn)
11.5.1.3. Brazil WealthTech Solutions, By Enterprise Size, 2017-2030 (US$ Bn)
11.5.1.4. Brazil WealthTech Solutions, By Deployment Mode, 2017-2030 (US$ Bn)
11.5.1.5. Brazil WealthTech Solutions, By End User, 2017-2030 (US$ Bn)
11.5.2. Mexico
11.5.2.1. Mexico WealthTech Solutions Market Estimates and Forecast, 2017-2030 (US$ Bn)
11.5.2.2. Mexico WealthTech Solutions, By Component, 2017-2030 (US$ Bn)
11.5.2.3. Mexico WealthTech Solutions, By Enterprise Size, 2017-2030 (US$ Bn)
11.5.2.4. Mexico WealthTech Solutions, By Deployment Mode, 2017-2030 (US$ Bn)
11.5.2.5. Mexico WealthTech Solutions, By End User, 2017-2030 (US$ Bn)
11.5.3. Rest of Latin America
11.5.3.1. Rest of Latin America WealthTech Solutions Market Estimates and Forecast, 2017-2030 (US$ Bn)
11.5.3.2. Rest of Latin America WealthTech Solutions, By Component, 2017-2030 (US$ Bn)
11.5.3.3. Rest of Latin America WealthTech Solutions, By Enterprise Size, 2017-2030 (US$ Bn)
11.5.3.4. Rest of Latin America WealthTech Solutions, By Deployment Mode, 2017-2030 (US$ Bn)
11.5.3.5. Rest of Latin America WealthTech Solutions, By End User, 2017-2030 (US$ Bn)

12. Middle East and Africa WealthTech Solutions Market Analysis
12.1. Middle East and Africa WealthTech Solutions Market, by Component, 2017-2030(US$ Bn)
12.1.1. Overview
12.1.2. SRC Analysis
12.2. Middle East and Africa WealthTech Solutions Market, by Enterprise Size, 2017-2030(US$ Bn)
12.2.1. Overview
12.2.2. SRC Analysis
12.3. Middle East and Africa WealthTech Solutions Market, by Deployment Mode, 2017-2030(US$ Bn)
12.3.1. Overview
12.3.2. SRC Analysis
12.4. Middle East and Africa WealthTech Solutions Market, by End User, 2017-2030(US$ Bn)
12.4.1. Overview
12.4.2. SRC Analysis
12.5. Middle East and Africa WealthTech Solutions Market, by Country, 2017-2030 (US$ Bn)
12.5.1. GCC Countries
12.5.1.1. GCC Countries il WealthTech Solutions Market Estimates and Forecast, 2017-2030 (US$ Bn)
12.5.1.2. GCC Countries WealthTech Solutions, By Component, 2017-2030 (US$ Bn)
12.5.1.3. GCC Countries WealthTech Solutions, By Enterprise Size, 2017-2030 (US$ Bn)
12.5.1.4. GCC Countries WealthTech Solutions, By Deployment Mode, 2017-2030 (US$ Bn)
12.5.1.5. GCC Countries WealthTech Solutions, By End User, 2017-2030 (US$ Bn)
12.5.2. South Africa
12.5.2.1. South Africa WealthTech Solutions Market Estimates and Forecast, 2017-2030 (US$ Bn)
12.5.2.2. South Africa WealthTech Solutions, By Component, 2017-2030 (US$ Bn)
12.5.2.3. South Africa WealthTech Solutions, By Enterprise Size, 2017-2030 (US$ Bn)
12.5.2.4. South Africa WealthTech Solutions, By Deployment Mode, 2017-2030 (US$ Bn)
12.5.2.5. South Africa WealthTech Solutions, By End User, 2017-2030 (US$ Bn)
12.5.3. Rest of Middle East and Africa
12.5.3.1. Rest of Middle East and Africa WealthTech Solutions Market Estimates and Forecast, 2017-2030 (US$ Bn)
12.5.3.2. Rest of Middle East and Africa WealthTech Solutions, By Component, 2017-2030 (US$ Bn)
12.5.3.3. Rest of Middle East and Africa WealthTech Solutions, By Enterprise Size, 2017-2030 (US$ Bn)
12.5.3.4. Rest of Middle East and Africa WealthTech Solutions, By Deployment Mode, 2017-2030 (US$ Bn)
12.5.3.5. Rest of Middle East and Africa WealthTech Solutions, By End User, 2017-2030 (US$ Bn)

13. Company Profiles
13.1. Hologram (US)
13.1.1. Company Overview
13.1.2. Products/Services Portfolio
13.1.3. Geographical Presence
13.1.4. Financial Summary
13.1.4.1. Market Revenue and Net Profit (2019-2022)
13.1.4.2. Business Segment Revenue Analysis
13.1.4.3. Geographical Revenue Analysis
13.2. 3rd-eyes analytics
13.3. Aixigo AG
13.4. BlackRock, Inc.
13.5. BME inntech
13.6. InvestCloud, Inc.
13.7. InvestSuite
13.8. Valuefy
13.9. Wealthfront Corporation.
13.10. WealthTechs Inc.
13.11. Synechron

List of Figures
FIG. 1 Global WealthTech Solutions Market: Research Methodology
FIG. 2 Market Size Estimation – Top Down & Bottom up Approach
FIG. 3 Global WealthTech Solutions Market Segmentation
FIG. 4 Global WealthTech Solutions Market, by Component, 2022 (US$ Bn)
FIG. 5 Global WealthTech Solutions Market, by Enterprise Size, 2022 (US$ Bn)
FIG. 6 Global WealthTech Solutions Market, by Deployment Mode Type, 2022 (US$ Bn)
FIG. 7 Global WealthTech Solutions Market, by End User, 2022 (US$ Bn)
FIG. 8 Global WealthTech Solutions Market, by Geography, 2022 (US$ Bn)
FIG. 9 Attractive Investment Proposition, by Component, 2022
FIG. 10 Attractive Investment Proposition, by Enterprise Size, 2022
FIG. 11 Attractive Investment Proposition, by Deployment Mode Type, 2022
FIG. 12 Attractive Investment Proposition, by End User, 2022
FIG. 13 Attractive Investment Proposition, by Geography, 2022
FIG. 14 Global Market Share Analysis of Key WealthTech Solutions Market Manufacturers, 2022
FIG. 15 Global Market Positioning of Key WealthTech Solutions Market Manufacturers, 2022
FIG. 16 Global WealthTech Solutions Market Value Contribution, By Component, 2022 & 2030 (Value %)
FIG. 17 Global WealthTech Solutions Market, by Solution, Value, 2017-2030 (US$ Bn)
FIG. 18 Global WealthTech Solutions Market, by Services, Value, 2017-2030 (US$ Bn)
FIG. 19 Global WealthTech Solutions Market Value Contribution, By Enterprise Size, 2022 & 2030 (Value %)
FIG. 20 Global WealthTech Solutions Market, by Large Enterprises, Value, 2017-2030 (US$ Bn)
FIG. 21 Global WealthTech Solutions Market, by SMEs, Value, 2017-2030 (US$ Bn)
FIG. 22 Global WealthTech Solutions Market Value Contribution, By Deployment Mode, 2022 & 2030 (Value %)
FIG. 23 Global WealthTech Solutions Market, by On-premise, Value, 2017-2030 (US$ Bn)
FIG. 24 Global WealthTech Solutions Market, by Cloud, Value, 2017-2030 (US$ Bn)
FIG. 25 Global WealthTech Solutions Market Value Contribution, By End User, 2022 & 2030 (Value %)
FIG. 26 Global WealthTech Solutions Market, by Banks, Value, 2017-2030 (US$ Bn)
FIG. 27 Global WealthTech Solutions Market, by Wealth Management Firms, Value, 2017-2030 (US$ Bn)
FIG. 28 Global WealthTech Solutions Market, by Others, Value, 2017-2030 (US$ Bn)
FIG. 29 U.S. WealthTech Solutions Market, 2017-2030 (US$ Bn)
FIG. 30 Canada WealthTech Solutions Market, 2017-2030 (US$ Bn)
FIG. 31 Germany WealthTech Solutions Market, 2017-2030 (US$ Bn)
FIG. 32 France WealthTech Solutions Market, 2017-2030 (US$ Bn)
FIG. 33 U.K. WealthTech Solutions Market, 2017-2030 (US$ Bn)
FIG. 34 Italy WealthTech Solutions Market, 2017-2030 (US$ Bn)
FIG. 35 Spain WealthTech Solutions Market, 2017-2030 (US$ Bn)
FIG. 36 Rest of Europe WealthTech Solutions Market, 2017-2030 (US$ Bn)
FIG. 37 China WealthTech Solutions Market, 2017-2030 (US$ Bn)
FIG. 38 Japan WealthTech Solutions Market, 2017-2030 (US$ Bn)
FIG. 39 India WealthTech Solutions Market, 2017-2030 (US$ Bn)
FIG. 40 South Korea WealthTech Solutions Market, 2017-2030 (US$ Bn)
FIG. 41 Southeast Asia WealthTech Solutions Market, 2017-2030 (US$ Bn)
FIG. 42 Rest of Asia Pacific WealthTech Solutions Market, 2017-2030 (US$ Bn)
FIG. 43 Latin America WealthTech Solutions Market, 2017-2030 (US$ Bn)
FIG. 44 Brazil WealthTech Solutions Market, 2017-2030 (US$ Bn)
FIG. 45 Mexico WealthTech Solutions Market, 2017-2030 (US$ Bn)
FIG. 46 Rest of Latin America WealthTech Solutions Market, 2017-2030 (US$ Bn)
FIG. 47 Middle East & Africa WealthTech Solutions Market, 2017-2030 (US$ Bn)
FIG. 48 GCC Countries WealthTech Solutions Market, 2017-2030 (US$ Bn)
FIG. 49 South Africa WealthTech Solutions Market, 2017-2030 (US$ Bn)
FIG. 50 Rest of Middle East and Africa WealthTech Solutions Market, 2017-2030 (US$ Bn)

List of Tables
TABLE 1 Market Snapshot: Global WealthTech Solutions Market
TABLE 2 Global WealthTech Solutions Market, by Competitive Benchmarking, 2022
TABLE 3 Global WealthTech Solutions Market, by Geographical Presence Analysis, 2022
TABLE 4 Global WealthTech Solutions Market, by Key Strategies Analysis, 2022
TABLE 5 Global WealthTech Solutions Market, by Component, 2017-2030 (US$ Bn)
TABLE 6 Global WealthTech Solutions Market, by Enterprise Size, 2017-2030 (US$ Bn)
TABLE 7 Global WealthTech Solutions Market, by Deployment Mode, 2017-2030 (US$ Bn)
TABLE 8 Global WealthTech Solutions Market, by End User, 2017-2030 (US$ Bn)
TABLE 9 Global WealthTech Solutions Market, by Geography, 2017-2030 (US$ Bn)
TABLE 10 North America WealthTech Solutions Market, by Component, 2017-2030 (US$ Bn)
TABLE 11 North America WealthTech Solutions Market, by Enterprise Size, 2017-2030 (US$ Bn)
TABLE 12 North America WealthTech Solutions Market, by Deployment Mode, 2017-2030 (US$ Bn)
TABLE 13 North America WealthTech Solutions Market, by End User, 2017-2030 (US$ Bn)
TABLE 14 North America WealthTech Solutions Market, by Country, 2017-2030 (US$ Bn)
TABLE 15 US WealthTech Solutions Market, by Component, 2017-2030 (US$ Bn)
TABLE 16 US WealthTech Solutions Market, by Enterprise Size, 2017-2030 (US$ Bn)
TABLE 17 US WealthTech Solutions Market, by Deployment Mode, 2017-2030 (US$ Bn)
TABLE 18 US WealthTech Solutions Market, by End User, 2017-2030 (US$ Bn)
TABLE 19 Canada WealthTech Solutions Market, by Component, 2017-2030 (US$ Bn)
TABLE 20 Canada WealthTech Solutions Market, by Enterprise Size, 2017-2030 (US$ Bn)
TABLE 21 Canada WealthTech Solutions Market, by Deployment Mode, 2017-2030 (US$ Bn)
TABLE 22 Canada WealthTech Solutions Market, by End User, 2017-2030 (US$ Bn)
TABLE 23 Europe WealthTech Solutions Market, by Component, 2017-2030 (US$ Bn)
TABLE 24 Europe WealthTech Solutions Market, by Enterprise Size, 2017-2030 (US$ Bn)
TABLE 25 Europe WealthTech Solutions Market, by Deployment Mode, 2017-2030 (US$ Bn)
TABLE 26 Europe WealthTech Solutions Market, by End User, 2017-2030 (US$ Bn)
TABLE 27 Europe WealthTech Solutions Market, by Country, 2017-2030 (US$ Bn)
TABLE 28 Germany WealthTech Solutions Market, by Component, 2017-2030 (US$ Bn)
TABLE 29 Germany WealthTech Solutions Market, by Enterprise Size, 2017-2030 (US$ Bn)
TABLE 30 Germany WealthTech Solutions Market, by Deployment Mode, 2017-2030 (US$ Bn)
TABLE 31 Germany WealthTech Solutions Market, by End User, 2017-2030 (US$ Bn)
TABLE 32 France WealthTech Solutions Market, by Component, 2017-2030 (US$ Bn)
TABLE 33 France WealthTech Solutions Market, by Enterprise Size, 2017-2030 (US$ Bn)
TABLE 34 France WealthTech Solutions Market, by Deployment Mode, 2017-2030 (US$ Bn)
TABLE 35 France WealthTech Solutions Market, by End User, 2017-2030 (US$ Bn)
TABLE 36 UK WealthTech Solutions Market, by Component, 2017-2030 (US$ Bn)
TABLE 37 UK WealthTech Solutions Market, by Enterprise Size, 2017-2030 (US$ Bn)
TABLE 38 UK WealthTech Solutions Market, by Deployment Mode, 2017-2030 (US$ Bn)
TABLE 39 UK WealthTech Solutions Market, by End User, 2017-2030 (US$ Bn)
TABLE 40 Italy WealthTech Solutions Market, by Component, 2017-2030 (US$ Bn)
TABLE 41 Italy WealthTech Solutions Market, by Enterprise Size, 2017-2030 (US$ Bn)
TABLE 42 Italy WealthTech Solutions Market, by Deployment Mode, 2017-2030 (US$ Bn)
TABLE 43 Italy WealthTech Solutions Market, by End User, 2017-2030 (US$ Bn)
TABLE 44 Spain WealthTech Solutions Market, by Component, 2017-2030 (US$ Bn)
TABLE 45 Spain WealthTech Solutions Market, by Enterprise Size, 2017-2030 (US$ Bn)
TABLE 46 Spain WealthTech Solutions Market, by Deployment Mode, 2017-2030 (US$ Bn)
TABLE 47 Spain WealthTech Solutions Market, by End User, 2017-2030 (US$ Bn)
TABLE 48 Rest of Europe WealthTech Solutions Market, by Component, 2017-2030 (US$ Bn)
TABLE 49 Rest of Europe WealthTech Solutions Market, by Enterprise Size, 2017-2030 (US$ Bn)
TABLE 50 Rest of Europe WealthTech Solutions Market, by Deployment Mode, 2017-2030 (US$ Bn)
TABLE 51 Rest of Europe WealthTech Solutions Market, by End User, 2017-2030 (US$ Bn)
TABLE 52 Asia Pacific WealthTech Solutions Market, by Component, 2017-2030 (US$ Bn)
TABLE 53 Asia Pacific WealthTech Solutions Market, by Enterprise Size, 2017-2030 (US$ Bn)
TABLE 54 Asia Pacific WealthTech Solutions Market, by Deployment Mode, 2017-2030 (US$ Bn)
TABLE 55 Asia Pacific WealthTech Solutions Market, by End User, 2017-2030 (US$ Bn)
TABLE 56 Asia Pacific WealthTech Solutions Market, by Country, 2017-2030 (US$ Bn)
TABLE 57 China WealthTech Solutions Market, by Component, 2017-2030 (US$ Bn)
TABLE 58 China WealthTech Solutions Market, by Enterprise Size, 2017-2030 (US$ Bn)
TABLE 59 China WealthTech Solutions Market, by Deployment Mode, 2017-2030 (US$ Bn)
TABLE 60 China WealthTech Solutions Market, by End User, 2017-2030 (US$ Bn)
TABLE 61 Japan WealthTech Solutions Market, by Component, 2017-2030 (US$ Bn)
TABLE 62 Japan WealthTech Solutions Market, by Enterprise Size, 2017-2030 (US$ Bn)
TABLE 63 Japan WealthTech Solutions Market, by Deployment Mode, 2017-2030 (US$ Bn)
TABLE 64 Japan WealthTech Solutions Market, by End User, 2017-2030 (US$ Bn)
TABLE 65 India WealthTech Solutions Market, by Component, 2017-2030 (US$ Bn)
TABLE 66 India WealthTech Solutions Market, by Enterprise Size, 2017-2030 (US$ Bn)
TABLE 67 India WealthTech Solutions Market, by Deployment Mode, 2017-2030 (US$ Bn)
TABLE 68 India WealthTech Solutions Market, by End User, 2017-2030 (US$ Bn)
TABLE 69 South Korea WealthTech Solutions Market, by Component, 2017-2030 (US$ Bn)
TABLE 70 South Korea WealthTech Solutions Market, by Enterprise Size, 2017-2030 (US$ Bn)
TABLE 71 South Korea WealthTech Solutions Market, by Deployment Mode, 2017-2030 (US$ Bn)
TABLE 72 South Korea WealthTech Solutions Market, by End User, 2017-2030 (US$ Bn)
TABLE 73 South East Asia WealthTech Solutions Market, by Component, 2017-2030 (US$ Bn)
TABLE 74 South East Asia WealthTech Solutions Market, by Enterprise Size, 2017-2030 (US$ Bn)
TABLE 75 South East Asia WealthTech Solutions Market, by Deployment Mode, 2017-2030 (US$ Bn)
TABLE 76 South East Asia WealthTech Solutions Market, by End User, 2017-2030 (US$ Bn)
TABLE 77 Rest of Asia Pacific WealthTech Solutions Market, by Component, 2017-2030 (US$ Bn)
TABLE 78 Rest of Asia Pacific WealthTech Solutions Market, by Enterprise Size, 2017-2030 (US$ Bn)
TABLE 79 Rest of Asia Pacific WealthTech Solutions Market, by Deployment Mode, 2017-2030 (US$ Bn)
TABLE 80 Rest of Asia Pacific WealthTech Solutions Market, by End User, 2017-2030 (US$ Bn)
TABLE 81 Latin America WealthTech Solutions Market, by Component, 2017-2030 (US$ Bn)
TABLE 82 Latin America WealthTech Solutions Market, by Enterprise Size, 2017-2030 (US$ Bn)
TABLE 83 Latin America WealthTech Solutions Market, by Deployment Mode, 2017-2030 (US$ Bn)
TABLE 84 Latin America WealthTech Solutions Market, by End User, 2017-2030 (US$ Bn)
TABLE 85 Latin America WealthTech Solutions Market, by Country, 2017-2030 (US$ Bn)
TABLE 86 Brazil WealthTech Solutions Market, by Component, 2017-2030 (US$ Bn)
TABLE 87 Brazil WealthTech Solutions Market, by Enterprise Size, 2017-2030 (US$ Bn)
TABLE 88 Brazil WealthTech Solutions Market, by Deployment Mode, 2017-2030 (US$ Bn)
TABLE 89 Brazil WealthTech Solutions Market, by End User, 2017-2030 (US$ Bn)
TABLE 90 Mexico WealthTech Solutions Market, by Component, 2017-2030 (US$ Bn)
TABLE 91 Mexico WealthTech Solutions Market, by Enterprise Size, 2017-2030 (US$ Bn)
TABLE 92 Mexico WealthTech Solutions Market, by Deployment Mode, 2017-2030 (US$ Bn)
TABLE 93 Mexico WealthTech Solutions Market, by End User, 2017-2030 (US$ Bn)
TABLE 94 Rest of Latin America WealthTech Solutions Market, by Component, 2017-2030 (US$ Bn)
TABLE 95 Rest of Latin America WealthTech Solutions Market, by Enterprise Size, 2017-2030 (US$ Bn)
TABLE 96 Rest of Latin America WealthTech Solutions Market, by Deployment Mode, 2017-2030 (US$ Bn)
TABLE 97 Rest of Latin America WealthTech Solutions Market, by End User, 2017-2030 (US$ Bn)
TABLE 98 Middle East and Africa WealthTech Solutions Market, by Component, 2017-2030 (US$ Bn)
TABLE 99 Middle East and Africa WealthTech Solutions Market, by Enterprise Size, 2017-2030 (US$ Bn)
TABLE 100 Middle East and Africa WealthTech Solutions Market, by Deployment Mode, 2017-2030 (US$ Bn)
TABLE 101 Middle East and Africa WealthTech Solutions Market, by End User, 2017-2030 (US$ Bn)
TABLE 102 Middle East and Africa WealthTech Solutions Market, by Country, 2017-2030 (US$ Bn)
TABLE 103 GCC Countries WealthTech Solutions Market, by Component, 2017-2030 (US$ Bn)
TABLE 104 GCC Countries WealthTech Solutions Market, by Enterprise Size, 2017-2030 (US$ Bn)
TABLE 105 GCC Countries WealthTech Solutions Market, by Deployment Mode, 2017-2030 (US$ Bn)
TABLE 106 GCC Countries WealthTech Solutions Market, by End User, 2017-2030 (US$ Bn)
TABLE 107 South Africa WealthTech Solutions Market, by Component, 2017-2030 (US$ Bn)
TABLE 108 South Africa WealthTech Solutions Market, by Enterprise Size, 2017-2030 (US$ Bn)
TABLE 109 South Africa WealthTech Solutions Market, by Deployment Mode, 2017-2030 (US$ Bn)
TABLE 110 South Africa WealthTech Solutions Market, by End User, 2017-2030 (US$ Bn)
TABLE 111 Rest of Middle East and Africa WealthTech Solutions Market, by Component, 2017-2030 (US$ Bn)
TABLE 112 Rest of Middle East and Africa WealthTech Solutions Market, by Enterprise Size, 2017-2030 (US$ Bn)
TABLE 113 Rest of Middle East and Africa WealthTech Solutions Market, by Deployment Mode, 2017-2030 (US$ Bn)
TABLE 114 Rest of Middle East and Africa WealthTech Solutions Market, by End User, 2017-2030 (US$ Bn)

Frequently asked questions

How does COVID-19 Impact the global wealth tech solutions market?

The COVID-19 pandemic has negatively impacted the growth of the global wealth tech solutions market, owing to huge losses incurred by firms due to business interruptions in various industry verticals due to lockdowns worldwide.

Which is the leading region of the market for wealth tech solutions?

North America accounted for the most heightened share in the global wealth tech solutions market.

What are the key drivers for the growth of the wealth tech solutions market?

The rise in the use of AI-based assistance in banks, wealth management firms, and investment firms and the adoption of new advisor technology drive the wealth tech solutions market.

Which is the major segment in the wealth tech solutions market by deployment mode?

The on-premise segment had a major share in the global market in 2022.

Which is the major segment in the wealth tech solutions market by enterprise size?

The large enterprise segment had a major share in the global market.

Saudi Arabia Managed Security Services Market

Published:
Report ID: 36393

Microwave Oven Market

Published:
Report ID: 36314

Inkjet Coders Market

Published:
Report ID: 6669

Rich Communication Services Market

Published:
Report ID: 35774

Middle East and Africa Real-Time Payments Market

Published:
Report ID: 35770

Vietnam Managed Security Services (MSS) Market

Published:
Report ID: 35766

Middle East and Africa EdTech and Smart Classroom Market

Published:
Report ID: 35756

Digital Business Support System (DBSS) Market

Published:
Report ID: 35732

China Artificial Intelligence (AI) Market

Published:
Report ID: 35729

Asia-Pacific Workforce Management Software Market

Published:
Report ID: 35719

Mobile Wallet Market

Published:
Report ID: 8977

Recirculating Chillers Market

Published:
Report ID: 8862

Purchase Options

$2999
Delivery Format: Excel.
$4999
Designed for the individual purchaser.
$6999
Users located at a single corporate site or regional office.
$7999
Allowed for unlimited sharing globally within one company.
Smallform of Sample request

Have a question?

User Profile

Don’t settle for less – trust Mitul to help you find the best solution.

Report delivery within 24 to 48 hours

– Other Info –

What people say?-

User Review

I am very impressed with the information in this report. The author clearly did their research when they came up with this product and it has already given me a lot of ideas.

Jana Schmidt
CEDAR CX Technologies

– Connect with us –

Phone

+91 6232 49 3207


support

24/7 Research Support


sales@credenceresearch.com

– Research Methodology –

Going beyond the basics: advanced techniques in research methodology

– Trusted By –

Pepshi, LG, Nestle
Motorola, Honeywell, Johnson and johnson
LG Chem, SIEMENS, Pfizer
Unilever, Samsonite, QIAGEN