
Market Overview
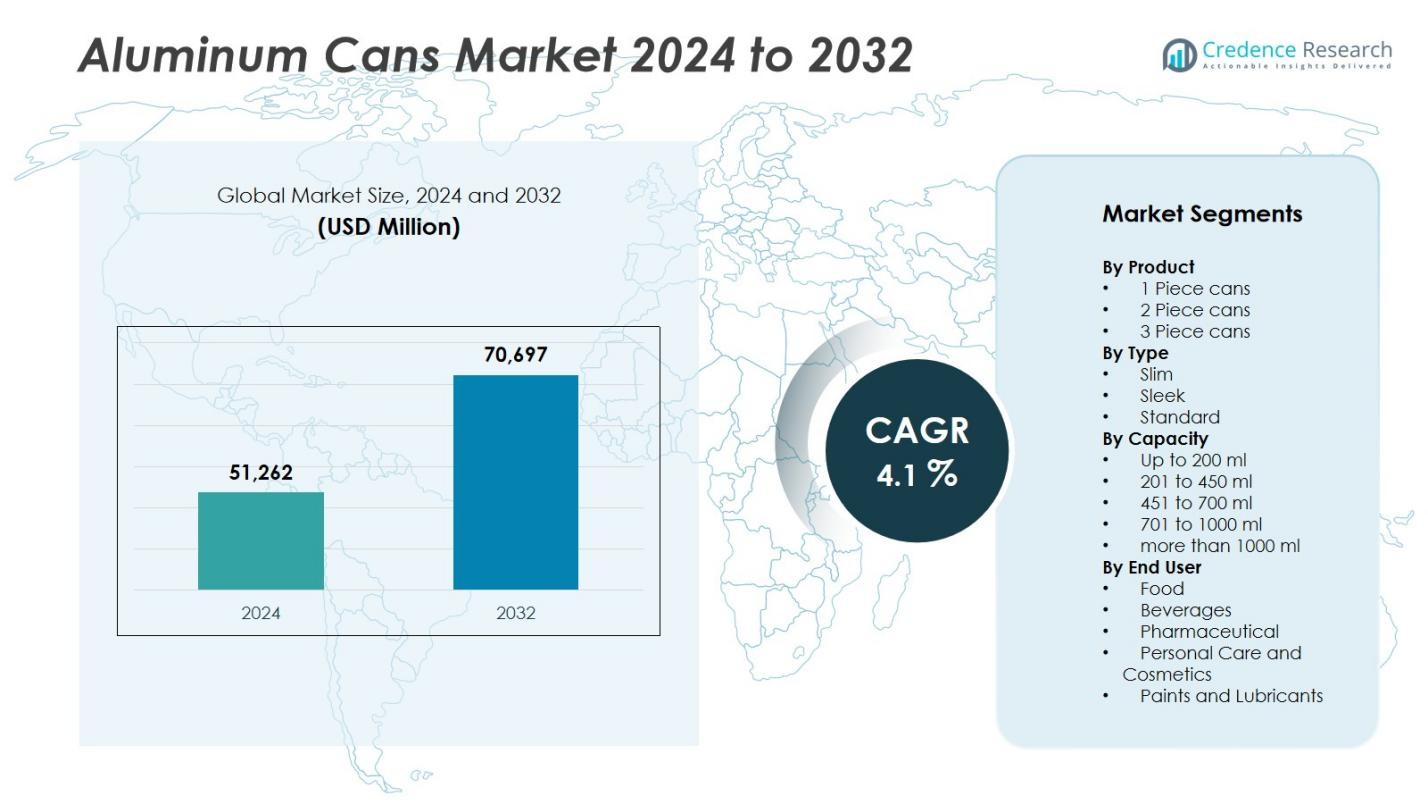
The Aluminum cans market size was valued at USD 51,262 million in 2024 and is anticipated to reach USD 70,697 million by 2032, growing at a CAGR of 4.1% during the forecast period.
| REPORT ATTRIBUTE | DETAILS |
|---|---|
| Historical Period | 2020-2023 |
| Base Year | 2024 |
| Forecast Period | 2025-2032 |
| Aluminum cans Market Size 2024 | USD 51,262 Million |
| Aluminum cans Market, CAGR | 4.1% |
| Aluminum cans Market Size 2032 | USD 70,697 Million |
The aluminum cans market is dominated by major global players such as Ball Corporation, Crown Holdings, Ardagh Group, CANPACK, Toyo Seikan, Silgan Holdings, CCL Industries, Showa Aluminum Can Corporation, Can-Pack S.A., and Envases Group. These companies emphasize innovation, sustainability, and regional expansion to enhance competitiveness. Strategic initiatives include lightweight product development, high-recycled-content cans, and automation investments to meet evolving environmental and consumer demands. North America leads the global aluminum cans market with a 33% share, driven by strong beverage consumption, advanced recycling systems, and the presence of leading manufacturers. Europe and Asia-Pacific closely follow, supported by robust production infrastructure and rising demand for sustainable packaging solutions.
Market Insights
• The aluminum cans market was valued at USD 51,262 million in 2024 and is projected to reach USD 70,697 million by 2032, growing at a CAGR of 4.1% during the forecast period. • Rising beverage consumption and the global shift toward sustainable, recyclable packaging are driving steady market growth, supported by government initiatives promoting circular economy practices. • Premiumization trends, design innovations such as slim and sleek cans, and the use of lightweight alloys are reshaping product demand across beverage and personal care applications. • Leading companies including Ball Corporation, Crown Holdings, and Ardagh Group focus on capacity expansion, technological upgrades, and partnerships to strengthen market presence amid fluctuating aluminum prices. • North America leads with 33% market share, followed by Europe at 28% and Asia-Pacific at 27%, while the 2-piece can segment dominates with 65% share, driven by efficiency, recyclability, and widespread use in beverage packaging.
Market Segmentation Analysis:
By Product:
The 2-piece cans segment dominated the aluminum cans market in 2024, accounting for 65% of the total share. This dominance is attributed to their lightweight structure, cost efficiency, and superior sealing performance, which make them ideal for high-volume beverage packaging, particularly for carbonated soft drinks and beer. The seamless body design enhances durability and prevents leakage, reducing material waste during production. Increasing automation in can-forming processes and rising beverage consumption across emerging economies further strengthen the demand for 2-piece aluminum cans. • For instance, Ball Corporation implemented automated production lines capable of producing millions of 12-ounce cans daily, emphasizing durability and recyclability in their designs.
By Type:
The standard can segment held the largest share of 58% in 2024, driven by its extensive use in mainstream beverage packaging such as soft drinks, energy drinks, and ready-to-drink teas. Its widespread acceptance stems from production efficiency, stackability, and compatibility with existing filling lines. Although slim and sleek cans are gaining traction among health-conscious and premium beverage brands, standard cans continue to dominate due to their lower production costs and ease of transportation across global distribution networks. • For instance, Ball Corporation showcased their aluminum cans in multiple sizes like 6.8 oz and 8.4 oz at the BevNET Live Summer 2023 event, emphasizing their broad adoption across beverage categories.
By Capacity:
The 201 to 450 ml capacity segment led the aluminum cans market in 2024, capturing 60% of total volume share. This range is preferred by beverage manufacturers for single-serving soft drinks, beer, and energy drinks, aligning with consumer demand for convenient and portable packaging. The segment’s growth is further supported by the expanding ready-to-drink beverage sector and on-the-go consumption trends. Moreover, manufacturers favor this capacity due to optimized material usage and filling efficiency, ensuring cost-effective production and minimal environmental footprint.
Key Growth Drivers
Rising Beverage Consumption and Sustainability Shift Increasing global demand for ready-to-drink beverages, including soft drinks, beer, and energy drinks, is a primary growth driver for the aluminum cans market. Consumers and brands are favoring aluminum cans due to their 100% recyclability and lower environmental footprint compared to plastic packaging. The circular economy initiatives by major beverage companies and government mandates on sustainable packaging further boost can production, encouraging manufacturers to invest in lightweight designs and advanced recycling infrastructure. • For instance, Heineken's Lagunitas Brewing Company launched limited-edition craft beers in aluminum cans to preserve flavor while promoting portability and sustainability.
Advancements in Can Manufacturing Technology
Continuous innovation in forming, coating, and printing technologies enhances the appeal and functionality of aluminum cans. New digital printing and shaping techniques allow for improved design flexibility and faster customization, enabling brands to differentiate their products. Automation and robotics integration in production lines have increased efficiency and reduced manufacturing costs. These advancements contribute to higher production output and better material utilization, strengthening market competitiveness and sustainability across the global packaging industry. • For instance, Orora has introduced Helio, Australia's first digital direct-to-can printing system, capable of producing photorealistic, full-color designs at speeds of up to 500 cans per minute, enabling premium customization without raising costs.
Expanding Demand from Food and Personal Care Sectors Beyond beverages, aluminum cans are increasingly used in packaging food products, aerosol sprays, and personal care items due to their durability and ability to preserve product freshness. Their resistance to light, air, and moisture extends shelf life, appealing to both manufacturers and consumers. Growing demand for convenient and safe packaging in processed foods and cosmetics is expanding market reach. This diversification across end-use industries enhances the overall resilience and profitability of the aluminum cans market.
Key Trends & Opportunities
Premiumization and Design Innovation
Brands are increasingly adopting sleek and slim aluminum cans to cater to modern consumer preferences for premium and aesthetically appealing packaging. This trend is prominent in energy drinks, craft beers, and functional beverages, where visual appeal influences purchasing decisions. Enhanced design capabilities, including embossing and color-changing inks, allow companies to create unique branding experiences. This premiumization trend presents opportunities for manufacturers to target niche and high-margin beverage categories. • For instance, Fanta partnered with Ball Corporation to launch a mystery-flavored beverage in aluminum cans featuring a 5D sipping experience and unique color-changing labels that intensify flavor and transform visually as the can cools.
Rising Focus on Lightweight and Recycled Material Use Manufacturers are investing in lightweight aluminum alloys and higher recycled content to meet sustainability targets and reduce production costs. The shift toward closed-loop recycling systems ensures a continuous material supply with minimal environmental impact. This trend aligns with global environmental regulations and corporate ESG goals, creating opportunities for suppliers offering sustainable can materials. The adoption of eco-efficient production technologies positions aluminum cans as a preferred packaging solution for environmentally conscious brands. • For instance, Ball Corporation produces aluminum cans with an average recycled content of around 71%, supporting eco-efficient packaging solutions.
Key Challenges
Volatility in Raw Material Prices
Fluctuating aluminum prices remain a major concern for can manufacturers, as raw material costs account for a significant portion of production expenses. Market volatility influenced by energy costs, trade policies, and global demand fluctuations directly impacts profit margins. Manufacturers face challenges in maintaining price stability and long-term supply contracts. To mitigate this, companies are focusing on recycling initiatives and local sourcing strategies to reduce dependence on primary aluminum production.
Competition from Alternative Packaging Materials
Despite its recyclability, aluminum packaging faces competition from plastic, glass, and paper-based alternatives that offer lower costs or specialized features. Innovations in biodegradable plastics and flexible pouches are appealing to beverage and food producers seeking cost-effective solutions. This trend challenges aluminum can manufacturers to continuously enhance product design, reduce material usage, and improve sustainability credentials to retain their market share in an increasingly diversified packaging landscape.
Regional Analysis
North America
North America held the largest share of 33% of the global aluminum cans market in 2024, driven by high consumption of carbonated beverages, energy drinks, and beer. The United States dominates regional demand due to strong recycling infrastructure and sustainability initiatives by leading beverage companies. Consumer preference for eco-friendly and lightweight packaging further supports market growth. Additionally, technological advancements in can manufacturing and partnerships between can makers and beverage brands are reinforcing the region’s position as a key hub for aluminum packaging innovation.
Europe
Europe accounted for 28% of the global market share in 2024, supported by stringent EU regulations promoting recycling and sustainable packaging. The region’s well-established beverage industry, particularly in countries like Germany, the UK, and France, drives steady demand for aluminum cans. European consumers’ environmental awareness and growing preference for metal over plastic packaging have accelerated adoption. Continuous investments in closed-loop recycling systems and lightweight can designs by manufacturers further enhance market competitiveness and contribute to Europe’s leadership in sustainable packaging solutions.
Asia-Pacific
Asia-Pacific captured 27% of the aluminum cans market share in 2024, emerging as the fastest-growing region due to expanding beverage consumption and rapid urbanization. China, Japan, and India are major contributors, with rising demand for energy drinks, beer, and soft drinks. Increasing disposable income and Westernized lifestyles are fueling market expansion. Government efforts to promote recycling and sustainable packaging also support growth. Moreover, the presence of large-scale can production facilities and growing investments from global players strengthen Asia-Pacific’s role as a major manufacturing and export base.
Latin America
Latin America held a market share of about 7% in 2024, with growth primarily driven by Brazil and Mexico. The increasing popularity of canned beverages and expansion of local breweries are boosting aluminum can demand. Manufacturers are investing in regional production facilities to meet rising consumption and reduce import dependence. Economic recovery and the shift toward recyclable packaging options further stimulate market development. However, fluctuating raw material prices and limited recycling infrastructure in some areas pose minor constraints to long-term growth prospects in the region.
Middle East & Africa
The Middle East & Africa accounted for 5% of the global aluminum cans market in 2024, supported by increasing beverage production and growing consumer preference for sustainable packaging. Countries such as the UAE, Saudi Arabia, and South Africa are leading adopters due to expanding soft drink and energy drink industries. Investments in recycling initiatives and local can manufacturing facilities are improving regional supply capabilities. Although market penetration remains lower than in other regions, rising urbanization and modern retail growth are expected to strengthen future demand for aluminum cans.
Market Segmentations:
By Product
- 1 Piece cans
- Piece cans
- Piece cans
By Type
- Slim
- Sleek
- Standard
By Capacity
- Up to 200 ml
- 201 to 450 ml
- 451 to 700 ml
- 701 to 1000 ml
- more than 1000 ml
By End User
- Food
- Beverages
- Pharmaceutical
- Personal Care and Cosmetics
By Region
- North America
- U.S.
- Canada
- Mexico
- Europe
- Germany
- France
- U.K.
- Italy
- Spain
- Rest of Europe
- Asia Pacific
- China
- Japan
- India
- South Korea
- South-east Asia
- Rest of Asia Pacific
- Latin America
- Brazil
- Argentina
- Rest of Latin America
- Middle East & Africa
- GCC Countries
- South Africa
- Rest of the Middle East and Africa
Competitive Landscape
The competitive landscape of the aluminum cans market is characterized by the presence of major global players such as Ball Corporation, Crown Holdings, Ardagh Group, CANPACK, Toyo Seikan, Silgan Holdings, CCL Industries, Showa Aluminum Can Corporation, Can-Pack S.A., and Envases Group. These companies focus on capacity expansion, strategic partnerships, and technological innovation to strengthen their market position. Leading manufacturers are investing in lightweight materials, digital printing, and high-recycled-content cans to meet sustainability goals and enhance product differentiation. Mergers and acquisitions are also reshaping the industry, enabling global players to expand regional presence and operational efficiency. Continuous R&D initiatives toward improving recyclability and reducing production costs further enhance competitiveness. Additionally, the growing shift toward premium and customized packaging solutions is prompting key players to collaborate closely with beverage brands, driving long-term market consolidation and sustainable growth across major geographies.
Key Player Analysis
• Ardagh Group • Ball Corporation • CANPACK • Crown Holdings • CCL Industries • Envases Group • Showa Aluminum Can Corporation • Silgan Holdings • Can-Pack S.A. • Toyo Seikan
Recent Developments
• In December 2024, Ball Corporation, in partnership with Dabur, launched Réal Bites fruit juices in sleek, single-serve aluminum cans. These new cans not only offer extended shelf-life and portability but also appeal to eco-conscious urban youth. • In December 2024, Dabur partnered with Ball Corporation for recyclable aluminum cans in the Indian market, offering a sustainable and innovative way to enjoy juices. • In August 2024, AkzoNobel unveiled Accelshield™ 300, the next-generation internal coating technology for aluminium cans. • In May 2024, Estathé®, an iconic Italian tea leaf beverage produced by Ferrero Group, partnered with Crown to launch a summer promotion in a 330ml “Sleek” format aluminum can. The partnership between Crown and Ferrero also leverages a sustainable container that supports the circular economy, thanks to aluminum’s ability to be recycled endlessly.
Report Coverage
The research report offers an in-depth analysis based on Product, Type, Capacity, End User and Region. It details leading market players, providing an overview of their business, product offerings, investments, revenue streams, and key applications. Additionally, the report includes insights into the competitive environment, SWOT analysis, current market trends, as well as the primary drivers and constraints. Furthermore, it discusses various factors that have driven market expansion in recent years. The report also explores market dynamics, regulatory scenarios, and technological advancements that are shaping the industry. It assesses the impact of external factors and global economic changes on market growth. Lastly, it provides strategic recommendations for new entrants and established companies to navigate the complexities of the market.
Future Outlook
1. The aluminum cans market is expected to witness steady growth driven by rising global beverage consumption and sustainability commitments. 2. Increasing adoption of recyclable and lightweight packaging will strengthen aluminum cans’ position over plastic alternatives. 3. Technological advancements in digital printing and can-forming processes will enhance customization and design flexibility. 4. Expanding use of aluminum cans in food, personal care, and household products will diversify market applications. 5. Strategic collaborations between can manufacturers and beverage brands will boost innovation and production capacity. 6. Government regulations promoting circular economy practices will accelerate the use of recycled aluminum in packaging. 7. Emerging economies in Asia-Pacific and Latin America will experience strong demand due to urbanization and lifestyle changes. 8. Investments in localized recycling and production facilities will improve supply chain efficiency and reduce carbon footprints. 9. Premiumization trends and consumer preference for sleek can designs will drive value-added packaging growth. 10. Continued focus on sustainability and material innovation will shape long-term market competitiveness and expansion.

Request a Free Sample
Fill in your details and we'll send you a free sample report.
- Sample data tables & charts
- Research methodology
Need a Custom Version of This Report?
Tailor the scope, geography, or segments to your exact requirements.
- Custom geography or segment scope
- Direct access to our analyst team
Frequently Asked Questions
What is the current market size for the Aluminum Cans Market, and what is its projected size in 2032?
At what Compound Annual Growth Rate is the Aluminum Cans Market projected to grow between 2025 and 2032?
Which Aluminum Cans Market segment held the largest share in 2024?
What are the primary factors fueling the growth of the Aluminum Cans Market?
Who are the leading companies in the Aluminum Cans Market?
Which region commanded the largest share of the Aluminum Cans Market in 2024?
Table of Content
Chapter 1 Market Segmentation
- 1.1 Segmentation Framework
- 1.1.1 Product and Service Classification
- 1.1.2 Application and End-Use Classification
- 1.1.3 Technology and Solution Classification
- 1.1.4 Customer and Distribution Channel Classification
- 1.1.5 Geographic Segmentation
- 1.1.6 Market Segment Definitions and Boundaries
Chapter 2 Introduction
- 2.1 Report Objectives and Scope
- 2.2 Product Definition and Industry Terminology
- 2.3 Market Inclusions and Exclusions
- 2.4 Research Process
- 2.4.1 Primary Research and Expert Interviews
- 2.4.2 Secondary Research and Source Review
- 2.4.3 Top-Down and Bottom-Up Estimation
- 2.4.4 Data Triangulation and Verification
- 2.5 Market Size Measurement Basis
- 2.5.1 2024: USD 51,262 million → 2032: USD 70,697 million
- 2.6 Historical and Forecast Reference Periods
- 2.6.1 Base Year: 2024
- 2.6.2 Forecast Period: 2024-2032
- 2.7 Research Assumptions and Limitations
Chapter 3 Executive Summary
- 3.1 Market Snapshot and Key Findings
- 3.2 Base-Year Market Size, 2024
- 3.3 Forecast Market Size, 2032
- 3.4 Revenue and Volume Growth Outlook
- 3.5 Key Demand and Supply Indicators
- 3.6 Leading Market Segments
- 3.7 Fastest-Growing Market Opportunities
- 3.8 Regional Performance Highlights
- 3.9 Technology and Industry Transformation
- 3.10 Competitive Landscape Summary
- 3.11 Analyst View and Strategic Implications
Chapter 4 Global Aluminum Cans Market Trends and Developments
- 4.1 Historical Industry Development
- 4.2 Recent Market Trends and Developments
- 4.3 Demand and Customer Behavior Trends
- 4.4 Technology and Product Innovation
- 4.5 Artificial Intelligence, Automation and Digitalization
- 4.6 Local Manufacturing and Supply Chain Realignment
- 4.7 Industry Partnerships, Mergers and Acquisitions
- 4.8 Sustainability and Circular Economy Developments
- 4.9 Government and Private Sector Investment Trends
- 4.10 Emerging Business Models and Commercialization
- 4.11 Industry Developments and Announcements
Chapter 5 Global Aluminum Cans Market Production, Supply and Demand Analysis
- 5.1 Demand Trend and Consumption Analysis
- 5.2 Demand Forecast, 2024-2032
- 5.3 Production and Output Trend
- 5.4 Production and Output Forecast, 2024-2032
- 5.5 Installed Capacity and Capacity Utilization
- 5.6 Company-Wise Production Plants and Statistics
- 5.6.1 Installed Production Capacity
- 5.6.2 Actual Production
- 5.6.3 Planned Capacity and Expansion Targets
- 5.7 Supply Chain Structure and Procurement Trends
- 5.8 Supply-Demand Gap and Bottlenecks
- 5.9 Import Dependence and Sourcing Structure
- 5.10 Contract Manufacturing and Outsourcing
- 5.11 Regional Supply and Demand Concentration
Chapter 6 Global Aluminum Cans Market Pricing Analysis
- 6.1 Pricing Structure and Measurement
- 6.2 Historical Pricing Trends
- 6.3 Pricing Outlook, 2024-2032
- 6.4 Average Selling Price and Unit Economics
- 6.5 Pricing by Product and Market Segment
- 6.6 Geographic Pricing Differences
- 6.7 Key Input, Energy, Labor and Logistics Costs
- 6.8 Contract Pricing and Purchasing Models
- 6.9 Pricing Sensitivity and Competitive Positioning
- 6.10 Price, Margin and Profitability Implications
Chapter 7 Global Aluminum Cans Market Dynamics
- 7.1 Market Growth Drivers
- 7.1.1 Demand-Side Drivers
- 7.1.2 Technology and Innovation Drivers
- 7.1.3 Infrastructure and Investment Drivers
- 7.1.4 Regulatory and Policy Drivers
- 7.2 Market Restraints
- 7.2.1 Cost and Affordability Constraints
- 7.2.2 Technology and Adoption Barriers
- 7.2.3 Supply Chain and Operational Constraints
- 7.3 Market Challenges
- 7.3.1 Competitive Pressure and Margin Erosion
- 7.3.2 Skills, Infrastructure and Implementation Gaps
- 7.4 Emerging Market Opportunities
- 7.5 Market Dynamics Impact and Time-Horizon Assessment
Chapter 8 Global Aluminum Cans Value Chain Analysis
- 8.1 Industry Value Chain Overview
- 8.2 Upstream Suppliers and Critical Inputs
- 8.3 Technology and Component Providers
- 8.4 Manufacturing or Service Delivery
- 8.5 Distribution, Channel Partners and Integrators
- 8.6 Downstream Applications and End Users
- 8.7 Value Addition and Profit Pools
- 8.8 Vertical Integration and Outsourcing
- 8.9 Supplier Concentration and Risk
- 8.10 Supply Chain Localization and Resilience
Chapter 9 Global Aluminum Cans Market Regulations and Policies
- 9.1 Relevant Laws, Standards and Compliance Frameworks
- 9.2 Product, Service, Safety and Quality Requirements
- 9.3 Government Policies, Incentives and Subsidies
- 9.4 Imports, Exports and Trade Barriers
- 9.5 Public Procurement and Local Content Requirements
- 9.6 Environmental and Sustainability Compliance
- 9.7 Upcoming Policy Changes and Market Implications
Chapter 10 Global Aluminum Cans Market Hotspots and Opportunities
- 10.1 Market Opportunity Mapping and Growth Hotspots
- 10.2 High-Growth Applications and Customer Groups
- 10.3 Underserved Markets and White-Space Opportunities
- 10.4 Emerging Technology and Product Opportunities
- 10.5 New Capacity and Investment Hotspots
- 10.6 Market Entry and Expansion Opportunities
- 10.7 Distribution and Partnership Opportunities
- 10.8 Near-Term and Long-Term Commercial Potential
- 10.9 Opportunity Attractiveness and Execution Risks
Chapter 11 Global Aluminum Cans Market Outlook, 2024-2032
- 11.1 Market Size and Analysis
- 11.1.1 Revenue (Market Measurement: 2024: USD 51,262 million → 2032: USD 70,697 million)
- 11.1.2 Market Volume and Quantity Sold
- 11.1.3 Historical Market Size
- 11.1.4 Base-Year Market Size, 2024
- 11.2 Market Forecast, 2024-2032
- 11.2.1 Revenue Forecast to 2032
- 11.2.2 Volume Forecast to 2032
- 11.2.3 CAGR and Year-on-Year Growth
- 11.2.4 Incremental Revenue Opportunity
- 11.3 Forecast Assumptions and Scenario Analysis
- 11.3.1 Base-Case Forecast
- 11.3.2 Optimistic and Conservative Scenarios
- 11.3.3 Technology, Pricing and Policy Sensitivities
- 11.4 Market Attractiveness and Growth Outlook
Chapter 12 Global Aluminum Cans Market Segmentation and Outlook
- 12.1 Segmentation Summary and Market Shares, 2024
- 12.2 Largest and Fastest-Growing Segments
- 12.3 Segment Growth Comparison
- 12.4 Segment Attractiveness and Priority Matrix
Chapter 13 Global Aluminum Cans Geographic Market Outlook, 2024-2032
- 13.1 Regional Market Size and Share, 2024
- 13.2 Regional Market Forecast, 2024-2032
- 13.3 Regional Pricing, Production and Demand Differences
- 13.4 North America
- 13.4.1 United States
- 13.4.2 Canada
- 13.4.3 Mexico
- 13.5 Europe
- 13.5.1 Germany
- 13.5.2 France
- 13.5.3 Italy
- 13.5.4 United Kingdom
- 13.5.5 Spain
- 13.5.6 Poland
- 13.5.7 Russia
- 13.5.8 Netherlands
- 13.5.9 Belgium
- 13.5.10 Sweden
- 13.5.11 Denmark
- 13.5.12 Norway
- 13.5.13 Rest of Europe
- 13.6 Asia Pacific
- 13.6.1 China
- 13.6.2 India
- 13.6.3 Japan
- 13.6.4 South Korea
- 13.6.5 Thailand
- 13.6.6 Indonesia
- 13.6.7 Vietnam
- 13.6.8 Malaysia
- 13.6.9 Australia
- 13.6.10 Rest of Asia Pacific
- 13.7 Latin America
- 13.7.1 Brazil
- 13.7.2 Argentina
- 13.7.3 Colombia
- 13.7.4 Chile
- 13.7.5 Rest of Latin America
- 13.8 Middle East
- 13.8.1 Saudi Arabia
- 13.8.2 United Arab Emirates
- 13.8.3 Turkey
- 13.8.4 Israel
- 13.8.5 Iran
- 13.8.6 Rest of the Middle East
- 13.9 Africa
- 13.9.1 South Africa
- 13.9.2 Egypt
- 13.9.3 Nigeria
- 13.9.4 Morocco
- 13.9.5 Rest of Africa
- 13.10 Regional Investment, Policy and Supply Chain Differences
- 13.11 Regional Competitive Landscape
- 13.12 Geographic Growth Hotspots
Chapter 14 Global Aluminum Cans Technology, Innovation and Sustainability Outlook
- 14.1 Technology Landscape and Maturity
- 14.2 Product, Process and Service Innovation
- 14.3 AI, Automation and Digital Tools in the Industry
- 14.4 Technology Adoption and Performance Benchmarking
- 14.5 Innovation Pipeline and R&D Investment
- 14.6 Patent and Intellectual Property Trends
- 14.7 Energy Efficiency and Resource Management
- 14.8 Sustainability, Recycling and Circularity
- 14.9 Technology Roadmap, 2024-2032
- 14.10 Risks of Obsolescence and Technology Substitution
Chapter 15 Global Aluminum Cans Market Key Strategic Imperatives
- 15.1 Growth and Market Entry Priorities
- 15.2 High-Return Products and Segments
- 15.3 Pricing, Profitability and Cost Optimization
- 15.4 Technology Investment and Product Differentiation
- 15.5 Supply Chain Localization and Resilience
- 15.6 Distribution and Customer Acquisition
- 15.7 Partnership, Acquisition and Capacity Strategy
- 15.8 Regional Expansion Priorities
- 15.9 Short-, Medium- and Long-Term Actions
Chapter 16 Competition Outlook
- 16.1 Industry Competition Characteristics
- 16.2 Market Structure and Concentration
- 16.3 Market Share and Competitive Positioning, 2024
- 16.4 Company-Wise Revenue and Product Benchmarking
- 16.5 Production and Service Capacity Benchmarking
- 16.6 Technology, Pricing and Differentiation
- 16.7 Regional Footprint and Distribution Strength
- 16.8 Mergers, Acquisitions and Strategic Alliances
- 16.9 New Entrants and Competitive Threats
- 16.10 Porter's Five Forces and Industry Attractiveness
- 16.11 Competitive Outlook, 2024-2032
Chapter 17 Company Profiles
- 17.1 Company Coverage and Selection Criteria
- 17.2 Leading Market Participants – Standard Profile Structure
- 17.2.1 Business Description
- 17.2.2 Company Ownership and Geographic Presence
- 17.2.3 Product and Service Portfolio
- 17.2.4 Manufacturing and Operating Footprint
- 17.2.5 Production Capacity and Expansion Plans
- 17.2.6 Financial Performance and Investment
- 17.2.7 Market Share and Competitive Position
- 17.2.8 Technology and Innovation Capabilities
- 17.2.9 Strategic Alliances or Partnerships
- 17.2.10 Recent Developments
- 17.2.11 Growth Strategy and Outlook
- 17.3 Other Relevant Market Participants
Note: Every listed company is profiled on the structure shown under the first company. The company list is preliminary and may change based on research findings, market developments, data availability and client requirements.
Chapter 18 Disclaimer
- 18.1 Research and Forecast Disclaimer
- 18.2 Data Source and Estimation Limitations
Note: The depth of individual sections depends on data availability for this market. Volume, capacity, trade and other unit-based metrics are included where applicable.

