Market Overview
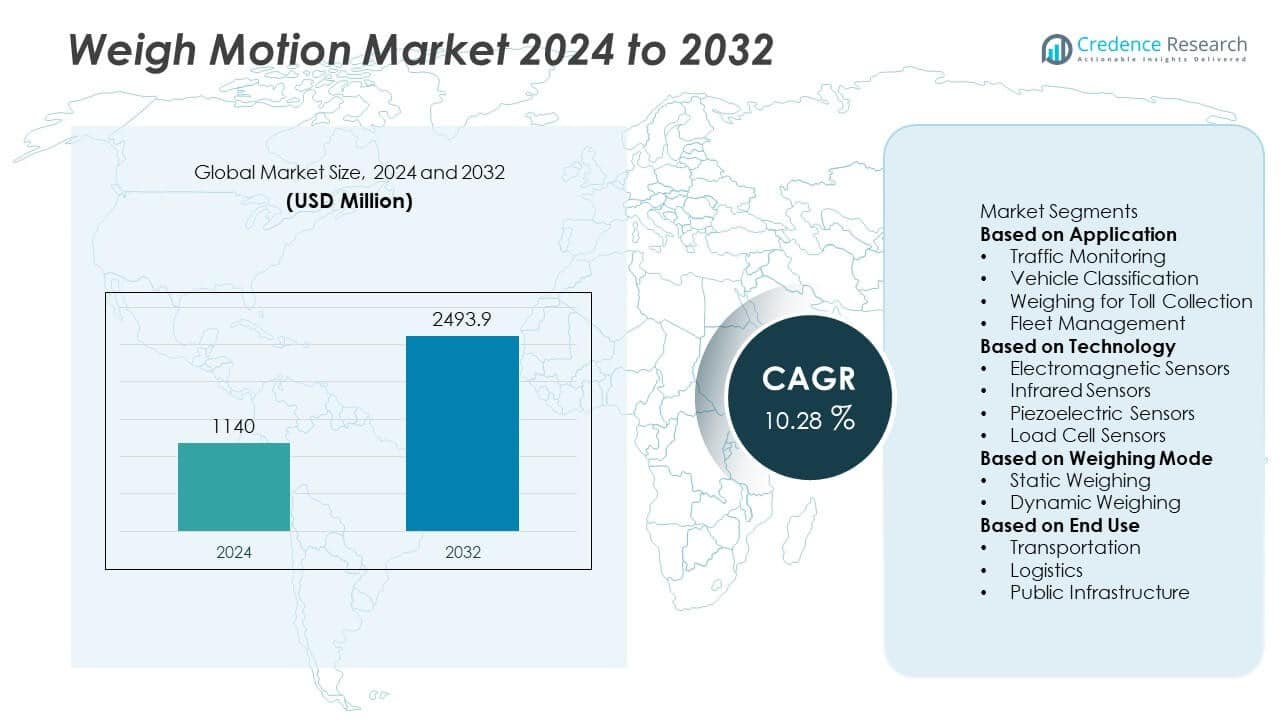
Weigh Motion Market size was valued at USD 1140 million in 2024 and is anticipated to reach USD 2493.9 million by 2032, growing at a CAGR of 10.28% during the forecast period (2024–2032).
| REPORT ATTRIBUTE | DETAILS |
|---|---|
| Historical Period | 2020-2024 |
| Base Year | 2024 |
| Forecast Period | 2025-2032 |
| Weigh Motion Market Size 2024 | USD 1140 Million |
| Weigh Motion Market, CAGR | 10.28% |
| Weigh Motion Market Size 2032 | USD 2493.9 Million |
The Weigh Motion Market grows through strong drivers and evolving trends that reshape transportation and logistics infrastructure. Increasing government focus on road safety, freight compliance, and vehicle efficiency accelerates adoption of weigh-in-motion systems across highways and industrial zones. Demand for accurate, real-time traffic data enhances enforcement of axle-load regulations and supports sustainable road maintenance. Integration of IoT, AI, and cloud platforms strengthens system intelligence, enabling predictive analytics and dynamic weight monitoring.
The Weigh Motion Market shows strong geographical diversity, with North America leading adoption due to strict transportation regulations and advanced highway infrastructure, while Europe emphasizes sustainable mobility and cross-border freight monitoring through intelligent weighing systems. Asia-Pacific demonstrates rapid growth driven by expanding logistics, smart city projects, and government investment in road safety technologies. Latin America and the Middle East & Africa also gain traction, supported by modernization of transport networks and the need for efficient freight compliance. Key players such as Siemens AG, Weighpoint Australia Pty Ltd, Traffic Technologies Ltd, and Sicame Group contribute to market expansion by offering innovative weigh-in-motion solutions, integrating digital platforms, and collaborating with governments on infrastructure upgrades.
Market Insights
- The Weigh Motion Market size was valued at USD 1140 million in 2024 and is anticipated to reach USD 2493.9 million by 2032, at a CAGR of 10.28% during the forecast period.
- Growing focus on transportation safety and regulatory compliance drives the adoption of weigh-in-motion systems in freight management and highway monitoring.
- Integration of IoT, AI, and cloud-based analytics emerges as a key trend, enabling real-time traffic monitoring, predictive maintenance, and improved decision-making for logistics operators.
- Competitive intensity is increasing with key players such as Siemens AG, Weighpoint Australia Pty Ltd, Sicame Group, and Traffic Technologies Ltd expanding their technological capabilities and service portfolios.
- High installation costs, calibration challenges, and maintenance requirements act as restraints, limiting adoption in cost-sensitive markets and emerging economies.
- North America and Europe show advanced deployment due to strict road safety regulations, while Asia-Pacific records fastest growth supported by infrastructure expansion and smart city projects.
- The market outlook reflects strong opportunities in Latin America and the Middle East & Africa, where governments invest in modernizing transport networks and improving freight efficiency.
Market Drivers
Growing Emphasis on Road Safety and Compliance
Governments across the globe are strengthening regulations to enhance road safety and reduce vehicle overloading. Stricter enforcement of axle load limits pushes transport operators to adopt weigh-in-motion systems for compliance. The technology helps reduce accidents, protects road infrastructure, and ensures adherence to transport safety standards. National highway authorities in several regions are mandating weigh stations to control freight movement. This rising regulatory pressure acts as a key driver for adoption. The Weigh Motion Market benefits significantly from the integration of these systems into traffic monitoring frameworks.
- For instance, in May 2022, International Road Dynamics Inc. won contracts totaling approximately USD 900,000 to upgrade weigh-in-motion systems for the Illinois State Toll Highway Authority, supporting enhanced enforcement and infrastructure protection
Expansion of Smart Transportation and Infrastructure Projects
Global investment in smart city and intelligent transportation systems directly drives the demand for weigh-in-motion technology. Governments are integrating it with traffic management, toll collection, and surveillance systems. Its ability to deliver real-time weight data enhances traffic flow and optimizes road asset management. Infrastructure projects in developing economies focus on efficient logistics and improved highway monitoring. Adoption of weigh-in-motion technology aligns with long-term digital transformation strategies. Its role in enhancing transport efficiency strengthens its adoption in both developed and emerging markets.
- For instance, Q-Free ASA has introduced the HI-TRAC TMU4X, a high-speed weigh-in-motion (WIM) solution that also offers automatic vehicle classification and multimodal data collection in a single unit
Rising Demand from Logistics and Freight Management
The logistics and freight industry faces growing pressure to ensure cost efficiency and regulatory compliance. Fleet operators require accurate weight data to reduce fuel consumption, optimize load distribution, and prevent fines. Weigh-in-motion solutions provide continuous monitoring without causing delays in cargo movement. Logistics companies adopt these systems to reduce operational costs and strengthen supply chain efficiency. It also helps maintain vehicle performance and extends asset life by avoiding overloading. The Weigh Motion Market experiences strong growth from this sector’s increasing focus on real-time monitoring solutions.
Advancements in Sensor and Data Analytics Technologies
Technological progress in sensors, automation, and analytics is improving the accuracy and reliability of weigh-in-motion systems. Modern systems can differentiate between vehicle classes, measure axle loads, and integrate with cloud platforms for predictive insights. Real-time analytics support authorities in planning road maintenance and logistics operators in improving route efficiency. Integration with IoT and AI enhances system performance and broadens use cases across industries. Its ability to provide actionable intelligence elevates its value proposition. These innovations ensure that the Weigh Motion Market continues to evolve with increasing adoption across transport ecosystems.
Market Trends
Integration with Intelligent Transportation Systems
A strong trend in the industry is the integration of weigh-in-motion solutions with intelligent transportation systems. National and regional authorities are embedding these systems into broader frameworks for tolling, traffic monitoring, and automated enforcement. It improves overall traffic efficiency by reducing bottlenecks at traditional weigh stations. Authorities also leverage the data to design better road safety strategies. The growing role of automation in transportation infrastructure highlights weigh-in-motion as a core component of smart mobility solutions. The Weigh Motion Market benefits from these digital upgrades in modern transport ecosystems.
- For instance, The U.S. Federal Highway Administration, in partnership with the New York City Department of Transportation, implemented an Advanced Weigh-In-Motion (A-WIM) pilot program on the Brooklyn-Queens Expressway (BQE).
Adoption of Portable and Low-Cost Solutions
The demand for portable and modular weigh-in-motion systems is rising across emerging markets. Smaller logistics operators and regional authorities prefer flexible, easy-to-install solutions that deliver accuracy without heavy infrastructure investment. It supports decentralized freight monitoring in rural and semi-urban areas. Growing adoption in temporary construction projects and seasonal freight routes also accelerates this trend. The ability to deploy cost-effective portable systems expands the reach of technology to smaller players. This shift enhances accessibility and drives broader acceptance in the Weigh Motion Market.
- For instance, Intercomp’s LS788-WIM™ Portable Weigh-In-Motion Scales accept weight capacities to 30000 lb (15000 kg) and feature roll-up ramps that are easy to deploy.
Increasing Use of Advanced Data Analytics and AI
Another key trend is the use of advanced analytics and AI-powered tools for predictive insights. Authorities and fleet managers increasingly depend on real-time vehicle weight data to forecast maintenance needs and plan efficient logistics routes. It reduces costs by preventing vehicle overloading and minimizing road damage. AI-driven algorithms also enhance the accuracy of classification and axle load monitoring. The ability to deliver actionable intelligence strengthens the role of weigh-in-motion systems in operational decision-making. This trend accelerates digital transformation within the Weigh Motion Market.
Focus on Sustainability and Infrastructure Longevity
Growing environmental awareness is shaping the demand for weigh-in-motion technologies. Overloaded vehicles significantly damage road surfaces, increasing carbon-intensive repair activities. Governments are deploying systems to protect infrastructure and reduce lifecycle costs. It promotes sustainable transportation by lowering emissions through efficient load management. Construction firms and contractors also use weigh-in-motion for temporary road projects to maintain safety and durability. The Weigh Motion Market reflects this sustainability-driven adoption, reinforcing its alignment with long-term green infrastructure initiatives.
Market Challenges Analysis
High Installation and Maintenance Costs
The deployment of weigh-in-motion systems requires significant investment in infrastructure, calibration, and integration with traffic management platforms. Smaller municipalities and logistics operators often face budget constraints that limit adoption. It becomes particularly challenging in regions with underdeveloped road infrastructure where system accuracy is affected by poor pavement conditions. Maintenance costs also rise due to the need for regular calibration and replacement of sensors under heavy vehicle loads. These expenses create barriers for widespread adoption across developing markets. The Weigh Motion Market must address cost-efficiency concerns to ensure scalable deployment.
Accuracy Limitations and Technical Barriers
Ensuring precise measurements under varying traffic and environmental conditions remains a key challenge. High-speed traffic, uneven road surfaces, and adverse weather can affect sensor performance and data reliability. It reduces the confidence of authorities in relying solely on weigh-in-motion systems for enforcement. Integration with existing traffic systems also creates technical hurdles that demand skilled personnel and advanced software. The complexity of aligning national standards with global compliance further slows down adoption. The Weigh Motion Market faces the task of overcoming these technical barriers to strengthen trust and expand utility.
Market Opportunities
Adoption Across Smart Transportation and Infrastructure Projects
The growing shift toward smart city initiatives and intelligent transportation systems creates new opportunities for weigh-in-motion adoption. Governments are integrating these systems into broader road safety and traffic management programs. It allows real-time vehicle monitoring while reducing manual enforcement costs. The demand for automated tolling and axle-load compliance enhances the need for scalable weigh-in-motion platforms. Integration with advanced analytics enables authorities to track traffic flow and infrastructure stress more effectively. The Weigh Motion Market gains strong momentum from these projects as cities expand investments in digital infrastructure.
Expansion in Logistics and Commercial Fleet Management
Rising logistics activity and cross-border trade highlight the importance of vehicle load monitoring for efficiency and compliance. Logistics operators use weigh-in-motion systems to optimize cargo loads, reduce fuel costs, and prevent vehicle overloading penalties. It supports predictive maintenance strategies by providing real-time axle load data that reduces vehicle downtime. Commercial fleet operators benefit from improved operational safety and reduced insurance risks. Increasing demand from e-commerce and last-mile delivery sectors further expands the application scope. The Weigh Motion Market leverages these opportunities to strengthen its role in logistics optimization and fleet management.
Market Segmentation Analysis:
By Application
The Weigh Motion Market serves diverse applications across highway monitoring, toll management, logistics, and infrastructure planning. Highway authorities rely on weigh-in-motion systems to enforce axle-load regulations and enhance road safety. Toll operators adopt these solutions to automate fee collection and minimize traffic delays at toll plazas. Logistics companies deploy weigh-in-motion technology to optimize vehicle loading, reduce maintenance costs, and comply with cargo safety standards. Construction and mining sectors integrate these systems for on-site monitoring of heavy equipment and vehicles, ensuring operational safety. It shows adaptability across sectors where load compliance and real-time monitoring are critical to efficiency.
- For instance, Kistler deployed its KiTraffic Digital WIM system on Germany’s A1 highway, using 10 Lineas Digital sensors that measured wheel, axle, and gross vehicle weight in real time without lane closures-enabling efficient enforcement alongside traffic monitoring.
By Technology
Weigh-in-motion systems are segmented by technology into bending plate, piezoelectric sensors, load cell, and others. Bending plate systems dominate due to their durability and cost-effectiveness in highway applications. Piezoelectric sensors are preferred for their high accuracy and ability to capture real-time vehicle dynamics at varying speeds. Load cell technology offers precision and is widely used in environments where weight accuracy is critical, such as logistics terminals and inspection stations. Emerging sensor technologies focus on enhancing data integration with smart infrastructure and predictive analytics. It reflects ongoing innovation in technology aimed at improving system reliability and adaptability across different operating conditions.
- Kistler's Lineas piezoelectric quartz sensors are a reliable and accurate solution for weigh-in-motion (WIM) systems, boasting over 100,000 installations worldwide. These sensors are known for their precision, achieving accuracy within ±2-5% of the gross vehicle weight, even at speeds up to 130 km/h.
By Weighing Mode
The market is segmented by weighing mode into static weighing, low-speed weigh-in-motion (LS-WIM), and high-speed weigh-in-motion (HS-WIM). Static weighing is used in controlled environments such as inspection stations and industrial facilities where accuracy is paramount. Low-speed WIM gains demand in areas like border checkpoints and ports where vehicles can be weighed at reduced speeds without halting operations. High-speed WIM systems dominate in highway applications, supporting real-time enforcement, tolling, and traffic monitoring without disrupting vehicle flow. It offers governments and operators a cost-efficient solution to monitor heavy vehicles across large networks. The segmentation underscores the ability of weigh-in-motion systems to balance accuracy, efficiency, and operational flexibility across industries.
Segments:
Based on Application
- Traffic Monitoring
- Vehicle Classification
- Weighing for Toll Collection
- Fleet Management
Based on Technology
- Electromagnetic Sensors
- Infrared Sensors
- Piezoelectric Sensors
- Load Cell Sensors
Based on Weighing Mode
- Static Weighing
- Dynamic Weighing
Based on End Use
- Transportation
- Logistics
- Public Infrastructure
Based on the Geography:
- North America
- U.S.
- Canada
- Mexico
- Europe
- UK
- France
- Germany
- Italy
- Spain
- Russia
- Belgium
- Netherlands
- Austria
- Sweden
- Poland
- Denmark
- Switzerland
- Rest of Europe
- Asia Pacific
- China
- Japan
- South Korea
- India
- Australia
- Thailand
- Indonesia
- Vietnam
- Malaysia
- Philippines
- Taiwan
- Rest of Asia Pacific
- Latin America
- Brazil
- Argentina
- Peru
- Chile
- Colombia
- Rest of Latin America
- Middle East
- UAE
- KSA
- Israel
- Turkey
- Iran
- Rest of Middle East
- Africa
- Egypt
- Nigeria
- Algeria
- Morocco
- Rest of Africa
Regional Analysis
North America
North America holds the largest share of the Weigh Motion Market, accounting for around 32% of the global revenue in 2024. Strong regulatory frameworks supporting highway safety and commercial vehicle compliance drive demand for weigh-in-motion systems across the United States and Canada. Government investment in smart infrastructure and intelligent transportation systems further accelerates adoption, especially in toll management and freight monitoring applications. The U.S. leads the region with widespread deployment of high-speed weigh-in-motion (HS-WIM) systems across interstate highways. Canada demonstrates growing adoption in cross-border freight routes, ensuring load compliance in international logistics. It benefits from strong partnerships between technology providers and transportation authorities, making North America a frontrunner in innovation and implementation.
Europe
Europe represents around 27% of the Weigh Motion Market in 2024, supported by strict enforcement of axle load regulations and sustainability policies. Countries such as Germany, France, and the UK lead adoption, driven by their extensive freight traffic and investments in digitalized road infrastructure. The European Union’s emphasis on reducing road damage and enhancing safety has encouraged deployment of weigh-in-motion systems across major highways and logistics corridors. Advanced technologies, including piezoelectric sensors and AI-driven traffic monitoring, are gaining traction in this region. Eastern Europe is witnessing gradual growth as infrastructure modernization initiatives expand. It shows a balanced demand between regulatory-driven installations and applications in logistics hubs.
Asia-Pacific
Asia-Pacific holds around 25% of the Weigh Motion Market in 2024 and is the fastest-growing regional segment. Rapid industrialization, urbanization, and rising freight movement in China, India, and Southeast Asia create strong demand for load compliance solutions. Governments are investing heavily in highway development and smart city projects, incorporating weigh-in-motion technologies into toll plazas and traffic management systems. China leads with large-scale deployment across national highways, while India shows high growth potential due to ongoing upgrades in transport infrastructure. Japan and South Korea focus on integrating advanced sensor systems with intelligent transportation networks. It highlights the region’s role as a major growth engine, driven by economic expansion and regulatory modernization.
Latin America
Latin America contributes around 9% of the global Weigh Motion Market in 2024, with Brazil and Mexico leading adoption. Increasing freight activity and government focus on improving road safety fuel demand for weigh-in-motion systems in the region. Brazil invests in logistics modernization, particularly in ports and highways, to streamline cargo movement and enforce axle load regulations. Mexico focuses on toll road infrastructure and cross-border freight monitoring to support trade with the U.S. Other Latin American countries show gradual adoption, supported by international collaborations and infrastructure development projects. It reflects steady demand but limited growth due to budgetary constraints and uneven regulatory enforcement.
Middle East & Africa
The Middle East & Africa accounts for approximately 7% of the global Weigh Motion Market in 2024. Growth in this region is driven by investments in infrastructure modernization, particularly in Gulf Cooperation Council (GCC) countries. Saudi Arabia and the UAE deploy weigh-in-motion systems to support their logistics and smart transport initiatives. Africa shows emerging demand, led by South Africa’s efforts to improve freight monitoring and road compliance. Limited infrastructure development and financial challenges restrict widespread adoption across many African nations. It reflects a region in early development, with opportunities tied to expanding trade routes and smart city projects in the Middle East.
Key Player Analysis
- Siemens AG
- Traffic Monitoring Systems
- C3S
- Sicame Group
- Apex Dynamics
- HIKOB
- Traffic Technologies Ltd
- Highway Investment Corp
- Weighpoint Australia Pty Ltd
- IDID
Competitive Analysis
The competitive landscape of the Weigh Motion Market is shaped by global and regional players focusing on technological innovation, regulatory compliance, and strategic partnerships. Leading companies such as Siemens AG, Weighpoint Australia Pty Ltd, Sicame Group, Traffic Technologies Ltd, HIKOB, Highway Investment Corp, Traffic Monitoring Systems, C3S, IDID, and Apex Dynamics play a central role in driving market dynamics. Siemens AG leverages its strong expertise in intelligent transportation solutions, integrating weigh-in-motion (WIM) systems with smart infrastructure and traffic management platforms. Weighpoint Australia Pty Ltd specializes in providing precision weighing systems tailored to the logistics and transportation sectors, ensuring accuracy and compliance with regional standards. Sicame Group strengthens its presence through robust electrical and monitoring components that support reliable WIM system deployment. Traffic Technologies Ltd emphasizes smart city applications, offering integrated traffic management and monitoring solutions. HIKOB and IDID focus on sensor-based innovations, enhancing system efficiency and data accuracy. Highway Investment Corp and C3S invest in large-scale infrastructure projects that incorporate WIM technologies to modernize transport networks. Apex Dynamics adds value with its engineering expertise in motion and automation solutions. The market reflects a moderately consolidated structure where innovation, service quality, and partnerships with government bodies define competitive positioning.
Recent Developments
- In July 2025, Amsterdam launched a pilot installation of an innovative WIM system based on optical fiber technology embedded within asphalt. The system measures roadway deformation to derive axle and wheel weight data-delivering accurate results without halting traffic flow
- In May 2025, The New York State Budget Expands NYC DOT’s Authority to Use First-in-Nation Weigh-in-Motion (WIM) Automated Enforcement to Crack Down on Overweight Vehicles
- In March 2025, Hannover Messe, Siemens is showcasing advances in industrial AI, software-defined automation and digital twin technology – innovations that, combined with a strong partner ecosystem, will accelerate the digital transformation and sustainability across industries toward an AI-driven future.
Market Concentration & Characteristics
The Weigh Motion Market demonstrates a moderately concentrated structure with a blend of established multinational corporations and specialized regional players. It is characterized by strong competition in technology innovation, system integration, and service delivery. Companies focus on sensor accuracy, automation, and digital connectivity to meet rising demand from highway authorities, logistics providers, and law enforcement agencies. Strategic collaborations with governments and infrastructure developers strengthen market positioning, while investments in intelligent transportation systems enhance system efficiency. It reflects high entry barriers due to regulatory compliance, calibration requirements, and capital intensity, which limit the presence of new entrants. The market shows characteristics of steady consolidation as larger players expand through acquisitions and partnerships, while regional firms focus on cost-effective solutions and localized service models. This balance between global expertise and regional adaptability defines the competitive landscape and sustains growth opportunities across diverse application areas.
Report Coverage
The research report offers an in-depth analysis based on Application, Technology, Weighing Mode, End Use and Geography. It details leading market players, providing an overview of their business, product offerings, investments, revenue streams, and key applications. Additionally, the report includes insights into the competitive environment, SWOT analysis, current market trends, as well as the primary drivers and constraints. Furthermore, it discusses various factors that have driven market expansion in recent years. The report also explores market dynamics, regulatory scenarios, and technological advancements that are shaping the industry. It assesses the impact of external factors and global economic changes on market growth. Lastly, it provides strategic recommendations for new entrants and established companies to navigate the complexities of the market.
Future Outlook
- The market will expand with growing investments in smart transportation infrastructure.
- Demand for weigh motion systems will increase with stricter road safety and axle load regulations.
- Integration of AI and IoT will improve system accuracy and real-time monitoring capabilities.
- Governments will adopt weigh motion solutions to reduce road maintenance costs and enhance traffic efficiency.
- Logistics companies will rely on these systems to improve fleet management and cargo compliance.
- Cloud-based platforms will enable data analytics and predictive maintenance in weigh motion operations.
- Emerging economies will witness rapid adoption due to expanding highway and freight networks.
- Partnerships between technology providers and infrastructure developers will strengthen market growth.
- Portable weigh motion systems will gain traction for temporary construction and mining operations.
- Sustainability goals will drive innovation toward energy-efficient and low-maintenance weigh motion technologies.

Request a Free Sample
Fill in your details and we'll send you a free sample report.
- Sample data tables & charts
- Research methodology
Market Dynamics
Growing Emphasis on Road Safety and Compliance
Governments are enforcing stricter axle load regulations to reduce road accidents and infrastructure damage, driving adoption of weigh-in-motion systems for real-time compliance and enforcement.
Expansion of Smart Transportation and Infrastructure Projects
Investments in smart city and intelligent transportation systems are integrating weigh-in-motion technology for enhanced traffic management, tolling, and road asset optimization, fueling market growth.
Rising Demand from Logistics and Freight Management
Logistics and fleet operators require accurate, real-time weight data to optimize load distribution, reduce fuel consumption, and avoid regulatory penalties, increasing the uptake of weigh-in-motion solutions.
Advancements in Sensor and Data Analytics Technologies
Innovations in sensor accuracy, automation, and AI-powered analytics are improving the reliability and utility of weigh-in-motion systems, enabling predictive maintenance and smarter decision-making for operators.
Integration with Intelligent Transportation Systems
Embedding weigh-in-motion solutions within broader ITS frameworks for automated enforcement, tolling, and traffic monitoring is streamlining operations and expanding the market’s application scope.
Need a Custom Version of This Report?
Tailor the scope, geography, or segments to your exact requirements.
- Custom geography or segment scope
- Direct access to our analyst team
Frequently Asked Questions
What is the current market size for Weigh Motion, and what is its projected size in 2032?
At what Compound Annual Growth Rate is the Weigh Motion market projected to grow between 2025 and 2032?
Which Weigh Motion market segment held the largest share in 2024?
What are the primary factors fueling the growth of the Weigh Motion market?
Who are the leading companies in the Weigh Motion market?
Which region commanded the largest share of the Weigh Motion market in 2024?
Table of Content
Chapter 1 Market Segmentation
- 1.1 Segmentation Framework
- 1.1.1 Product and Service Classification
- 1.1.2 Application and End-Use Classification
- 1.1.3 Technology and Solution Classification
- 1.1.4 Customer and Distribution Channel Classification
- 1.1.5 Geographic Segmentation
- 1.1.6 Market Segment Definitions and Boundaries
- 1.2 By End Use
- 1.2.1 Transportation
- 1.2.2 Logistics
- 1.2.3 Public Infrastructure
- 1.3 By Technology
- 1.3.1 Electromagnetic Sensors
- 1.3.2 Infrared Sensors
- 1.3.3 Piezoelectric Sensors
- 1.3.4 Load Cell Sensors
- 1.4 By Application
- 1.4.1 Traffic Monitoring
- 1.4.2 Vehicle Classification
- 1.4.3 Weighing for Toll Collection
- 1.4.4 Fleet Management
- 1.5 By Weighing Mode
- 1.5.1 Static Weighing
- 1.5.2 Dynamic Weighing
Chapter 2 Introduction
- 2.1 Report Objectives and Scope
- 2.2 Product Definition and Industry Terminology
- 2.3 Market Inclusions and Exclusions
- 2.4 Research Process
- 2.4.1 Primary Research and Expert Interviews
- 2.4.2 Secondary Research and Source Review
- 2.4.3 Top-Down and Bottom-Up Estimation
- 2.4.4 Data Triangulation and Verification
- 2.5 Market Size Measurement Basis
- 2.5.1 2024: USD 1140 million → 2032: USD 2493.9 million
- 2.6 Historical and Forecast Reference Periods
- 2.6.1 Base Year: 2024
- 2.6.2 Forecast Period: 2024-2032
- 2.7 Research Assumptions and Limitations
Chapter 3 Executive Summary
- 3.1 Market Snapshot and Key Findings
- 3.2 Base-Year Market Size, 2024
- 3.3 Forecast Market Size, 2032
- 3.4 Revenue and Volume Growth Outlook
- 3.5 Key Demand and Supply Indicators
- 3.6 Leading Market Segments
- 3.7 Fastest-Growing Market Opportunities
- 3.8 Regional Performance Highlights
- 3.9 Technology and Industry Transformation
- 3.10 Competitive Landscape Summary
- 3.11 Analyst View and Strategic Implications
Chapter 4 Global Weigh Motion Market Trends and Developments
- 4.1 Historical Industry Development
- 4.2 Recent Market Trends and Developments
- 4.3 Demand and Customer Behavior Trends
- 4.4 Technology and Product Innovation
- 4.5 Artificial Intelligence, Automation and Digitalization
- 4.6 Local Manufacturing and Supply Chain Realignment
- 4.7 Industry Partnerships, Mergers and Acquisitions
- 4.8 Sustainability and Circular Economy Developments
- 4.9 Government and Private Sector Investment Trends
- 4.10 Emerging Business Models and Commercialization
- 4.11 Industry Developments and Announcements
Chapter 5 Global Weigh Motion Market Production, Supply and Demand Analysis
- 5.1 Demand Trend and Consumption Analysis
- 5.2 Demand Forecast, 2024-2032
- 5.3 Production and Output Trend
- 5.4 Production and Output Forecast, 2024-2032
- 5.5 Installed Capacity and Capacity Utilization
- 5.6 Company-Wise Production Plants and Statistics
- 5.6.1 Installed Production Capacity
- 5.6.2 Actual Production
- 5.6.3 Planned Capacity and Expansion Targets
- 5.7 Supply Chain Structure and Procurement Trends
- 5.8 Supply-Demand Gap and Bottlenecks
- 5.9 Import Dependence and Sourcing Structure
- 5.10 Contract Manufacturing and Outsourcing
- 5.11 Regional Supply and Demand Concentration
Chapter 6 Global Weigh Motion Market Pricing Analysis
- 6.1 Pricing Structure and Measurement
- 6.2 Historical Pricing Trends
- 6.3 Pricing Outlook, 2024-2032
- 6.4 Average Selling Price and Unit Economics
- 6.5 Pricing by Product and Market Segment
- 6.6 Geographic Pricing Differences
- 6.7 Key Input, Energy, Labor and Logistics Costs
- 6.8 Contract Pricing and Purchasing Models
- 6.9 Pricing Sensitivity and Competitive Positioning
- 6.10 Price, Margin and Profitability Implications
Chapter 7 Global Weigh Motion Market Dynamics
- 7.1 Market Growth Drivers
- 7.1.1 Demand-Side Drivers
- 7.1.2 Technology and Innovation Drivers
- 7.1.3 Infrastructure and Investment Drivers
- 7.1.4 Regulatory and Policy Drivers
- 7.2 Market Restraints
- 7.2.1 Cost and Affordability Constraints
- 7.2.2 Technology and Adoption Barriers
- 7.2.3 Supply Chain and Operational Constraints
- 7.3 Market Challenges
- 7.3.1 Competitive Pressure and Margin Erosion
- 7.3.2 Skills, Infrastructure and Implementation Gaps
- 7.4 Emerging Market Opportunities
- 7.5 Market Dynamics Impact and Time-Horizon Assessment
Chapter 8 Global Weigh Motion Value Chain Analysis
- 8.1 Industry Value Chain Overview
- 8.2 Upstream Suppliers and Critical Inputs
- 8.3 Technology and Component Providers
- 8.4 Manufacturing or Service Delivery
- 8.5 Distribution, Channel Partners and Integrators
- 8.6 Downstream Applications and End Users
- 8.7 Value Addition and Profit Pools
- 8.8 Vertical Integration and Outsourcing
- 8.9 Supplier Concentration and Risk
- 8.10 Supply Chain Localization and Resilience
Chapter 9 Global Weigh Motion Market Regulations and Policies
- 9.1 Relevant Laws, Standards and Compliance Frameworks
- 9.2 Product, Service, Safety and Quality Requirements
- 9.3 Government Policies, Incentives and Subsidies
- 9.4 Imports, Exports and Trade Barriers
- 9.5 Public Procurement and Local Content Requirements
- 9.6 Environmental and Sustainability Compliance
- 9.7 Data Protection, AI and Cybersecurity Compliance
- 9.8 Upcoming Policy Changes and Market Implications
Chapter 10 Global Weigh Motion Market Hotspots and Opportunities
- 10.1 Market Opportunity Mapping and Growth Hotspots
- 10.2 High-Growth Applications and Customer Groups
- 10.3 Underserved Markets and White-Space Opportunities
- 10.4 Emerging Technology and Product Opportunities
- 10.5 New Capacity and Investment Hotspots
- 10.6 Market Entry and Expansion Opportunities
- 10.7 Distribution and Partnership Opportunities
- 10.8 Near-Term and Long-Term Commercial Potential
- 10.9 Opportunity Attractiveness and Execution Risks
Chapter 11 Global Weigh Motion Market Outlook, 2024-2032
- 11.1 Market Size and Analysis
- 11.1.1 Revenue (Market Measurement: 2024: USD 1140 million → 2032: USD 2493.9 million)
- 11.1.2 Market Volume and Quantity Sold
- 11.1.3 Historical Market Size
- 11.1.4 Base-Year Market Size, 2024
- 11.2 Market Forecast, 2024-2032
- 11.2.1 Revenue Forecast to 2032
- 11.2.2 Volume Forecast to 2032
- 11.2.3 CAGR and Year-on-Year Growth
- 11.2.4 Incremental Revenue Opportunity
- 11.3 Forecast Assumptions and Scenario Analysis
- 11.3.1 Base-Case Forecast
- 11.3.2 Optimistic and Conservative Scenarios
- 11.3.3 Technology, Pricing and Policy Sensitivities
- 11.4 Market Attractiveness and Growth Outlook
Chapter 12 Global Weigh Motion Market Segmentation and Outlook
- 12.1 Segmentation Summary and Market Shares, 2024
- 12.2 Largest and Fastest-Growing Segments
- 12.3 By End Use - Market Size and Forecast, 2024-2032
- 12.3.1 Segment Definition and Scope
- 12.3.2 Historical Market Size
- 12.3.3 Revenue Forecast, 2024-2032
- 12.3.4 Volume Forecast, 2024-2032
- 12.3.5 Base-Year Market Share, 2024
- 12.3.6 Segment CAGR and Growth Drivers
- 12.3.7 Subsegment Market Size and Forecast
- 12.3.7.1 Transportation
- 12.3.7.2 Logistics
- 12.3.7.3 Public Infrastructure
- 12.3.8 Subsegment Pricing and Adoption Trends
- 12.3.9 Leading Suppliers and Competition
- 12.3.10 Regional Demand and Opportunities
- 12.4 By Technology - Market Size and Forecast, 2024-2032
- 12.4.1 Segment Definition and Scope
- 12.4.2 Historical Market Size
- 12.4.3 Revenue Forecast, 2024-2032
- 12.4.4 Volume Forecast, 2024-2032
- 12.4.5 Base-Year Market Share, 2024
- 12.4.6 Segment CAGR and Growth Drivers
- 12.4.7 Subsegment Market Size and Forecast
- 12.4.7.1 Electromagnetic Sensors
- 12.4.7.2 Infrared Sensors
- 12.4.7.3 Piezoelectric Sensors
- 12.4.7.4 Load Cell Sensors
- 12.4.8 Subsegment Pricing and Adoption Trends
- 12.4.9 Leading Suppliers and Competition
- 12.4.10 Regional Demand and Opportunities
- 12.5 By Application - Market Size and Forecast, 2024-2032
- 12.5.1 Segment Definition and Scope
- 12.5.2 Historical Market Size
- 12.5.3 Revenue Forecast, 2024-2032
- 12.5.4 Volume Forecast, 2024-2032
- 12.5.5 Base-Year Market Share, 2024
- 12.5.6 Segment CAGR and Growth Drivers
- 12.5.7 Subsegment Market Size and Forecast
- 12.5.7.1 Traffic Monitoring
- 12.5.7.2 Vehicle Classification
- 12.5.7.3 Weighing for Toll Collection
- 12.5.7.4 Fleet Management
- 12.5.8 Subsegment Pricing and Adoption Trends
- 12.5.9 Leading Suppliers and Competition
- 12.5.10 Regional Demand and Opportunities
- 12.6 By Weighing Mode - Market Size and Forecast, 2024-2032
- 12.6.1 Segment Definition and Scope
- 12.6.2 Historical Market Size
- 12.6.3 Revenue Forecast, 2024-2032
- 12.6.4 Volume Forecast, 2024-2032
- 12.6.5 Base-Year Market Share, 2024
- 12.6.6 Segment CAGR and Growth Drivers
- 12.6.7 Subsegment Market Size and Forecast
- 12.6.7.1 Static Weighing
- 12.6.7.2 Dynamic Weighing
- 12.6.8 Subsegment Pricing and Adoption Trends
- 12.6.9 Leading Suppliers and Competition
- 12.6.10 Regional Demand and Opportunities
- 12.7 Segment Growth Comparison
- 12.8 Segment Attractiveness and Priority Matrix
Chapter 13 Global Weigh Motion End-Use and Application Market Outlook
- 13.1 End-Use Industry and Customer Demand Structure
- 13.2 Leading Applications and Customer Groups
- 13.3 End-Use Market Size, Share and Forecast
- 13.4 Major End-Use Industry Deep Dives
- 13.4.1 Customer Requirements and Use Cases
- 13.4.2 Demand and Replacement Cycles
- 13.4.3 Technical and Regulatory Considerations
- 13.4.4 Purchasing and Procurement Models
- 13.4.5 Leading Vendors and Distribution Channels
- 13.4.6 Forecast and Commercial Opportunities
- 13.5 Emerging Applications and Cross-Segment Demand
- 13.6 End-Use Industry Investment Priorities
Chapter 14 Global Weigh Motion Geographic Market Outlook, 2024-2032
- 14.1 Regional Market Size and Share, 2024
- 14.2 Regional Market Forecast, 2024-2032
- 14.3 Regional Pricing, Production and Demand Differences
- 14.4 North America
- 14.4.1 United States
- 14.4.2 Canada
- 14.4.3 Mexico
- 14.5 Europe
- 14.5.1 Germany
- 14.5.2 France
- 14.5.3 Italy
- 14.5.4 United Kingdom
- 14.5.5 Spain
- 14.5.6 Poland
- 14.5.7 Russia
- 14.5.8 Netherlands
- 14.5.9 Belgium
- 14.5.10 Sweden
- 14.5.11 Denmark
- 14.5.12 Norway
- 14.5.13 Rest of Europe
- 14.6 Asia Pacific
- 14.6.1 China
- 14.6.2 India
- 14.6.3 Japan
- 14.6.4 South Korea
- 14.6.5 Thailand
- 14.6.6 Indonesia
- 14.6.7 Vietnam
- 14.6.8 Malaysia
- 14.6.9 Australia
- 14.6.10 Rest of Asia Pacific
- 14.7 Latin America
- 14.7.1 Brazil
- 14.7.2 Argentina
- 14.7.3 Colombia
- 14.7.4 Chile
- 14.7.5 Rest of Latin America
- 14.8 Middle East
- 14.8.1 Saudi Arabia
- 14.8.2 United Arab Emirates
- 14.8.3 Turkey
- 14.8.4 Israel
- 14.8.5 Iran
- 14.8.6 Rest of the Middle East
- 14.9 Africa
- 14.9.1 South Africa
- 14.9.2 Egypt
- 14.9.3 Nigeria
- 14.9.4 Morocco
- 14.9.5 Rest of Africa
- 14.10 Regional Investment, Policy and Supply Chain Differences
- 14.11 Regional Competitive Landscape
- 14.12 Geographic Growth Hotspots
Chapter 15 Global Weigh Motion Technology, Innovation and Sustainability Outlook
- 15.1 Technology Landscape and Maturity
- 15.2 Product, Process and Service Innovation
- 15.3 AI, Automation and Digital Tools in the Industry
- 15.4 Technology Adoption and Performance Benchmarking
- 15.5 Innovation Pipeline and R&D Investment
- 15.6 Patent and Intellectual Property Trends
- 15.7 Energy Efficiency and Resource Management
- 15.8 Sustainability, Recycling and Circularity
- 15.9 Technology Roadmap, 2024-2032
- 15.10 Risks of Obsolescence and Technology Substitution
Chapter 16 Global Weigh Motion Market Key Strategic Imperatives
- 16.1 Growth and Market Entry Priorities
- 16.2 High-Return Products and Segments
- 16.3 Pricing, Profitability and Cost Optimization
- 16.4 Technology Investment and Product Differentiation
- 16.5 Supply Chain Localization and Resilience
- 16.6 Distribution and Customer Acquisition
- 16.7 Partnership, Acquisition and Capacity Strategy
- 16.8 Regional Expansion Priorities
- 16.9 Short-, Medium- and Long-Term Actions
Chapter 17 Competition Outlook
- 17.1 Industry Competition Characteristics
- 17.2 Market Structure and Concentration
- 17.3 Market Share and Competitive Positioning, 2024
- 17.4 Company-Wise Revenue and Product Benchmarking
- 17.5 Production and Service Capacity Benchmarking
- 17.6 Technology, Pricing and Differentiation
- 17.7 Regional Footprint and Distribution Strength
- 17.8 Mergers, Acquisitions and Strategic Alliances
- 17.9 New Entrants and Competitive Threats
- 17.10 Porter's Five Forces and Industry Attractiveness
- 17.11 Competitive Outlook, 2024-2032
Chapter 18 Company Profiles
- 18.1 Company Coverage and Selection Criteria
- 18.2 Siemens AG
- 18.2.1 Business Description
- 18.2.2 Company Ownership and Geographic Presence
- 18.2.3 Product and Service Portfolio
- 18.2.4 Manufacturing and Operating Footprint
- 18.2.5 Production Capacity and Expansion Plans
- 18.2.6 Financial Performance and Investment
- 18.2.7 Market Share and Competitive Position
- 18.2.8 Technology and Innovation Capabilities
- 18.2.9 Strategic Alliances or Partnerships
- 18.2.10 Recent Developments
- 18.2.11 Growth Strategy and Outlook
- 18.3 Weighpoint Australia Pty Ltd
- 18.4 Traffic Technologies Ltd
- 18.5 Sicame Group
- 18.6 HIKOB
- 18.7 Highway Investment Corp
- 18.8 C3S
- 18.9 IDID
- 18.10 Apex Dynamics
- 18.11 International Road Dynamics Inc.
- 18.12 Other Relevant Market Participants
Note: Every listed company is profiled on the structure shown under the first company. The company list is preliminary and may change based on research findings, market developments, data availability and client requirements.
Chapter 19 Disclaimer
- 19.1 Research and Forecast Disclaimer
- 19.2 Data Source and Estimation Limitations
Note: The depth of individual sections depends on data availability for this market. Volume, capacity, trade and other unit-based metrics are included where applicable.