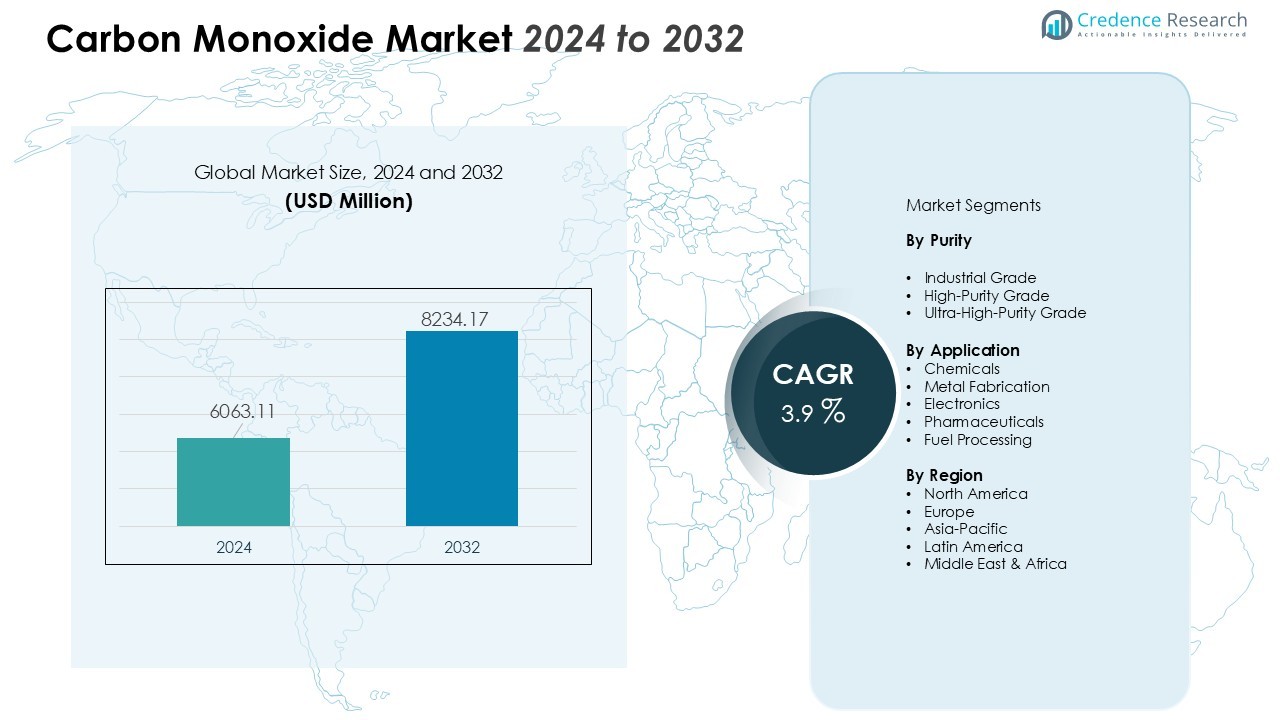
Home » Chemicals » Carbon Monoxide Market

Carbon Monoxide Market By Application Metal Fabrication, Chemicals, Ore Processing & Extraction, Pharma & Biotechnology, Electronics)-Growth, Future Prospects & Competitive Analysis, 2016 – 2030

Price: $4999

Published: | Report ID: 18029 | Report Format : PDF

Key Highlights of the Report

The global carbon monoxide market is segmented by application and region. Metal fabrication is the most popular primary application, with Asia Pacific leading the market growth.

The global carbon monoxide market has several drivers, including the rising demand from the sectors involved in the extraction and processing of metals. The global market is anticipated to experience significant expansion. In addition, carbon monoxide, a potent reducing agent in blast furnaces, is essential for the iron-extracting process. Furthermore, an increase in demand for organic and inorganic chemicals will fuel market expansion, as well as mining and metal extraction activities will increase, driving the market. However, prolonged exposure to the deadly gas carbon monoxide can cause death. It easily interacts with hemoglobin to form carboxyhemoglobin, which may interfere with gas exchange and increase the risk of death. The market expansion is anticipated to be hampered by this.

Nonetheless, the global carbon monoxide market offers significant growth opportunities, including one of the market’s key elements may be using carbon monoxide as a preservative in the food and beverage industry. Before packaging, all meat-based items, fish products, and salads are given a CO induction to lengthen their shelf lives.

Design Element 2

Access crucial information at unmatched prices!

Request your free sample report today & start making informed decisions powered by Credence Research!

Download Free Sample
CTA Design Element 3

Market Overview

The global carbon monoxide market has witnessed steady growth in recent years and is expected to continue growing at a CAGR of 3.50% between 2023 and 2030. The market was valued at USD 3.5 Billion in 2022 and is expected to reach USD 4.45 Billion in 2030.

What Are the Main Drivers of The Global Carbon Monoxide Market?

The global carbon monoxide market is driven by several factors, including the rising demand from the sectors involved in the extraction and processing of metals. The global market is anticipated to experience significant expansion. In addition, carbon monoxide, a potent reducing agent in blast furnaces, is essential for the iron-extracting process. Furthermore, an increase in demand for organic and inorganic chemicals will fuel market expansion, as well as Mining and metal extraction activities will increase, driving the market.

What Are the Major Challenges Faced by The Global Carbon Monoxide Market?

The global carbon monoxide market also faces several challenges, including prolonged exposure to the deadly gas carbon monoxide can cause death. It easily interacts with hemoglobin to form carboxyhemoglobin, which may interfere with gas exchange and increase the risk of death. The market expansion is anticipated to be hampered by this.

What Are the Growth Opportunities in The Global Carbon Monoxide Market?

The global carbon monoxide market offers significant growth opportunities, including one of the key elements of the market that may be using carbon monoxide as a preserving agent in the food and beverage industry. Before packaging, all meat-based items, fish products, and salads are given a CO induction to lengthen their shelf lives.

Executive Summary

Overview of the Global Carbon Monoxide Market

The rising popularity of packaged foods and carbonated beverages and the use of oxidation removal as a reducing agent in metal products are some of the main drivers driving the carbon monoxide market’s revenue. Carbon monoxide is frequently used in the chemical industry to make intermediates, inorganic compounds, and organic chemicals. The metals and minerals sector uses carbon monoxide as a reducing agent during the refining process. Carbon monoxide gas is utilized in food and beverage distribution, notably for meat and fish items, to retain wholesomeness and flexibility. In medicine, carbon monoxide is also employed as an ingredient. All these factors are driving the market growth.

Market Definition

Carbon monoxide is a toxic gas with no flavor or smell and is less dense than air. The most common method of producing carbon monoxide is steam reforming natural gas. Other methods for producing carbon monoxide include incomplete combustion of organic fossil fuels, including oil, gas, coal, wood, and others with little oxygen present. In addition, carbon dioxide is reduced over hot coke, formic acid is dehydrated with sulfuric acid, and carbon and oxygen react at high temperatures.

Market Insights

  • The global demand for carbon monoxides was valued at USD 3.5 Billion in 2022 and is expected to reach USD 4.45 Billion in 2030, growing at a CAGR of 3.50% between 2023 and 2030.
  • Metal fabrication is the leading segment by application and held over 43% share in terms of value in 2022, while the chemicals segment is likely to exhibit the fastest CAGR during the forecast period.
  • Asia Pacific is fueling the growth of the carbon monoxide industry with over one-third share in 2022, while North America and Europe collectively account for just under 40% share in 2022. Europe held over 22% share in 2022.
  • As more electronics are manufactured in the area, there may be a greater need for carbon monoxide because high-purity carbon monoxide is utilized as a semiconductor in various electronic equipment.
  • High demand from businesses engaged in the extraction and processing of metals will foster regional market expansion. A sizable manufacturing base for end-user sectors, including chemical and pharmaceutical products, will aid the region’s growth.

Segmentation by Applications

  • Metal fabrication is the leading segment by applications and will hold over 43% share in value in 2022.
  • The chemicals segment will likely exhibit the fastest CAGR during the forecast period.
  • Ore processing & extraction is another segment but contributes very little to the global carbon monoxide market compared to the metal fabrication and chemicals segments.

Segmentation by Region

  • Asia Pacific is fueling the growth of the carbon monoxide industry with over one-third share in 2022.
  • North America and Europe collectively account for just under 40% share in 2022, with Europe holding over 22% share in the same year.
  • The rest of the World, including Latin America, The Middle East, and Africa, contributes the remainder to the demand for carbon monoxides.

In the form of producer gas or water gas, it is frequently used as a fuel in industrial processes. The gas is a potent reducer as well. For example, when hot iron oxides are exposed to carbon monoxide, the iron oxides are reduced to metallic iron while the carbon monoxide is oxidized to carbon dioxide. Reducing agents’ ability to get rid of rust helps extend the life and utility of metal products. Due to the wide range of industrial and manufacturing applications for carbon monoxide, market demand and revenue growth are rising.

The United States is one of North America’s largest markets for carbon monoxides, with a significant market share. In the area, chemical manufacture and use in the food and beverage industry are prevalent, and commercial use of carbon monoxide is well established. The demand for milk in the United States is roughly equivalent to that for packaged food goods and carbonated soft beverages, which contain carbon monoxide as a main component. Other factors influencing the market’s revenue growth during the forecast period include increased research and development initiatives to maximize the usage of preservatives in the region.

China is also a major market for carbon monoxides in the Asia Pacific region, with a significant market share. Given that high-purity carbon monoxide is utilized as a semiconductor in various electronic appliances, rising demand for the fabrication of electronics in the area may result in a rise in the requirement for carbon monoxide. The region’s carbon monoxide market will experience revenue growth over the projected period due to China’s economic dominance in the electronic manufacturing sector, rising R&D activities, and adoption of technologically advanced production methods.

Overall, the increasing demand for carbon monoxides can be attributed to the growing wide range of manufacturing and industrial applications, which drives up demand and sales offered by carbon monoxides.

While the carbon monoxide market is growing, it faces challenges from carbon monoxide’s toxic nature; carbon monoxide consumption can be dangerous if it is excessive. CO is widely used as a supplement to keep foods from spoiling and is a chemical-building ingredient in some medications and painkillers, but if consumed in excess, it can cause blood poisoning.

Organic and Inorganic Chemicals’ Growing Demand Will Drive Market Growth

The carbon monoxide market is anticipated to expand significantly by the end of the forecast period. As a reducing agent, forming many organic and inorganic compounds is essential. The need for chemicals is rising due to increased demand from construction, food and beverage, medicines, and bulk chemical manufacturing sectors. Carbon monoxide, a key industrial component, creates water gas or syngas.

This industrial gas, for example, is used in packaging for meat and fish. The packaging for meat and fish utilises a combination of high concentrations of CO2 and low concentrations of CO to prevent the growth of germs, according to the National Centre of Biotechnology Information in the United States. The market is expected to grow as a result of rising demand for goods in both pure and syngas forms from a variety of end-use sectors.

Market Growth Will Come from Increasing Mining and Metal Extraction Activities

Mining and metal extraction activities have significantly increased over the past ten years. The market for the product is anticipated to increase due to the high demand for iron ore and iron metallic from different end sectors around the world. Demand is anticipated to increase due to exceptional qualities, such as a high affinity towards transition metals. It is mostly utilized to extract metals and exhibits neither acidic nor basic characteristics. Forty-eight thousand metric tonnes of iron ore were produced in the United States in 2019, according to the United States Geological Survey (USGS). The market is anticipated to increase due to the high demand for metal extraction and purification product.

The Gas’ Poisonous Nature may Impede the Development of the Market

Prolonged exposure to the deadly gas carbon monoxide can cause death. It easily interacts with hemoglobin to form carboxyhemoglobin, which may interfere with gas exchange and increase the risk of death. The market expansion is anticipated to be hampered by this.

Carbon Monoxide Use Too Frequently Might Be Dangerous.

Carbon monoxide abuse can have catastrophic consequences. In addition to being a chemical component of some medicines and painkillers, CO is frequently used as a supplement to keep foods from spoiling. If consumed in excess, however, it can cause blood poisoning. It is possible to experience severe stomach and brain pain, shortness of breath, and nausea when carbon monoxide replaces the oxygen-carrying hemoglobin in the blood. Oxygen would be given to the sufferer as soon as possible. When poisoning is advanced, the patient may die even if it does not show symptoms initially. When handling and using chemicals in factories and other equipment that uses petrol in any capacity, vigilance must be exercised. Another factor that is anticipated to significantly impede revenue growth in the global carbon monoxide market over the forecast period is the deadly nature of the gas, which makes it impossible to detect through smell or fumes.

Carbon Monoxide Market

Increasing Syngas Adoption to Support Market

Solid fuels are again receiving interest due to a shortage of conservative petroleum supplies and advancements in solid-to-gas conversion technologies. Gasification is the most reliable and energy-efficient conversion technology, which benefits both upstream and downstream flexibility. Syngas is a mixture of carbon monoxide (60–65%), hydrogen (25–30%), methane, and carbon dioxide (in trace amounts). It is also known as water gas or synthesis gas. In a number of industrial operations, syngas is used as a fuel. It is likewise made from biomass and solid waste, and it is a carbon-neutral fuel to be used in future engines.

During World War II, syngas was widely employed for spark-ignition engines. Compared to compressed natural gas (CNG), it has a faster laminar flame pace. Syngas usage as an industrial fuel gas will increase, creating market opportunities.

Shape Your Report to Specific Countries or Regions & Enjoy 30% Off!

Carbon Monoxide is Used as a Preservative in the food and beverage industry.

Carbon monoxide used as a preservative in the food and beverage industry has the potential to become a significant market factor. Before packaging, all types of meat-based items, fish products, and salads are exposed to CO; this practice extends the shelf life of these goods. The epidemic has demonstrated a growing demand for packaged, healthy food, that fresh and organic packaged food is rising, and that people are becoming more health-prone. Additionally, the requirement for these products to be available throughout the year means that the shelf life and packaging must be cost-effective and long-lasting to meet growing demand. Preservative demand is anticipated further to open up new business opportunities for large corporations and promote market revenue growth.

Competitive Landscape

Key Players

The global carbon monoxide market is highly competitive, with several key players. Some of the major players in the market and their market share are as follows:

  • Air Liquide (Paris, France)
  • Linde Plc. (Dublin, Ireland)
  • Air Products (Pennsylvania, U.S.)
  • Praxair (Connecticut, U.S.)
  • American Gas Products (Massachusetts, U.S.)
  • Sipchem (Al Khobar, Saudi Arabia)
  • Messer (Bad Soden, Germany)
  • Tosoh (Tokyo, Japan)

These companies focus on product innovation, expanding their distribution channels, and mergers and acquisitions to stay ahead in the market.

The major global carbon monoxide market players constantly strive to stay ahead by introducing new products and innovations.

To supply hydrogen and carbon monoxide to the nearby industrial operations of Hunstman, Air Products announced that the steam methane reformer and cold box in Geismar are now operational.

The smart smoke and CO alarm from Google Nest, which warns you once on your phone about any anomaly, has been released, boosting sales of smoke and carbon monoxide detectors globally.

Celanese Corporation and Linde PLC announced the project in February 2022 to produce more methanol at a cheaper cost and with lower carbon intensity. To create this and lessen the environment’s impact and carbon footprint, carbon monoxide and carbon dioxide must be captured from the surrounding air.

Summary of Key Findings

  • Growing wide range industrial use offered by carbon monoxides driving market growth
  • Market segmented by application and region.
  • Metal fabrication is the most popular, with primary user segments.
  • Asia Pacific is leading market growth; the market is highly competitive with key players including Air Liquide (Paris, France), Linde Plc. (Dublin, Ireland), Air Products (Pennsylvania, U.S.), Praxair (Connecticut, U.S.), American Gas Products (Massachusetts, U.S.), Sipchem (Al Khobar, Saudi Arabia), Messer (Bad Soden, Germany), and Tosoh (Tokyo, Japan)

Future Outlook

  • Positive outlook for the global carbon monoxide market with significant growth potential in the Asia Pacific region
  • Increasing adoption of carbon monoxides in the industrial sector and innovative distribution channels such as e-commerce to drive growth
  • Challenges from the poisonous nature of the gas could impede the market’s growth.
  • Key players to focus on product innovation, expanding market reach and maintaining competitive pricing to stay ahead.

Segmentation

  • By Application
    • Metal Fabrication
    • Chemicals
    • Ore Processing & Extraction
    • Pharma & Biotechnology
    • Electronics
  • By Region
  • North America
    • The US.
    • Canada
    • Mexico
  • Europe
    • Germany
    • France
    • The U.K.
    • Italy
    • Spain
    • Rest of Europe
  • Asia Pacific
    • China
    • Japan
    • India
    • South Korea
    • South-east Asia
    • Rest of Asia Pacific
  • Latin America
    • Brazil
    • Argentina
    • Rest of Latin America
  • Middle East & Africa
    • GCC Countries
    • South Africa
    • Rest of the Middle East and Africa

1. Preface
1.1. Report Description
1.1.1. Purpose of the Report
1.1.2. Target Audience
1.1.3. USP and Key Offerings
1.2. Research Scope
1.3. Research Methodology
1.3.1. Phase I – Secondary Research
1.3.2. Phase II – Data Modelling
1.3.2.1. Company Share Analysis Model
1.3.2.2. Revenue Based Modelling
1.3.3. Phase III – Primary Research
1.3.4. Research Limitations
1.3.5. Assumptions
1.4. Market Introduction
1.5. Market Research Scope

2. Executive Summary
2.1. Market Snapshot: Global Carbon Monoxide Market
2.2. Global Carbon Monoxide Market, By Application
2.3. Global Carbon Monoxide Market, By Region

3. Market Dynamics & Factors Analysis
3.1. Introduction
3.1.1. Global Carbon Monoxide Market Value, 2017-2030, (US$ Bn)
3.1.2. Global Carbon Monoxide Market Volume, 2017-2030, (Kilo Tons)
3.1.3. Y-o-Y Growth Trend Analysis
3.2. Market Dynamics
3.2.1. Market Drivers
3.2.1.1. Driver 1
3.2.1.2. Driver 2
3.2.1.3. Driver 3
3.2.2. Market Restraints
3.2.2.1. Restraint 1
3.2.2.2. Restraint 2
3.2.3. Market Opportunities
3.2.3.1. Opportunity 1
3.2.3.2. Opportunity 2
3.2.4. Major Industry Challenges
3.2.4.1. Challenge 1
3.2.4.2. Challenge 2
3.3. Growth and Development Patterns
3.4. Investment Feasibility Analysis
3.5. Market Opportunity Analysis
3.5.1. Technology
3.5.2. Mode of Sales
3.5.3. Application
3.5.4. Geography

4. Premium Insights
4.1. STAR (Situation, Task, Action, Results) Analysis
4.2. Porter’s Five Forces Analysis
4.2.1. Threat of New Entrants
4.2.2. Bargaining Power of Buyers/Consumers
4.2.3. Bargaining Power of Suppliers
4.2.4. Threat of Substitute Types
4.2.5. Intensity of Competitive Rivalry
4.3. Key Market Trends
4.3.1. Demand Side Trends
4.3.2. Supply Side Trends
4.4. Value Chain Analysis
4.5. Technology Analysis
4.6. Analysis and Recommendations
4.7. Marketing Strategy Analysis
4.7.1. Direct Marketing
4.7.2. Indirect Marketing
4.7.3. Marketing Channel Development Trend

5. Import Export Analysis
5.1. Import Analysis by Region
5.1.1. Global Carbon Monoxide Market Import Volume, By Region, 2017-2022 (Kilo Tons)
5.2. Export Analysis by Region
5.2.1. Global Carbon Monoxide Market Export Volume, By Region, 2017-2022 (Kilo Tons)

6. Demand-Supply Analysis
6.1. Demand Analysis by Region
6.1.1. Global Carbon Monoxide Market Demand Volume, By Region, 2017-2022 (Kilo Tons)
6.2. Supply Analysis by Region
6.2.1. Global Carbon Monoxide Market Supply Volume, By Region, 2017-2022 (Kilo Tons)

7. Pricing Analysis
7.1. Average Price of Carbon Monoxides by Region, 2017-2022 (USD/Unit)
7.2. Average Price of Carbon Monoxides by Region, 2023-2030 (USD/Unit)

8. Market Positioning of Key Players, 2022
8.1. Company market share of key players, 2022
8.2. Competitive Benchmarking
8.3. Market Positioning of Key Vendors
8.4. Geographical Presence Analysis
8.5. Major Strategies Adopted by Key Players
8.5.1. Key Strategies Analysis
8.5.2. Mergers and Acquisitions
8.5.3. Partnerships
8.5.4. Product Launch
8.5.5. Geographical Expansion
8.5.6. Others

9. Economic Impact Analysis
9.1. Recession Impact
9.1.1. North America
9.1.2. Europe
9.1.3. Asia Pacific
9.1.4. Latin America
9.1.5. Middle East and Africa
9.2. Ukraine-Russia War Impact
9.2.1. North America
9.2.2. Europe
9.2.3. Asia Pacific
9.2.4. Latin America
9.2.5. Middle East and Africa
9.3. COVID-19 Impact Analysis
9.3.1. North America
9.3.2. Europe
9.3.3. Asia Pacific
9.3.4. Latin America
9.3.5. Middle East and Africa

10. Global Carbon Monoxide Market, by Application, 2017-2030 (US$ Bn)
10.1. Global Carbon Monoxide Market Overview, by Application
10.1.1. Global Carbon Monoxide Market, By Application, 2022 vs 2030 (in%)
10.2. Metal Fabrication
10.2.1. Global Carbon Monoxide Market, By Region, 2017-2030 (US$ Bn)
10.2.2. Global Carbon Monoxide Market, By Region, 2017-2030 (Kilo Tons)
10.3. Chemicals
10.3.1. Global Carbon Monoxide Market, By Region, 2017-2030 (US$ Bn)
10.3.2. Global Carbon Monoxide Market, By Region, 2017-2030 (Kilo Tons)
10.4. Ore Processing & Extraction
10.4.1. Global Carbon Monoxide Market, By Region, 2017-2030 (US$ Bn)
10.4.2. Global Carbon Monoxide Market, By Region, 2017-2030 (Kilo Tons)
10.5. Pharma & Biotechnology
10.5.1. Global Carbon Monoxide Market, By Region, 2017-2030 (US$ Bn)
10.5.2. Global Carbon Monoxide Market, By Region, 2017-2030 (Kilo Tons)
10.6. Electronics
10.6.1. Global Carbon Monoxide Market, By Region, 2017-2030 (US$ Bn)
10.6.2. Global Carbon Monoxide Market, By Region, 2017-2030 (Kilo Tons)

11. Global Carbon Monoxide Market, By Region
11.1. Global Carbon Monoxide Market Overview, by Region
11.1.1. Global Carbon Monoxide Market Revenue, By Region, 2022 vs 2030 (in%)
11.1.2. Global Carbon Monoxide Market Volume, By Region, 2022 vs 2030 (in%)
11.2. Application
11.2.1. Global Carbon Monoxide Market, By Application, 2017-2030 (US$ Bn)
11.2.2. Global Carbon Monoxide Market, By Application, 2017-2030 (Kilo Tons)

12. North America Carbon Monoxide Market Analysis
12.1. North America Carbon Monoxide Market, by Application, 2017-2030(US$ Bn)
12.1.1. Overview
12.1.2. SRC Analysis
12.2. North America Carbon Monoxide Market, by Application, 2017-2030 (Kilo Tons)
12.2.1. Overview
12.2.2. SRC Analysis
12.3. North America Carbon Monoxide Market, by Country, 2017-2030 (US$ Bn)
12.3.1. North America Carbon Monoxide Market Revenue, by Country, 2022 Vs 2030 (in%)
12.3.2. North America Carbon Monoxide Market Volume, by Country, 2022 Vs 2030 (in%)
12.3.3. U.S.
12.3.3.1. U.S. Carbon Monoxide Market Estimates and Forecast, 2017-2030 (US$ Bn)
12.3.3.2. U.S. Carbon Monoxide Market Estimates and Forecast, 2017-2030 (Kilo Tons)
12.3.3.3. U.S. Carbon Monoxide, By Application, 2017-2030 (US$ Bn)
12.3.3.4. U.S. Carbon Monoxide, By Application, 2017-2030 (Kilo Tons)
12.3.4. Canada
12.3.4.1. Canada Carbon Monoxide Market Estimates and Forecast, 2017-2030 (US$ Bn)
12.3.4.2. Canada Carbon Monoxide Market Estimates and Forecast, 2017-2030 (Kilo Tons)
12.3.4.3. Canada Carbon Monoxide, By Application, 2017-2030 (US$ Bn)
12.3.4.4. Canada Carbon Monoxide, By Application, 2017-2030 (Kilo Tons)
12.3.5. Mexico
12.3.5.1. Mexico Carbon Monoxide Market Estimates and Forecast, 2017-2030 (US$ Bn)
12.3.5.2. Mexico Carbon Monoxide Market Estimates and Forecast, 2017-2030 (Kilo Tons)
12.3.5.3. Mexico Carbon Monoxide, By Application, 2017-2030 (US$ Bn)
12.3.5.4. Mexico Carbon Monoxide, By Application, 2017-2030 (Kilo Tons)

13. Europe Carbon Monoxide Market Analysis
13.1. Europe Carbon Monoxide Market, by Application, 2017-2030(US$ Bn)
13.1.1. Overview
13.1.2. SRC Analysis
13.2. Europe Carbon Monoxide Market, by Application, 2017-2030(Kilo Tons)
13.2.1. Overview
13.2.2. SRC Analysis
13.3. Europe Carbon Monoxide Market, by Country, 2017-2030 (US$ Bn)
13.3.1. Europe Carbon Monoxide Market Revenue, by Country, 2022 Vs 2030 (in%)
13.3.2. Europe Carbon Monoxide Market Volume, by Country, 2022 Vs 2030 (in%)
13.3.3. Germany
13.3.3.1. Germany Carbon Monoxide Market Estimates and Forecast, 2017-2030 (US$ Bn)
13.3.3.2. Germany Carbon Monoxide Market Estimates and Forecast, 2017-2030 (Kilo Tons)
13.3.3.3. Germany Carbon Monoxide, By Application, 2017-2030 (US$ Bn)
13.3.3.4. Germany Carbon Monoxide, By Application, 2017-2030 (Kilo Tons)
13.3.4. France
13.3.4.1. France Carbon Monoxide Market Estimates and Forecast, 2017-2030 (US$ Bn)
13.3.4.2. France Carbon Monoxide Market Estimates and Forecast, 2017-2030 (Kilo Tons)
13.3.4.3. France Carbon Monoxide, By Application, 2017-2030 (US$ Bn)
13.3.4.4. France Carbon Monoxide, By Application, 2017-2030 (Kilo Tons)
13.3.5. U.K.
13.3.5.1. U.K. Carbon Monoxide Market Estimates and Forecast, 2017-2030 (US$ Bn)
13.3.5.2. U.K. Carbon Monoxide Market Estimates and Forecast, 2017-2030 (Kilo Tons)
13.3.5.3. U.K. Carbon Monoxide, By Application, 2017-2030 (US$ Bn)
13.3.5.4. U.K. Carbon Monoxide, By Application, 2017-2030 (Kilo Tons)
13.3.6. Italy
13.3.6.1. Italy Carbon Monoxide Market Estimates and Forecast, 2017-2030 (US$ Bn)
13.3.6.2. Italy Carbon Monoxide Market Estimates and Forecast, 2017-2030 (Kilo Tons)
13.3.6.3. Italy Carbon Monoxide, By Application, 2017-2030 (US$ Bn)
13.3.6.4. Italy Carbon Monoxide, By Application, 2017-2030 (Kilo Tons)
13.3.7. Spain
13.3.7.1. Spain Carbon Monoxide Market Estimates and Forecast, 2017-2030 (US$ Bn)
13.3.7.2. Spain Carbon Monoxide Market Estimates and Forecast, 2017-2030 (Kilo Tons)
13.3.7.3. Spain Carbon Monoxide, By Application, 2017-2030 (US$ Bn)
13.3.7.4. Spain Carbon Monoxide, By Application, 2017-2030 (Kilo Tons)
13.3.8. Rest of Europe
13.3.8.1. Rest of Europe Carbon Monoxide Market Estimates and Forecast, 2017-2030 (US$ Bn)
13.3.8.2. Rest of Europe Carbon Monoxide Market Estimates and Forecast, 2017-2030 (Kilo Tons)
13.3.8.3. Rest of Europe Carbon Monoxide, By Application, 2017-2030 (US$ Bn)
13.3.8.4. Rest of Europe Carbon Monoxide, By Application, 2017-2030 (Kilo Tons)

14. Asia Pacific Carbon Monoxide Market Analysis
14.1. Asia Pacific Carbon Monoxide Market, by Application, 2017-2030(US$ Bn)
14.1.1. Overview
14.1.2. SRC Analysis
14.2. Asia Pacific Carbon Monoxide Market, by Application, 2017-2030(Kilo Tons)
14.2.1. Overview
14.2.2. SRC Analysis
14.3. Asia Pacific Carbon Monoxide Market, by Country, 2017-2030 (US$ Bn)
14.3.1. Asia Pacific Carbon Monoxide Market Revenue, by Country, 2022 Vs 2030 (in%)
14.3.2. Asia Pacific Carbon Monoxide Market Volume, by Country, 2022 Vs 2030 (in%)
14.3.3. China
14.3.3.1. China Carbon Monoxide Market Estimates and Forecast, 2017-2030 (US$ Bn)
14.3.3.2. China Carbon Monoxide Market Estimates and Forecast, 2017-2030 (Kilo Tons)
14.3.3.3. China Carbon Monoxide, By Application, 2017-2030 (US$ Bn)
14.3.3.4. China Carbon Monoxide, By Application, 2017-2030 (Kilo Tons)
14.3.4. Japan
14.3.4.1. Japan Carbon Monoxide Market Estimates and Forecast, 2017-2030 (US$ Bn)
14.3.4.2. Japan Carbon Monoxide Market Estimates and Forecast, 2017-2030 (Kilo Tons)
14.3.4.3. Japan Carbon Monoxide, By Application, 2017-2030 (US$ Bn)
14.3.4.4. Japan Carbon Monoxide, By Application, 2017-2030 (Kilo Tons)
14.3.5. India
14.3.5.1. India Carbon Monoxide Market Estimates and Forecast, 2017-2030 (US$ Bn)
14.3.5.2. India Carbon Monoxide Market Estimates and Forecast, 2017-2030 (Kilo Tons)
14.3.5.3. India Carbon Monoxide, By Application, 2017-2030 (US$ Bn)
14.3.5.4. India Carbon Monoxide, By Application, 2017-2030 (Kilo Tons)
14.3.6. South Korea
14.3.6.1. South Korea Carbon Monoxide Market Estimates and Forecast, 2017-2030 (US$ Bn)
14.3.6.2. South Korea Carbon Monoxide Market Estimates and Forecast, 2017-2030 (Kilo Tons)
14.3.6.3. South Korea Carbon Monoxide, By Application, 2017-2030 (US$ Bn)
14.3.6.4. South Korea Carbon Monoxide, By Application, 2017-2030 (Kilo Tons)
14.3.7. South-East Asia
14.3.7.1. South-East Asia Carbon Monoxide Market Estimates and Forecast, 2017-2030 (US$ Bn)
14.3.7.2. South-East Asia Carbon Monoxide Market Estimates and Forecast, 2017-2030 (Kilo Tons)
14.3.7.3. South-East Asia Carbon Monoxide, By Application, 2017-2030 (US$ Bn)
14.3.7.4. South-East Asia Carbon Monoxide, By Application, 2017-2030 (Kilo Tons)
14.3.8. Rest of Asia Pacific
14.3.8.1. Rest of Asia Pacific Carbon Monoxide Market Estimates and Forecast, 2017-2030 (US$ Bn)
14.3.8.2. Rest of Asia Pacific Carbon Monoxide Market Estimates and Forecast, 2017-2030 (Kilo Tons)
14.3.8.3. Rest of Asia Pacific Carbon Monoxide, By Application, 2017-2030 (US$ Bn)
14.3.8.4. Rest of Asia Pacific Carbon Monoxide, By Application, 2017-2030 (Kilo Tons)
15. Latin America Carbon Monoxide Market Analysis

15.1. Latin America Carbon Monoxide Market, by Application, 2017-2030(US$ Bn)
15.1.1. Overview
15.1.2. SRC Analysis
15.2. Latin America Carbon Monoxide Market, by Application, 2017-2030(Kilo Tons)
15.2.1. Overview
15.2.2. SRC Analysis
15.3. Latin America Carbon Monoxide Market, by Country, 2017-2030 (US$ Bn)
15.3.1. Latin America Carbon Monoxide Market Revenue, by Country, 2022 Vs 2030 (in%)
15.3.2. Latin America Carbon Monoxide Market Volume, by Country, 2022 Vs 2030 (in%)
15.3.3. Brazil
15.3.3.1. Brazil Carbon Monoxide Market Estimates and Forecast, 2017-2030 (US$ Bn)
15.3.3.2. Brazil Carbon Monoxide Market Estimates and Forecast, 2017-2030 (Kilo Tons)
15.3.3.3. Brazil Carbon Monoxide, By Application, 2017-2030 (US$ Bn)
15.3.3.4. Brazil Carbon Monoxide, By Application, 2017-2030 (Kilo Tons)
15.3.4. Argentina
15.3.4.1. Argentina Carbon Monoxide Market Estimates and Forecast, 2017-2030 (US$ Bn)
15.3.4.2. Argentina Carbon Monoxide Market Estimates and Forecast, 2017-2030 (Kilo Tons)
15.3.4.3. Argentina Carbon Monoxide, By Application, 2017-2030 (US$ Bn)
15.3.4.4. Argentina Carbon Monoxide, By Application, 2017-2030 (Kilo Tons)
15.3.5. Rest of Latin America
15.3.5.1. Rest of Latin America Carbon Monoxide Market Estimates and Forecast, 2017-2030 (US$ Bn)
15.3.5.2. Rest of Latin America Carbon Monoxide Market Estimates and Forecast, 2017-2030 (Kilo Tons)
15.3.5.3. Rest of Latin America Carbon Monoxide, By Application, 2017-2030 (US$ Bn)
15.3.5.4. Rest of Latin America Carbon Monoxide, By Application, 2017-2030 (Kilo Tons)

16. Middle East and Africa Carbon Monoxide Market Analysis
16.1. Middle East and Africa Carbon Monoxide Market, by Application, 2017-2030(US$ Bn)
16.1.1. Overview
16.1.2. SRC Analysis
16.2. Middle East and Africa Carbon Monoxide Market, by Application, 2017-2030(Kilo Tons)
16.2.1. Overview
16.2.2. SRC Analysis
16.3. Middle East and Africa Carbon Monoxide Market, by Country, 2017-2030 (US$ Bn)
16.3.1. Middle East and Africa Carbon Monoxide Market Revenue, by Country, 2022 Vs 2030 (in%)
16.3.2. Middle East and Africa Carbon Monoxide Market Volume, by Country, 2022 Vs 2030 (in%)
16.3.3. GCC Countries
16.3.3.1. GCC Countries Carbon Monoxide Market Estimates and Forecast, 2017-2030 (US$ Bn)
16.3.3.2. GCC Countries Carbon Monoxide Market Estimates and Forecast, 2017-2030 (Kilo Tons)
16.3.3.3. GCC Countries Carbon Monoxide, By Application, 2017-2030 (US$ Bn)
16.3.3.4. GCC Countries Carbon Monoxide, By Application, 2017-2030 (Kilo Tons)
16.3.4. South Africa
16.3.4.1. South Africa Carbon Monoxide Market Estimates and Forecast, 2017-2030 (US$ Bn)
16.3.4.2. South Africa Carbon Monoxide Market Estimates and Forecast, 2017-2030 (Kilo Tons)
16.3.4.3. South Africa Carbon Monoxide, By Application, 2017-2030 (US$ Bn)
16.3.4.4. South Africa Carbon Monoxide, By Application, 2017-2030 (Kilo Tons)
16.3.5. Rest of Middle East and Africa
16.3.5.1. Rest of Middle East and Africa Carbon Monoxide Market Estimates and Forecast, 2017-2030 (US$ Bn)
16.3.5.2. Rest of Middle East and Africa Carbon Monoxide Market Estimates and Forecast, 2017-2030 (Kilo Tons)
16.3.5.3. Rest of Middle East and Africa Carbon Monoxide, By Application, 2017-2030 (US$ Bn)
16.3.5.4. Rest of Middle East and Africa Carbon Monoxide, By Application, 2017-2030 (Kilo Tons)

17. Company Profiles
17.1. Air Liquide (Paris, France)
17.1.1. Company Overview
17.1.2. Products/Services Portfolio
17.1.3. Geographical Presence
17.1.4. Financial Summary
17.1.4.1. Market Revenue and Net Profit (2019-2022)
17.1.4.2. Business Segment Revenue Analysis
17.1.4.3. Geographical Revenue Analysis
17.2. Linde Plc. (Dublin, Ireland)
17.3. Air Products (Pennsylvania, U.S.)
17.4. Praxair (Connecticut, U.S.)
17.5. American Gas Products (Massachusetts, U.S.)
17.6. Sipchem (Al Khobar, Saudi Arabia)
17.7. Messer (Bad Soden, Germany)
17.8. Tosoh (Tokyo, Japan)

List of Figures
FIG. 1 Global Carbon Monoxide Market: Research Methodology
FIG. 2 Market Size Estimation – Top Down & Bottom up Approach
FIG. 3 Global Carbon Monoxide Market Segmentation
FIG. 4 Global Carbon Monoxide Market, by Application, 2022 (US$ Bn) (Kilo Tons)
FIG. 5 Global Carbon Monoxide Market, by Geography, 2022 (US$ Bn) (Kilo Tons)
FIG. 6 Attractive Investment Proposition, by Application, 2022
FIG. 7 Attractive Investment Proposition, by Geography, 2022
FIG. 8 Global Market Share Analysis of Key Carbon Monoxide Market Manufacturers, 2022
FIG. 9 Global Market Positioning of Key Carbon Monoxide Market Manufacturers, 2022
FIG. 10 Global Carbon Monoxide Market Value Contribution, By Application, 2022 & 2030 (Value %)
FIG. 11 Global Carbon Monoxide Market, by Metal Fabrication, Value, 2017-2030 (US$ Bn) (Kilo Tons)
FIG. 12 Global Carbon Monoxide Market, by Chemicals, 2017-2030 (US$ Bn) (Kilo Tons)
FIG. 13 Global Carbon Monoxide Market, by Ore Processing & Extraction, 2017-2030 (US$ Bn) (Kilo Tons)
FIG. 14 Global Carbon Monoxide Market, by Pharma & Biotechnology, 2017-2030 (US$ Bn) (Kilo Tons)
FIG. 15 Global Carbon Monoxide Market, by Electronics, 2017-2030 (US$ Bn) (Kilo Tons)
FIG. 16 North America Carbon Monoxide Market, 2017-2030 (US$ Bn) (Kilo Tons)
FIG. 17 U.S. Carbon Monoxide Market, 2017-2030 (US$ Bn) (Kilo Tons)
FIG. 18 Canada Carbon Monoxide Market, 2017-2030 (US$ Bn) (Kilo Tons)
FIG. 19 Europe Carbon Monoxide Market, 2017-2030 (US$ Bn) (Kilo Tons)
FIG. 20 Germany Carbon Monoxide Market, 2017-2030 (US$ Bn) (Kilo Tons)
FIG. 21 France Carbon Monoxide Market, 2017-2030 (US$ Bn) (Kilo Tons)
FIG. 22 U.K. Carbon Monoxide Market, 2017-2030 (US$ Bn) (Kilo Tons)
FIG. 23 Italy Carbon Monoxide Market, 2017-2030 (US$ Bn) (Kilo Tons)
FIG. 24 Spain Carbon Monoxide Market, 2017-2030 (US$ Bn) (Kilo Tons)
FIG. 25 Rest of Europe Carbon Monoxide Market, 2017-2030 (US$ Bn) (Kilo Tons)
FIG. 26 Asia Pacific Carbon Monoxide Market, 2017-2030 (US$ Bn) (Kilo Tons)
FIG. 27 China Carbon Monoxide Market, 2017-2030 (US$ Bn) (Kilo Tons)
FIG. 28 Japan Carbon Monoxide Market, 2017-2030 (US$ Bn) (Kilo Tons)
FIG. 29 India Carbon Monoxide Market, 2017-2030 (US$ Bn) (Kilo Tons)
FIG. 30 South Korea Carbon Monoxide Market, 2017-2030 (US$ Bn) (Kilo Tons)
FIG. 31 South-East Asia Carbon Monoxide Market, 2017-2030 (US$ Bn) (Kilo Tons)
FIG. 32 Rest of Asia Pacific Carbon Monoxide Market, 2017-2030 (US$ Bn) (Kilo Tons)
FIG. 33 Latin America Carbon Monoxide Market, 2017-2030 (US$ Bn) (Kilo Tons)
FIG. 34 Brazil Carbon Monoxide Market, 2017-2030 (US$ Bn) (Kilo Tons)
FIG. 35 Mexico Carbon Monoxide Market, 2017-2030 (US$ Bn) (Kilo Tons)
FIG. 36 Rest of Latin America Carbon Monoxide Market, 2017-2030 (US$ Bn) (Kilo Tons)
FIG. 37 Middle East & Africa Carbon Monoxide Market, 2017-2030 (US$ Bn) (Kilo Tons)
FIG. 38 GCC Countries Carbon Monoxide Market, 2017-2030 (US$ Bn) (Kilo Tons)
FIG. 39 South Africa Carbon Monoxide Market, 2017-2030 (US$ Bn) (Kilo Tons)
FIG. 40 Rest of Middle East and Africa Carbon Monoxide Market, 2017-2030 (US$ Bn) (Kilo Tons)

List of Tables
TABLE 1 Market Snapshot: Global Carbon Monoxide Market
TABLE 2 Global Carbon Monoxide Market: Market Drivers Impact Analysis
TABLE 3 Global Carbon Monoxide Market: Market Restraints Impact Analysis
TABLE 4 Global Carbon Monoxide Market, by Competitive Benchmarking, 2022
TABLE 5 Global Carbon Monoxide Market, by Geographical Presence Analysis, 2022
TABLE 6 Global Carbon Monoxide Market, by Key Strategies Analysis, 2022
TABLE 7 Global Carbon Monoxide Market, by Metal Fabrication, By Region, 2017-2022 (US$ Bn)
TABLE 8 Global Carbon Monoxide Market, by Metal Fabrication, By Region, 2023-2030 (US$ Bn)
TABLE 9 Global Carbon Monoxide Market, by Metal Fabrication, By Region, 2017-2022 (Kilo Tons)
TABLE 10 Global Carbon Monoxide Market, by Metal Fabrication, By Region, 2023-2030 (Kilo Tons)
TABLE 11 Global Carbon Monoxide Market, by Chemicals, By Region, 2017-2022 (US$ Bn)
TABLE 12 Global Carbon Monoxide Market, by Chemicals, By Region, 2023-2030 (US$ Bn)
TABLE 13 Global Carbon Monoxide Market, by Chemicals, By Region, 2017-2022 (Kilo Tons)
TABLE 14 Global Carbon Monoxide Market, by Chemicals, By Region, 2023-2030 (Kilo Tons)
TABLE 15 Global Carbon Monoxide Market, by Ore Processing & Extraction, By Region, 2017-2022 (US$ Bn)
TABLE 16 Global Carbon Monoxide Market, by Ore Processing & Extraction, By Region, 2023-2030 (US$ Bn)
TABLE 17 Global Carbon Monoxide Market, by Ore Processing & Extraction, By Region, 2017-2022 (Kilo Tons)
TABLE 18 Global Carbon Monoxide Market, by Ore Processing & Extraction, By Region, 2023-2030 (Kilo Tons)
TABLE 19 Global Carbon Monoxide Market, by Pharma & Biotechnology, By Region, 2017-2022 (US$ Bn)
TABLE 20 Global Carbon Monoxide Market, by Pharma & Biotechnology, By Region, 2023-2030 (US$ Bn)
TABLE 21 Global Carbon Monoxide Market, by Pharma & Biotechnology, By Region, 2017-2022 (Kilo Tons)
TABLE 22 Global Carbon Monoxide Market, by Pharma & Biotechnology, By Region, 2023-2030 (Kilo Tons)
TABLE 23 Global Carbon Monoxide Market, by Electronics, By Region, 2017-2022 (US$ Bn)
TABLE 24 Global Carbon Monoxide Market, by Electronics, By Region, 2023-2030 (US$ Bn)
TABLE 25 Global Carbon Monoxide Market, by Electronics, By Region, 2017-2022 (Kilo Tons)
TABLE 26 Global Carbon Monoxide Market, by Electronics, By Region, 2023-2030 (Kilo Tons)
TABLE 27 Global Carbon Monoxide Market, by Application, 2017-2022 (US$ Bn)
TABLE 28 Global Carbon Monoxide Market, by Application, 2023-2030 (US$ Bn)
TABLE 29 Global Carbon Monoxide Market, by Application, 2017-2022 (Kilo Tons)
TABLE 30 Global Carbon Monoxide Market, by Application, 2023-2030 (Kilo Tons)
TABLE 31 Global Carbon Monoxide Market, by Region, 2017-2022 (US$ Bn)
TABLE 32 Global Carbon Monoxide Market, by Region, 2023-2030 (US$ Bn)
TABLE 33 Global Carbon Monoxide Market, by Region, 2017-2022 (Kilo Tons)
TABLE 34 Global Carbon Monoxide Market, by Region, 2023-2030 (Kilo Tons)
TABLE 35 North America Carbon Monoxide Market, by Application, 2017-2022 (US$ Bn)
TABLE 36 North America Carbon Monoxide Market, by Application, 2023-2030 (US$ Bn)
TABLE 37 North America Carbon Monoxide Market, by Application, 2017-2022 (Kilo Tons)
TABLE 38 North America Carbon Monoxide Market, by Application, 2023-2030 (Kilo Tons)
TABLE 39 North America Carbon Monoxide Market, by Country, 2017-2022 (US$ Bn)
TABLE 40 North America Carbon Monoxide Market, by Country, 2023-2030 (US$ Bn)
TABLE 41 North America Carbon Monoxide Market, by Country, 2017-2022 (Kilo Tons)
TABLE 42 North America Carbon Monoxide Market, by Country, 2023-2030 (Kilo Tons)
TABLE 43 U.S. Carbon Monoxide Market, by Application, 2017-2022 (US$ Bn)
TABLE 44 U.S. Carbon Monoxide Market, by Application, 2023-2030 (US$ Bn)
TABLE 45 U.S. Carbon Monoxide Market, by Application, 2017-2022 (Kilo Tons)
TABLE 46 U.S. Carbon Monoxide Market, by Application, 2023-2030 (Kilo Tons)
TABLE 47 Canada Carbon Monoxide Market, by Application, 2017-2022 (US$ Bn)
TABLE 48 Canada Carbon Monoxide Market, by Application, 2023-2030 (US$ Bn)
TABLE 49 Canada Carbon Monoxide Market, by Application, 2017-2022 (Kilo Tons)
TABLE 50 Canada Carbon Monoxide Market, by Application, 2023-2030 (Kilo Tons)
TABLE 51 Mexico Carbon Monoxide Market, by Application, 2017-2022 (US$ Bn)
TABLE 52 Mexico Carbon Monoxide Market, by Application, 2023-2030 (US$ Bn)
TABLE 53 Mexico Carbon Monoxide Market, by Application, 2017-2022 (Kilo Tons)
TABLE 54 Mexico Carbon Monoxide Market, by Application, 2023-2030 (Kilo Tons)
TABLE 55 Europe Carbon Monoxide Market, by Application, 2017-2022 (US$ Bn)
TABLE 56 Europe Carbon Monoxide Market, by Application, 2023-2030 (US$ Bn)
TABLE 57 Europe Carbon Monoxide Market, by Application, 2017-2022 (Kilo Tons)
TABLE 58 Europe Carbon Monoxide Market, by Application, 2023-2030 (Kilo Tons)
TABLE 59 Europe Carbon Monoxide Market, by Country, 2017-2022 (US$ Bn)
TABLE 60 Europe Carbon Monoxide Market, by Country, 2023-2030 (US$ Bn)
TABLE 61 Europe Carbon Monoxide Market, by Country, 2017-2022 (Kilo Tons)
TABLE 62 Europe Carbon Monoxide Market, by Country, 2023-2030 (Kilo Tons)
TABLE 63 Germany Carbon Monoxide Market, by Application, 2017-2022 (US$ Bn)
TABLE 64 Germany Carbon Monoxide Market, by Application, 2023-2030 (US$ Bn)
TABLE 65 Germany Carbon Monoxide Market, by Application, 2017-2022 (Kilo Tons)
TABLE 66 Germany Carbon Monoxide Market, by Application, 2023-2030 (Kilo Tons)
TABLE 67 France Carbon Monoxide Market, by Application, 2017-2022 (US$ Bn)
TABLE 68 France Carbon Monoxide Market, by Application, 2023-2030 (US$ Bn)
TABLE 69 France Carbon Monoxide Market, by Application, 2017-2022 (Kilo Tons)
TABLE 70 France Carbon Monoxide Market, by Application, 2023-2030 (Kilo Tons)
TABLE 71 U.K. Carbon Monoxide Market, by Application, 2017-2022 (US$ Bn)
TABLE 72 U.K. Carbon Monoxide Market, by Application, 2023-2030 (US$ Bn)
TABLE 73 U.K. Carbon Monoxide Market, by Application, 2017-2022 (Kilo Tons)
TABLE 74 U.K. Carbon Monoxide Market, by Application, 2023-2030 (Kilo Tons)
TABLE 75 Italy Carbon Monoxide Market, by Application, 2017-2022 (US$ Bn)
TABLE 76 Italy Carbon Monoxide Market, by Application, 2023-2030 (US$ Bn)
TABLE 77 Italy Carbon Monoxide Market, by Application, 2017-2022 (Kilo Tons)
TABLE 78 Italy Carbon Monoxide Market, by Application, 2023-2030 (Kilo Tons)
TABLE 79 Spain Carbon Monoxide Market, by Application, 2017-2022 (US$ Bn)
TABLE 80 Spain Carbon Monoxide Market, by Application, 2023-2030 (US$ Bn)
TABLE 81 Spain Carbon Monoxide Market, by Application, 2017-2022 (Kilo Tons)
TABLE 82 Spain Carbon Monoxide Market, by Application, 2023-2030 (Kilo Tons)
TABLE 83 Rest of Europe Carbon Monoxide Market, by Application, 2017-2022 (US$ Bn)
TABLE 84 Rest of Europe Carbon Monoxide Market, by Application, 2023-2030 (US$ Bn)
TABLE 85 Rest of Europe Carbon Monoxide Market, by Application, 2017-2022 (Kilo Tons)
TABLE 86 Rest of Europe Carbon Monoxide Market, by Application, 2023-2030 (Kilo Tons)
TABLE 87 Asia Pacific Carbon Monoxide Market, by Application, 2017-2022 (US$ Bn)
TABLE 88 Asia Pacific Carbon Monoxide Market, by Application, 2023-2030 (US$ Bn)
TABLE 89 Asia Pacific Carbon Monoxide Market, by Application, 2017-2022 (Kilo Tons)
TABLE 90 Asia Pacific Carbon Monoxide Market, by Application, 2023-2030 (Kilo Tons)
TABLE 91 Asia Pacific Carbon Monoxide Market, by Country, 2017-2022 (US$ Bn)
TABLE 92 Asia Pacific Carbon Monoxide Market, by Country, 2023-2030 (US$ Bn)
TABLE 93 Asia Pacific Carbon Monoxide Market, by Country, 2017-2022 (Kilo Tons)
TABLE 94 Asia Pacific Carbon Monoxide Market, by Country, 2023-2030 (Kilo Tons)
TABLE 95 China Carbon Monoxide Market, by Application, 2017-2022 (US$ Bn)
TABLE 96 China Carbon Monoxide Market, by Application, 2023-2030 (US$ Bn)
TABLE 97 China Carbon Monoxide Market, by Application, 2017-2022 (Kilo Tons)
TABLE 98 China Carbon Monoxide Market, by Application, 2023-2030 (Kilo Tons)
TABLE 99 Japan Carbon Monoxide Market, by Application, 2017-2022 (US$ Bn)
TABLE 100 Japan Carbon Monoxide Market, by Application, 2023-2030 (US$ Bn)
TABLE 101 Japan Carbon Monoxide Market, by Application, 2017-2022 (Kilo Tons)
TABLE 102 Japan Carbon Monoxide Market, by Application, 2023-2030 (Kilo Tons)
TABLE 103 India Carbon Monoxide Market, by Application, 2017-2022 (US$ Bn)
TABLE 104 India Carbon Monoxide Market, by Application, 2023-2030 (US$ Bn)
TABLE 105 India Carbon Monoxide Market, by Application, 2017-2022 (Kilo Tons)
TABLE 106 India Carbon Monoxide Market, by Application, 2023-2030 (Kilo Tons)
TABLE 107 South Korea Carbon Monoxide Market, by Application, 2017-2022 (US$ Bn)
TABLE 108 South Korea Carbon Monoxide Market, by Application, 2023-2030 (US$ Bn)
TABLE 109 South Korea Carbon Monoxide Market, by Application, 2017-2022 (Kilo Tons)
TABLE 110 South Korea Carbon Monoxide Market, by Application, 2023-2030 (Kilo Tons)
TABLE 111 South-East Asia Carbon Monoxide Market, by Application, 2017-2022 (US$ Bn)
TABLE 112 South-East Asia Carbon Monoxide Market, by Application, 2023-2030 (US$ Bn)
TABLE 113 South-East Asia Carbon Monoxide Market, by Application, 2017-2022 (Kilo Tons)
TABLE 114 South-East Asia Carbon Monoxide Market, by Application, 2023-2030 (Kilo Tons)
TABLE 115 Rest of Asia Pacific Carbon Monoxide Market, by Application, 2017-2022 (US$ Bn)
TABLE 116 Rest of Asia Pacific Carbon Monoxide Market, by Application, 2023-2030 (US$ Bn)
TABLE 117 Rest of Asia Pacific Carbon Monoxide Market, by Application, 2017-2022 (Kilo Tons)
TABLE 118 Rest of Asia Pacific Carbon Monoxide Market, by Application, 2023-2030 (Kilo Tons)
TABLE 119 Latin America Carbon Monoxide Market, by Application, 2017-2022 (US$ Bn)
TABLE 120 Latin America Carbon Monoxide Market, by Application, 2023-2030 (US$ Bn)
TABLE 121 Latin America Carbon Monoxide Market, by Application, 2017-2022 (Kilo Tons)
TABLE 122 Latin America Carbon Monoxide Market, by Application, 2023-2030 (Kilo Tons)
TABLE 123 Latin America Carbon Monoxide Market, by Country, 2017-2022 (US$ Bn)
TABLE 124 Latin America Carbon Monoxide Market, by Country, 2023-2030 (US$ Bn)
TABLE 125 Latin America Carbon Monoxide Market, by Country, 2017-2022 (Kilo Tons)
TABLE 126 Latin America Carbon Monoxide Market, by Country, 2023-2030 (Kilo Tons)
TABLE 127 Brazil Carbon Monoxide Market, by Application, 2017-2022 (US$ Bn)
TABLE 128 Brazil Carbon Monoxide Market, by Application, 2023-2030 (US$ Bn)
TABLE 129 Brazil Carbon Monoxide Market, by Application, 2017-2022 (Kilo Tons)
TABLE 130 Brazil Carbon Monoxide Market, by Application, 2023-2030 (Kilo Tons)
TABLE 131 Argentina Carbon Monoxide Market, by Application, 2017-2022 (US$ Bn)
TABLE 132 Argentina Carbon Monoxide Market, by Application, 2023-2030 (US$ Bn)
TABLE 133 Argentina Carbon Monoxide Market, by Application, 2017-2022 (Kilo Tons)
TABLE 134 Argentina Carbon Monoxide Market, by Application, 2023-2030 (Kilo Tons)
TABLE 135 Rest of Latin America Carbon Monoxide Market, by Application, 2017-2022 (US$ Bn)
TABLE 136 Rest of Latin America Carbon Monoxide Market, by Application, 2023-2030 (US$ Bn)
TABLE 137 Rest of Latin America Carbon Monoxide Market, by Application, 2017-2022 (Kilo Tons)
TABLE 138 Rest of Latin America Carbon Monoxide Market, by Application, 2023-2030 (Kilo Tons)
TABLE 139 Middle East and Africa Carbon Monoxide Market, by Application, 2017-2022 (US$ Bn)
TABLE 140 Middle East and Africa Carbon Monoxide Market, by Application, 2023-2030 (US$ Bn)
TABLE 141 Middle East and Africa Carbon Monoxide Market, by Application, 2017-2022 (Kilo Tons)
TABLE 142 Middle East and Africa Carbon Monoxide Market, by Application, 2023-2030 (Kilo Tons)
TABLE 143 Middle East and Africa Carbon Monoxide Market, by Country, 2017-2022 (US$ Bn)
TABLE 144 Middle East and Africa Carbon Monoxide Market, by Country, 2023-2030 (US$ Bn)
TABLE 145 Middle East and Africa Carbon Monoxide Market, by Country, 2017-2022 (Kilo Tons)
TABLE 146 Middle East and Africa Carbon Monoxide Market, by Country, 2023-2030 (Kilo Tons)
TABLE 147 GCC Countries Carbon Monoxide Market, by Application, 2017-2022 (US$ Bn)
TABLE 148 GCC Countries Carbon Monoxide Market, by Application, 2023-2030 (US$ Bn)
TABLE 149 GCC Countries Carbon Monoxide Market, by Application, 2017-2022 (Kilo Tons)
TABLE 150 GCC Countries Carbon Monoxide Market, by Application, 2023-2030 (Kilo Tons)
TABLE 151 South Africa Carbon Monoxide Market, by Application, 2017-2022 (US$ Bn)
TABLE 152 South Africa Carbon Monoxide Market, by Application, 2023-2030 (US$ Bn)
TABLE 153 South Africa Carbon Monoxide Market, by Application, 2017-2022 (Kilo Tons)
TABLE 154 South Africa Carbon Monoxide Market, by Application, 2023-2030 (Kilo Tons)
TABLE 155 Rest of Middle East and Africa Carbon Monoxide Market, by Application, 2017-2022 (US$ Bn)
TABLE 156 Rest of Middle East and Africa Carbon Monoxide Market, by Application, 2023-2030 (US$ Bn)
TABLE 157 Rest of Middle East and Africa Carbon Monoxide Market, by Application, 2017-2022 (Kilo Tons)
TABLE 158 Rest of Middle East and Africa Carbon Monoxide Market, by Application, 2023-2030 (Kilo Tons)

Frequently Asked Questions:

What is the current size of the global carbon monoxide market?

The global carbon monoxide market was valued at USD 3.5 Billion in 2022.

What is the expected growth rate of the carbon monoxide market between 2023 and 2030?

The carbon monoxide market is expected to grow at a CAGR of 3.50% between 2023 and 2030, reaching USD 4.45 Billion in 2030.

Which segment is leading the market share in terms of application?

Metal fabrication is the leading segment by application, holding over 43% share in value in 2022.

Which region is fueling the growth of the carbon monoxide industry?

Asia Pacific is fueling the growth of the carbon monoxide industry, with over 42% share in 2022.

Who are the major players in the global carbon monoxide market?

Answer- The top players include Air Liquide (Paris, France) and Linde Plc. (Dublin, Ireland), Air Products (Pennsylvania, U.S.), Praxair (Connecticut, U.S.), American Gas Products (Massachusetts, U.S.), Sipchem (Al Khobar, Saudi Arabia), Messer (Bad Soden, Germany), and Tosoh (Tokyo, Japan).

What are the major market drivers of the carbon monoxide industry?

A significant industrial driver is increased mining and metal exploration operations and the high demand from the metal extraction industries.

What are the major market restraints of the carbon monoxide industry?

Carbon monoxide consumption can be dangerous if it is excessive.

What are the major market opportunities of the carbon monoxide industry?

One of the market’s key elements may be using carbon monoxide as a preservative in the food and beverage industry. Before packaging, all meat-based items, fish products, and salads are given a CO induction to lengthen their shelf lives.

1,4 Butanediol Market

Published:
Report ID: 36581

Palm Kernel Fatty Acids Market

Published:
Report ID: 36574

Crop Protection Chemicals Market

Published:
Report ID: 36441

Cosmetic Ingredients Market

Published:
Report ID: 3703

Hydrocolloids Market

Published:
Report ID: 36265

Ion Exchange Resins Market

Published:
Report ID: 36220

Herbal Extract Market

Published:
Report ID: 36211

Fiber Reinforced Polymer (FRP) Composites Market

Published:
Report ID: 36197

Bio-based Polycarbonate Market

Published:
Report ID: 36188

Middle East and Africa Carbon Black Market

Published:
Report ID: 36181

India Thermic Fluids Market

Published:
Report ID: 36178

Europe Green Hydrogen Market

Published:
Report ID: 36175

Purchase Options

$2999
Delivery Format: Excel.
$4999
Designed for the individual purchaser.
$6999
Users located at a single corporate site or regional office.
$7999
Allowed for unlimited sharing globally within one company.
Smallform of Sample request

Have a question?

User Profile

Don’t settle for less – trust Mitul to help you find the best solution.

Report delivery within 24 to 48 hours

– Other Info –

What people say?-

User Review

I am very impressed with the information in this report. The author clearly did their research when they came up with this product and it has already given me a lot of ideas.

Jana Schmidt
CEDAR CX Technologies

– Connect with us –

Phone

+91 6232 49 3207


support

24/7 Research Support


sales@credenceresearch.com

– Research Methodology –

Going beyond the basics: advanced techniques in research methodology

– Trusted By –

Pepshi, LG, Nestle
Motorola, Honeywell, Johnson and johnson
LG Chem, SIEMENS, Pfizer
Unilever, Samsonite, QIAGEN