
Market Overview
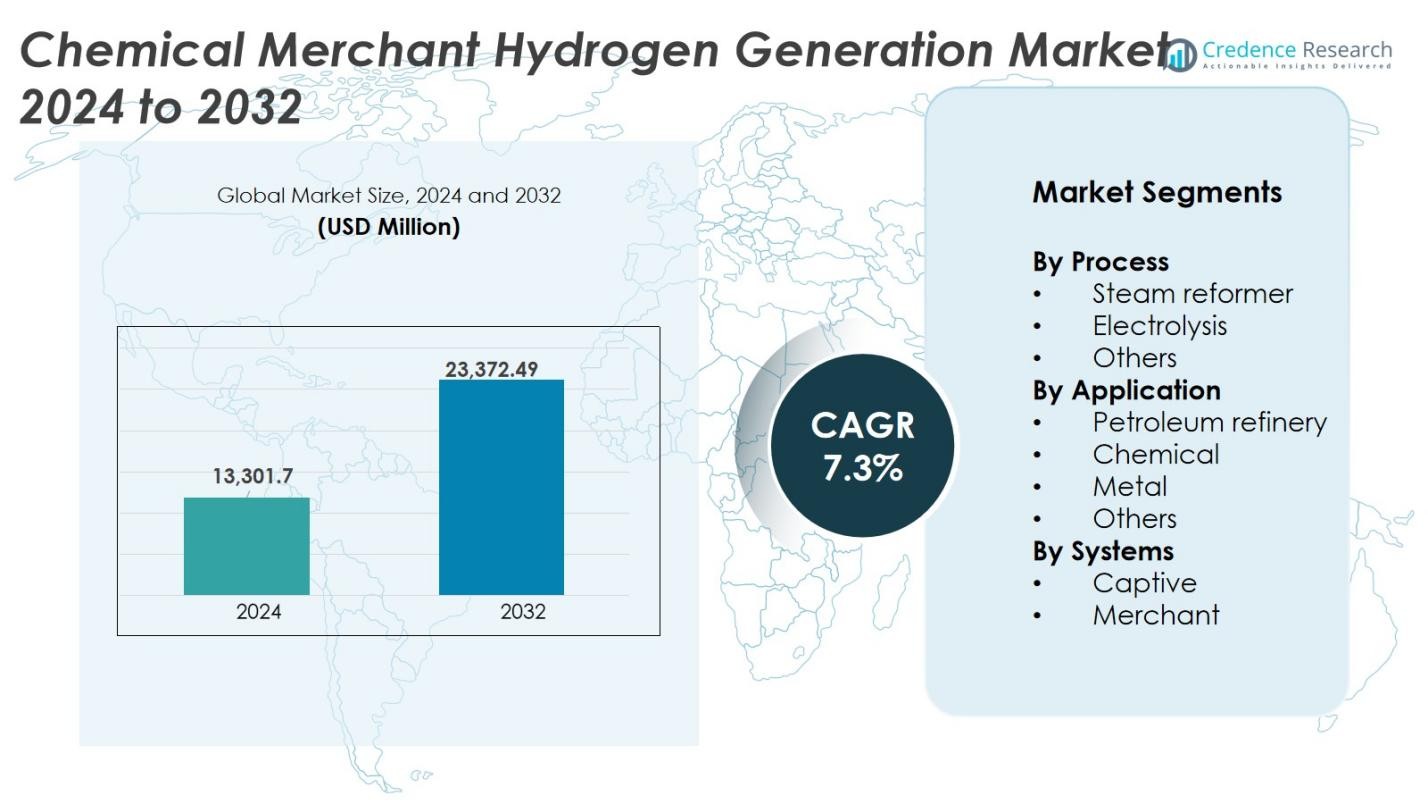
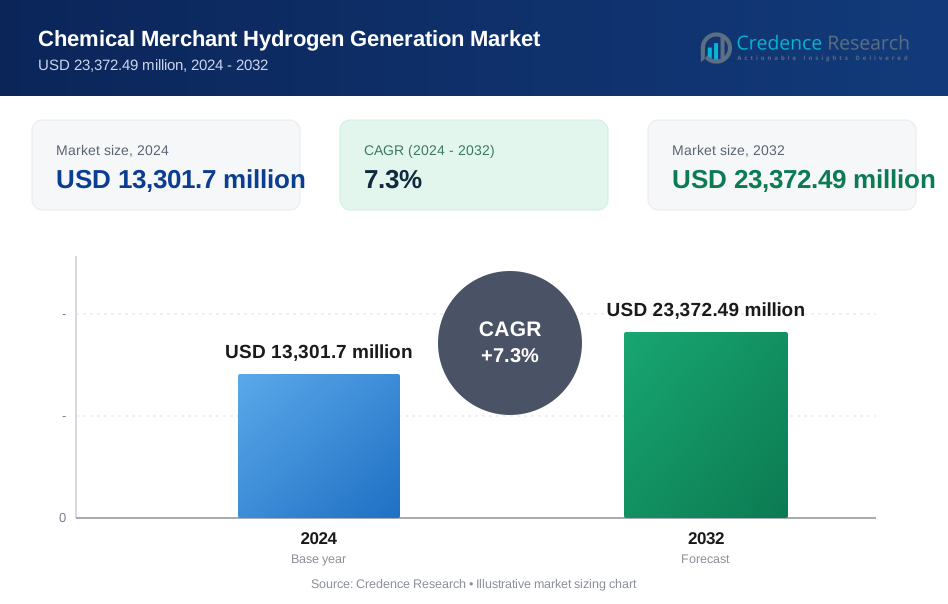
Chemical Merchant Hydrogen Generation Market size was valued at USD 13,301.7 million in 2024 and is anticipated to reach USD 23,372.49 million by 2032, at a CAGR of 7.3% during the forecast period.
| REPORT ATTRIBUTE | DETAILS |
|---|---|
| Historical Period | 2020-2023 |
| Base Year | 2024 |
| Forecast Period | 2025-2032 |
| Chemical Merchant Hydrogen Generation Market Size 2024 | USD 13,301.7 Million |
| Chemical Merchant Hydrogen Generation Market, CAGR | 7.3% |
| Chemical Merchant Hydrogen Generation Market Size 2032 | USD 23,372.49 Million |
The Chemical Merchant Hydrogen Generation market is dominated by global industrial gas suppliers that operate large production plants and extensive delivery networks. Key players include Air Liquide International S.A, Air Products and Chemicals, Inc., Linde Plc, INOX Air Products Ltd., Iwatani Corporation, Messer, SOL Group, Matheson Tri-Gas, Hydrogenics Corporation, and Tokyo Gas Chemicals Co., Ltd. These companies secure long-term contracts with refineries, chemical plants, metal producers, and electronics manufacturers to ensure steady demand. Asia Pacific remains the leading region with a 34% market share, supported by rapid industrial growth, refinery expansion, and rising investment in renewable hydrogen and fuel cell applications.
Market Insights
- The Chemical Merchant Hydrogen Generation market was valued at USD 13,301.7 million in 2024 and is projected to reach USD 23,372.49 million by 2032, growing at a CAGR of 7.3% during the forecast period.
- Growing demand from refineries and chemical industries drives market expansion, as hydrogen supports desulfurization, hydrocracking, fertilizer production, and high-purity chemical synthesis.
- Green hydrogen and electrolysis-based supply chains are gaining traction, supported by renewable energy integration, carbon-neutral targets, and government incentives across major economies.
- The market remains competitive, led by companies such as Air Liquide, Linde Plc, Air Products and Chemicals, INOX Air Products, Iwatani Corporation, and Messer, which rely on large-scale distribution and long-term industrial contracts.
- Asia Pacific holds the largest regional share at 34%, while the steam reformer process segment dominates the market due to cost efficiency and large-scale output required by petroleum refining and chemical manufacturing companies.
Market Segmentation Analysis:
By Process
Steam reformer dominates the Chemical Merchant Hydrogen Generation market with over 60% share, driven by low production costs and strong adoption in industrial operations. Refineries and chemical plants prefer steam reforming because it delivers large-volume hydrogen output with reliable efficiency. Electrolysis holds around 25% share, gaining traction as industries invest in cleaner supply chains and renewable energy-based hydrogen. The segment benefits from government incentives for green hydrogen and falling renewable power costs. Other processes collectively account for about 15%, including gasification and partial oxidation, which serve niche applications where feedstock flexibility or distributed generation is required.
- For instance, the United States produces around 9-10 million tons of hydrogen annually mainly through steam reforming, supporting industries like ammonia production.
By Application
Petroleum refinery holds over 45% share in the application segment, supported by continuous demand for hydrogen in hydrocracking and desulfurization processes. Refineries rely on consistent hydrogen supply to meet clean fuel regulations and improve output quality. The chemical industry accounts for nearly 30% share, using hydrogen in ammonia, methanol, and specialty chemicals production. Metal processing contributes around 15%, as industries adopt hydrogen for annealing, reduction, and furnace atmospheres. Other applications collectively represent about 10%, including food processing, electronics, and fuel cell supply chains, which are expanding due to rising investments in low-carbon technologies.
- For instance, ArcelorMittal employs hydrogen-based direct reduction to lower CO2 emissions substantially in steel production.
By Systems
Merchant systems lead the segment with over 65% share, driven by the rising preference for outsourced hydrogen supply. Users choose merchant hydrogen to avoid capital costs of production units and ensure uninterrupted deliveries through pipelines, cylinders, or tankers. Captive systems hold 35% share, adopted by large plants requiring stable, high-volume production within facility boundaries. Refineries and chemical plants invest in captive units to reduce long-term supply risks and operational downtime. The shift toward distributed hydrogen supply models continues to strengthen merchant system demand.
Key Growth Drivers
Expanding Demand from Refineries and Chemical Industries
Refineries and chemical plants represent the largest buyers of merchant hydrogen, driving significant market expansion. Hydrogen remains essential for hydrocracking, desulfurization, fertilizer production, methanol synthesis, and specialty chemicals. Stricter regulations for cleaner fuels increase hydrogen consumption in refineries, especially in developing regions with rising fuel demand. Chemical producers rely on hydrogen to ensure high process efficiency and product purity, which strengthens long-term procurement contracts with merchant suppliers. Rapid industrial growth in Asia Pacific and the Middle East supports higher adoption of outsourced hydrogen supply, as many facilities prefer merchant deliveries to avoid high capital spending on captive units.
- For instance, Abu Dhabi-based Ocior Energy secured a 25-year contract in 2025 to supply 5,000 tonnes annually of green hydrogen to Hindustan Petroleum’s Visakhapatnam refinery, reflecting a strategic move towards cleaner fuel production in Indian refineries.
Shift Toward Flexible and Cost-Efficient Hydrogen Supply Models
Many industries now prefer merchant hydrogen due to lower upfront investment and reliable access to large-volume supply. Merchant models eliminate the need for on-site production equipment, maintenance, and utility integration, making them suitable for refineries, steel mills, electronics manufacturers, and semiconductor facilities. Companies receive hydrogen through pipelines, cylinders, or tankers based on consumption levels, ensuring operational continuity without production downtime risks. As hydrogen infrastructure expands across industrial clusters, merchant supply becomes more competitive and accessible. The trend is further supported by partnerships between industrial gas suppliers and manufacturing plants that aim to secure long-term supply contracts.
- For instance, Ocior Energy won a contract to supply 5,000 tonnes yearly of green hydrogen to HPCL’s Visakhapatnam refinery under a build-own-operate model, illustrating merchant hydrogen’s role in refineries with guaranteed supply contracts.
Rising Investments in Green Hydrogen and Clean Energy Initiatives
Growing sustainability targets and emission regulations are encouraging industries to procure low-carbon hydrogen through electrolysis and renewable power sources. Governments in Europe, North America, and Asia Pacific are offering tax credits, funding programs, and renewable hydrogen mandates to support cleaner procurement. Merchant suppliers are investing in electrolysis plants and renewable integration to meet future demand from refineries, chemicals, mobility, and energy storage applications. Green hydrogen demand is rising in steelmaking, ammonia production, and fuel cell technologies, which rely on outsourced supply for pilot and commercial projects. Companies that lack on-site green hydrogen production capabilities depend on merchant deliveries to transition toward decarbonized operations.
Key Trends & Opportunities
Expansion of Hydrogen Supply Networks and Distribution Infrastructure
Hydrogen distribution networks continue to expand with new pipelines, bulk storage systems, and high-capacity transport fleets, making merchant delivery more flexible and cost-efficient. Industrial clusters in refining, chemicals, and steel industries benefit from shared distribution corridors that reduce logistics constraints. Companies are also building liquid hydrogen terminals, compressor stations, and tube-trailer fleets to serve large industrial buyers and mobility users. These developments open new revenue streams in regions where establishing captive units remains costly. The availability of scalable supply chains attracts new end-users, including energy storage, electronics, and data centers seeking clean fuel alternatives.
- For instance, Deutsche ReGas and Höegh-LNG's development of the world's first floating import terminal for hydrogen at the port of Lubmin, Germany, capable of producing about 30,000 tons of hydrogen per year and feeding it into the national hydrogen network, supporting industrial decarbonization in 2026.
Growing Adoption of Hydrogen in Metal Processing and Emerging Sectors
Industries beyond refining and chemicals are accelerating hydrogen use, opening significant opportunities for merchant suppliers. Metal producers adopt hydrogen for annealing, sintering, furnace atmospheres, and carbon-free iron reduction. Food processing, glass manufacturing, semiconductors, and electronics also require high-purity merchant hydrogen. Fuel cell systems in buses, trucks, and industrial vehicles rely on delivered hydrogen instead of on-site production. As countries scale clean hydrogen mobility and distributed power generation pilots, merchant suppliers can serve these emerging customer groups. Expanding demand across diverse applications strengthens market penetration beyond traditional heavy industries.
- For instance, Companies like Outokumpu are advancing the use of hydrogen in stainless steel production by developing high-strength stainless steel capable of withstand high pressure and cryogenic temperatures, suitable for hydrogen storage and transport.
Key Challenges
High Logistics and Transport Costs for Large-Scale Supply
Transporting hydrogen—especially in liquefied or high-pressure form remains expensive due to specialized storage tanks, tube trailers, cryogenic equipment, and safety compliance. Long-distance deliveries increase operational costs and limit competitive pricing in regions without established hydrogen infrastructure. Small and medium industries often face higher delivery charges, discouraging them from switching to hydrogen-based processes. Limited hydrogen pipeline networks also restrict bulk movement in many countries, making merchant supply dependent on fleets of road tankers. Without wider pipeline networks and lower transport overheads, market scalability can be slower in emerging regions.
Capital-Intensive Production and Dependence on Fossil-Based Feedstocks
Merchant hydrogen production through steam reforming requires high-cost reformers, purification systems, and energy supply, creating financial barriers for new entrants. Fossil-based hydrogen also generates carbon emissions, leading to regulatory scrutiny in regions with strict climate policies. Although electrolysis provides a cleaner alternative, renewable power and electrolyzer units remain costlier than traditional reforming. Carbon capture systems can reduce emissions but add additional investment and operational complexity. These cost pressures challenge supplier profitability and hinder rapid transition toward low-carbon merchant hydrogen production.
Regional Analysis
North America
North America holds a significant share of the Chemical Merchant Hydrogen Generation market, driven by strong demand from refineries, chemical industries, and emerging fuel cell applications. The United States leads the region with advanced hydrogen infrastructure and large industrial gas suppliers supporting merchant deliveries. Increasing investments in low-carbon hydrogen and carbon capture integration strengthen long-term adoption. Growing deployment in steel, food processing, and semiconductor manufacturing also contributes to steady demand. The region accounts for 28% of the market share as industries prefer outsourced supply over captive units to reduce operating costs and ensure continuous production.
Europe
Europe commands 31% of the market share, supported by aggressive environmental policies, renewable hydrogen mandates, and expansion of industrial hydrogen networks. Refineries, ammonia producers, and green steel projects rely on merchant suppliers for high-purity hydrogen. Germany, France, the Netherlands, and the UK are investing in new electrolysis plants and cross-border hydrogen corridors that enhance supply access for industrial clusters. Merchant firms benefit from strict decarbonization targets, which accelerate adoption of green hydrogen across chemicals, metals, and clean mobility sectors. Strong government funding and infrastructure development continue to boost regional consumption.
Asia Pacific
Asia Pacific leads the Chemical Merchant Hydrogen Generation market with the highest share of 34%, fueled by rapid industrial growth in China, Japan, South Korea, and India. Refineries, petrochemicals, fertilizers, and electronics manufacturers represent the largest buyers of merchant hydrogen. Many facilities prefer outsourced supply due to high capital costs of captive plants and rising consumption linked to fuel quality regulations. Expanding renewable projects and hydrogen mobility initiatives further support merchant deliveries. The region also witnesses significant investment in electrolysis capacity and liquefaction, strengthening supply chains for industrial and energy storage applications.
Middle East & Africa
The Middle East & Africa account for 4% of the market, supported by refinery modernization, petrochemical expansion, and growing clean hydrogen initiatives. Countries such as Saudi Arabia, the UAE, and Qatar are investing in merchant hydrogen facilities to meet refinery demand and support low-carbon ammonia exports. Industrial clusters rely on pipeline and tanker-based supply to reduce operational downtime. Pilot renewable hydrogen projects in the UAE and Saudi Arabia enhance long-term opportunities for merchant suppliers. Mining and metal industries in Africa also adopt hydrogen for reduction and processing, gradually increasing regional consumption.
Latin America
Latin America holds 3% of the market share, led by refinery upgrades, fertilizer production, and rising investment in clean fuel technologies. Brazil, Argentina, and Chile are developing hydrogen supply networks to support chemical production and pilot fuel cell applications. Merchant delivery is preferred by industrial users that avoid high capital investment for captive units. Chile’s renewable hydrogen initiatives and ammonia projects create additional opportunities for suppliers. Adoption in metals and food processing continues to expand, although infrastructure limitations and higher logistics cost pose challenges, keeping the regional share relatively small compared to other markets.
Market Segmentations
By Process
- Steam reformer
- Electrolysis
- Others
By Application
- Petroleum refinery
- Chemical
- Metal
- Others
By Systems
- Captive
- Merchant
By Geography
- North America
- U.S.
- Canada
- Mexico
- Europe
- Germany
- France
- U.K.
- Italy
- Spain
- Rest of Europe
- Asia Pacific
- China
- Japan
- India
- South Korea
- South-east Asia
- Rest of Asia Pacific
- Latin America
- Brazil
- Argentina
- Rest of Latin America
- Middle East & Africa
- GCC Countries
- South Africa
- Rest of the Middle East and Africa
Competitive Landscape
The Chemical Merchant Hydrogen Generation market features strong competition among global industrial gas suppliers and regional producers serving refineries, chemical plants, electronics, and metal industries. Leading players such as Air Liquide, Linde Plc, Air Products and Chemicals, INOX Air Products, and Iwatani Corporation operate large-scale production sites supported by extensive distribution networks, pipelines, bulk tankers, and cylinder fleets. Many companies form long-term supply contracts with industrial customers to ensure predictable revenue and stable delivery volumes. Competitors are also investing in renewable-based hydrogen production through electrolysis, supported by government incentives and carbon reduction mandates. Partnerships with refineries, steel producers, and ammonia manufacturers help expand regional coverage, particularly in Asia Pacific, Europe, and North America. Technology upgrades, including advanced liquefaction, high-pressure storage, automation, and carbon capture integration, enhance operational efficiency and product purity. As hydrogen consumption rises across new applications such as fuel cells and zero-carbon steel, competitive intensity continues to increase.
Key Player Analysis
- Tokyo Gas Chemicals Co., Ltd.
- Messer
- Air Liquide International S.A
- Iwatani Corporation
- SOL Group
- Hydrogenics Corporation
- Matheson Tri-Gas, Inc.
- INOX Air Products Ltd.
- Air Products and Chemicals, Inc
- Linde Plc
Recent Developments
- In May 2025, Electric Hydrogen completed the acquisition of Ambient Fuels, a hydrogen project development company, to expand its merchant hydrogen generation portfolio.
- In August 2024, Air Products & Chemicals agreed to acquire the hydrogen-production assets of Saneg at the Fergana Oil Refinery in Uzbekistan for US$140 million.
- In June 2024, TotalEnergies signed a 15-year agreement with Air Products & Chemicals for the annual delivery of ~70 000 tons of green hydrogen to its Northern European refineries starting in 2030.
- In June 2024, Eletrobras signed a memorandum of understanding with Prumo to produce green hydrogen at Brazil’s Port of Açu, initiating a pilot plant assessing up to 10 MW capacity.
Report Coverage
The research report offers an in-depth analysis based on Process, Application, System and Geography. It details leading market players, providing an overview of their business, product offerings, investments, revenue streams, and key applications. Additionally, the report includes insights into the competitive environment, SWOT analysis, current market trends, as well as the primary drivers and constraints. Furthermore, it discusses various factors that have driven market expansion in recent years. The report also explores market dynamics, regulatory scenarios, and technological advancements that are shaping the industry. It assesses the impact of external factors and global economic changes on market growth. Lastly, it provides strategic recommendations for new entrants and established companies to navigate the complexities of the market.
Future Outlook
- Merchant hydrogen supply will expand as refineries and chemical plants increase consumption for cleaner fuel production.
- Green hydrogen demand will rise with more electrolysis projects supported by renewable energy.
- Companies will invest in large-scale liquefaction, storage, and high-pressure delivery systems to reach distant industries.
- Hydrogen use in steelmaking and metal processing will grow as industries shift toward low-carbon production.
- Fuel cell applications in buses, trucks, and industrial vehicles will create new merchant supply opportunities.
- Carbon capture integration with reformers will reduce emissions and support compliance with climate regulations.
- Industrial clusters will expand shared hydrogen pipelines and bulk terminals for cost-efficient distribution.
- Digital monitoring and automation will improve plant efficiency and reduce operational downtime.
- Partnerships between gas suppliers and industrial users will increase to secure long-term supply contracts.
- Developing regions will witness higher adoption as infrastructure improves and industrial capacity expands.
Request a Free Sample
Fill in your details and we'll send you a free sample report.
- Sample data tables & charts
- Research methodology
Need a Custom Version of This Report?
Tailor the scope, geography, or segments to your exact requirements.
- Custom geography or segment scope
- Direct access to our analyst team
Frequently Asked Questions
What is the current market size for the Chemical Merchant Hydrogen Generation market, and what is its projected size in 2032?
At what Compound Annual Growth Rate is the Chemical Merchant Hydrogen Generation market projected to grow between 2025 and 2032?
Which Chemical Merchant Hydrogen Generation market segment held the largest share in 2024?
What are the primary factors fueling the growth of the Chemical Merchant Hydrogen Generation market?
Who are the leading companies in the Chemical Merchant Hydrogen Generation market?
Which region commanded the largest share of the Chemical Merchant Hydrogen Generation market in 2024?
Table of Content
Chapter 1. Report Introduction
- 1.1 Report Description & Purpose
- 1.1.1 Report Title & Market Definition
- 1.1.2 Unique Selling Propositions (USP) & Key Differentiators
- 1.1.3 Value Proposition for Stakeholders
- 1.2 Research Objectives
- 1.2.1 Market Sizing Objectives (Volume & Revenue)
- 1.2.2 Segmentation Objectives
- 1.2.3 Competitive Intelligence Objectives
- 1.2.4 Forecast & Scenario Objectives
- 1.3 Report Scope
- 1.3.1 Chemical Merchant Hydrogen Generation Scope – Types & Subtypes Covered
- 1.3.2 Geographic Scope – Regions & Countries Covered
- 1.3.3 Historical Period, Base Year & Forecast Period (2024; forecast to 2032)
- 1.3.4 Inclusions & Exclusions
- 1.4 HS Code & Classification Framework
- 1.5 Currency, Units & Pricing Basis
- 1.6 Target Stakeholders
- 1.7 Limitations & Assumptions
Chapter 2. Executive Summary
- 2.1 Global Chemical Merchant Hydrogen Generation Market Snapshot
- 2.1.1 Market Size – Historical (2024) & Forecast (2024-2032) (2024: USD 13,301.7 million → 2032: USD 23,372.49 million)
- 2.1.2 Volume & Revenue – Global Totals
- 2.1.3 Key Market Highlights – Top Five Facts
- 2.2 Chemical Merchant Hydrogen Generation Market Segmentation Snapshot
- 2.2.1 Market Split by Region – 2024 vs. 2032
- 2.3 Competitive Snapshot
- 2.3.1 Top 10 Players by Revenue Share – 2024
- 2.3.2 Top 10 Players by Volume Share – 2024
- 2.3.3 Recent Strategic Developments (18-Month Summary)
- 2.4 Key Investment Highlights & Strategic Conclusions
Chapter 3. Chemical Merchant Hydrogen Generation Market Dynamics & Industry Analysis
- 3.1 Market Overview & Context
- 3.1.1 Chemical Merchant Hydrogen Generation Market Position in the Broader Automotive Value Chain
- 3.1.2 OEM vs. Replacement Market Dynamics
- 3.1.3 Market Maturity & Development Stage by Region
- 3.2 Chemical Merchant Hydrogen Generation Market Drivers
- 3.3 Chemical Merchant Hydrogen Generation Market Restraints & Challenges
- 3.4 Chemical Merchant Hydrogen Generation Market Opportunities
- 3.5 Porter's Five Forces Analysis
- 3.5.1 Threat of New Entrants
- 3.5.2 Bargaining Power of Suppliers
- 3.5.3 Bargaining Power of Buyers
- 3.5.4 Threat of Substitutes
- 3.5.5 Competitive Rivalry – Intensity Assessment
- 3.6 Chemical Merchant Hydrogen Generation Value Chain Analysis
- 3.6.1 Upstream – Raw Material/Input Suppliers
- 3.6.1.1 Raw Material/Input 1
- 3.6.1.2 Raw Material/Input 2
- 3.6.1.3 Raw Material/Input 3
- 3.6.2 Midstream – Production/Manufacturing/Service Delivery
- 3.6.2.1 Production/Process Overview
- 3.6.2.2 Key Facility Locations & Capacity by Manufacturer
- 3.6.3 Downstream – Distribution & End Consumer
- 3.6.3.1 Primary Channel – B2B/OEM
- 3.6.3.2 Secondary Channels – Dealer, Retail, Online, Direct
- 3.6.4 Value Chain Profitability Analysis
- 3.6.1 Upstream – Raw Material/Input Suppliers
- 3.7 PESTEL Analysis
- 3.7.1 Political Factors
- 3.7.2 Economic Factors
- 3.7.3 Social Factors
- 3.7.4 Technological Factors
- 3.7.5 Environmental Factors
- 3.7.6 Legal Factors
- 3.8 Chemical Merchant Hydrogen Generation Supply Chain Analysis
- 3.8.1 Raw Material/Input Supply Risk Assessment
- 3.8.2 Manufacturing Concentration Risk (Geographic Exposure)
- 3.8.3 Trade Disruption Impact Analysis
- 3.9 Regulatory & Policy Landscape
Note: The regulatory and policy landscape section covers regulations based on their applicability to the market, Chemical Merchant Hydrogen Generation category, geography, and scope of the study. Only regulatory frameworks with a material impact on operations, compliance, trade, sustainability, or market access are analyzed in detail.
Chapter 4. Key Investment Pockets & Opportunity Analysis
- 4.1 Chemical Merchant Hydrogen Generation Market Attractiveness Analysis
- 4.1.1 By Region – Investment Attractiveness Matrix (Volume × CAGR)
- 4.2 Absolute Revenue Growth Opportunity
- 4.2.1 By Region – Absolute USD Growth Through 2032
- 4.3 Incremental Volume Opportunity
- 4.3.1 By Region – Incremental Volume Through 2032
- 4.3.2 Segment – Incremental Volume
- 4.4 Emerging Submarket Opportunity Deep Dive (Subject to Applicability)
- 4.5 Emerging Market Opportunity Scorecards
- 4.5.1 United States
- 4.5.2 Europe
- 4.5.3 Asia
- 4.5.4 Middle East & Africa
Note: Emerging Market Opportunity Scorecards will be included based on relevance and strategic importance. Regions listed are indicative and may vary depending on data availability and market dynamics.
Chapter 5. Chemical Merchant Hydrogen Generation Import-Export Analysis & Trade Flows
- 5.1 Global Trade Overview
- 5.1.1 Global Export Value by Country (2024)
- 5.1.2 Global Export Volume by Country (2024)
- 5.1.3 Global Import Value by Country (2024)
- 5.1.4 Global Import Volume by Country (2024)
- 5.1.5 Net Trade Balance by Country (2024)
- 5.2 Export Analysis – Segment
- 5.2.1 Type 1 (HS Code)
- 5.2.2 Type 2 (HS Code)
- 5.2.3 Type 3 (HS Code)
- 5.2.4 Type 4 (HS Code)
- 5.2.5 Type 5 (HS Code)
- 5.3 Import Analysis – Segment
- 5.3.1 Type 1 (HS Code)
- 5.3.2 Type 2 (HS Code)
- 5.3.3 Type 3 (HS Code)
- 5.3.4 Type 4 (HS Code)
- 5.3.5 Type 5 (HS Code)
- 5.4 Average Unit Trade Prices
- 5.4.1 Average Export Price – Segment & Country
- 5.4.2 Average Import Price – Segment & Source Country
- 5.4.3 Price Trends (2024)
- 5.5 Key Trade Route Analysis
- 5.5.1 Trade Route 1
- 5.5.2 Trade Route 2
- 5.5.3 Trade Route 3
- 5.5.4 Trade Route 4
- 5.5.5 Trade Route 5
- 5.6 Trade Policy Impact Assessment
- 5.6.1 US Anti-Dumping & Section 301 Tariffs
- 5.6.2 EU Customs Union Impact
- 5.6.3 Major Free Trade Agreements
- 5.6.4 USMCA Rules of Origin
Note: Trade policy analysis will be included only where relevant to the Chemical Merchant Hydrogen Generation market.
Chapter 6. Competitive Landscape & Company Benchmarking
- 6.1 Chemical Merchant Hydrogen Generation Market Concentration & Structure
- 6.1.1 Herfindahl-Hirschman Index (HHI) – vs. 2024
- 6.1.2 Tier 1, Tier 2 & Tier 3 Market Structure
- 6.1.3 Global, Regional & Local Player Dynamics
- 6.2 Chemical Merchant Hydrogen Generation Market Share Analysis – 2024
- 6.2.1 Global Revenue Share by Company
- 6.2.2 Global Volume Share by Company
- 6.2.3 Regional Revenue Share
- 6.2.4 Market Share Evolution ( vs. 2024)
- 6.2.5 OEM Segment Share by Company
- 6.2.6 Replacement Segment Share by Company
- 6.3 Production/Delivery Capacity & Facility Analysis
- 6.3.1 Global Installed Capacity
- 6.3.2 Capacity Utilization Rates
- 6.3.3 Production/Output Volume
- 6.3.4 Facility Locations & Capacity Map
- 6.3.5 Planned Capacity Additions
- 6.4 Chemical Merchant Hydrogen Generation Competitive Benchmarking Matrix
- 6.4.1 Revenue, Volume, CAGR & Profitability Comparison
- 6.4.2 Channel Revenue Mix
- 6.4.3 Geographic Revenue Exposure
- 6.4.4 R&D Intensity
- 6.4.5 Sustainability Maturity
- 6.5 Strategic Developments in Chemical Merchant Hydrogen Generation (Last 24 Months)
- 6.5.1 Mergers, Acquisitions & Divestments
- 6.5.2 New Chemical Merchant Hydrogen Generation Launches
- 6.5.3 Facility Expansions
- 6.5.4 Strategic Alliances, Joint Ventures & Partnerships
- 6.5.5 Distribution Expansion & Market Entry
- 6.5.6 Sustainability & ESG Initiatives
- 6.6 Competitive Strategy Mapping
- 6.6.1 Leader, Challenger, Follower & Niche Classification
- 6.6.2 Pricing Strategy Comparison
- 6.6.3 Channel Strategy Matrix
Note: Strategic developments are included based on their materiality and the availability of reliable information.
Chapter 7. Global Chemical Merchant Hydrogen Generation Market – By Distribution Channel
- 7.1 Segment Overview
- 7.1.1 Volume & Revenue Split by Channel (2024 & 2032)
- 7.1.2 Channel Mix Evolution (2024-2032)
Chapter 8. Regional Market Analysis – Global Overview
- 8.1 Global Regional Overview
- 8.1.1 Regional Volume Share
- 8.1.2 Regional Revenue Share
- 8.1.3 Regional Volume by Region
- 8.1.4 Regional Revenue by Region
- 8.1.5 Regional Forecast Through 2032
- 8.2 Cross-Regional Segment Analysis
- 8.2.1 By Distribution Channel
- 8.2.2 By Brand/Price Tier
Chapter 9. North America Chemical Merchant Hydrogen Generation Market
- 9.1 United States
- 9.2 Canada
- 9.3 Mexico
Chapter 10. Europe Chemical Merchant Hydrogen Generation Market
- 10.1 Germany
- 10.2 France
- 10.3 Italy
- 10.4 United Kingdom
- 10.5 Spain
- 10.6 Poland
- 10.7 Russia
- 10.8 Netherlands
- 10.9 Belgium
- 10.10 Sweden
- 10.11 Denmark
- 10.12 Norway
- 10.13 Rest of Europe
Chapter 11. Asia Pacific Chemical Merchant Hydrogen Generation Market
- 11.1 China
- 11.2 India
- 11.3 Japan
- 11.4 South Korea
- 11.5 Thailand
- 11.6 Indonesia
- 11.7 Vietnam
- 11.8 Malaysia
- 11.9 Australia
- 11.10 Rest of Asia Pacific
Chapter 12. Latin America Chemical Merchant Hydrogen Generation Market
- 12.1 Brazil
- 12.2 Argentina
- 12.3 Colombia
- 12.4 Chile
- 12.5 Rest of Latin America
Chapter 13. Middle East Chemical Merchant Hydrogen Generation Market
- 13.1 Saudi Arabia
- 13.2 United Arab Emirates
- 13.3 Turkey
- 13.4 Israel
- 13.5 Iran
- 13.6 Rest of the Middle East
Chapter 14. Africa Chemical Merchant Hydrogen Generation Market
- 14.1 South Africa
- 14.2 Egypt
- 14.3 Nigeria
- 14.4 Morocco
- 14.5 Rest of Africa
Chapter 15. Chemical Merchant Hydrogen Generation Company Profiles
- 15.1 [Company 01]
- 15.1.1 Company Overview
- 15.1.2 Key Management Personnel
- 15.1.3 Products & Services Portfolio
- 15.1.4 Financial Performance
- 15.1.5 Key Market Focus & Geographic Presence
- 15.1.6 Recent Developments & Strategic Initiatives
Note: The company profile list is preliminary and may change based on research findings, market developments, data availability, and client requirements.
Chapter 16. Appendices
- Appendix A – List of Abbreviations & Acronyms
- Appendix B – Industry Classification Code Reference – Full Series
- Appendix C – Production & Capacity Data Tables
- Appendix D – End-Use & Demand Base Tables
- Appendix E – Consumption & Replacement Rate Assumptions
- Appendix F – ASP Reference Tables
- Appendix G – Manufacturing & Facility Database
- Appendix H – Import-Export Data Tables
- Appendix I – Regulatory Summary Tables
- Appendix J – Primary Research Participant List (Anonymized)
- Appendix K – Primary Research Questionnaire Framework
- Appendix L – Data Sources & Bibliography
- Appendix M – Market Size Divergence & Source Comparison
Chapter 17. Research Methodology
- 17.1 Research Framework & Philosophy
- 17.2 Secondary Research – Sources, Hierarchy & Data Extraction
- 17.3 Data Modeling – Bottom-Up & Top-Down Market Sizing
- 17.4 Primary Research – Stakeholder Framework, LOI & Sample Sizes
- 17.5 Forecast Methodology – Regression, Scenario & Sensitivity Analysis
- 17.6 Quality Control – Four-Layer Validation Framework
- 17.7 Limitations & Standard Assumptions
- 17.8 Disclaimer
