Market Overview
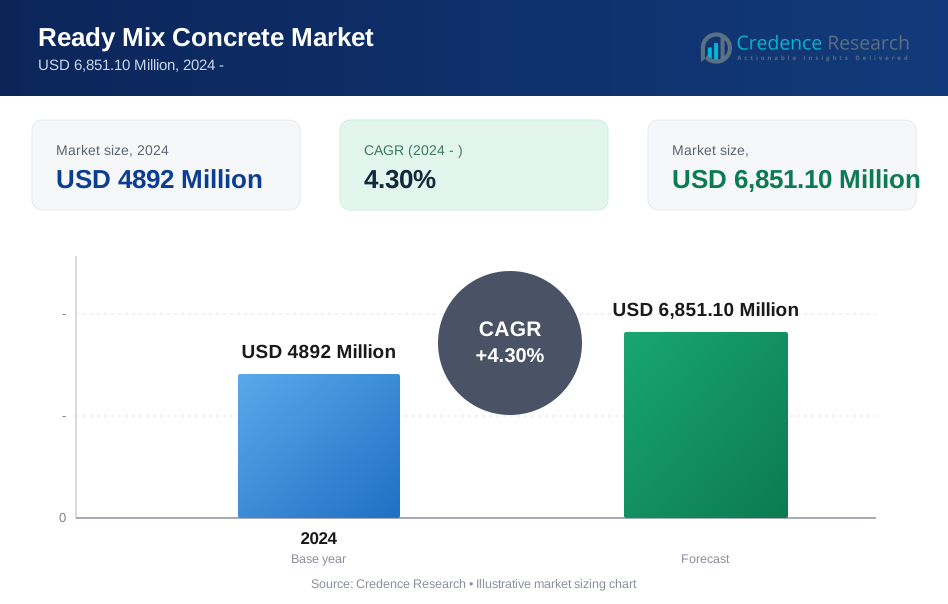
The Ready Mix Concrete Market is projected to grow from USD 4892 Million in 2025 to an estimated USD 6851.10 Million by 2032, with a CAGR of 4.3% from 2024 to 2032. Demand continues to rise as governments and private developers increase spending on housing, transport networks and urban commercial assets. Asia Pacific leads the market, supported by large-scale infrastructure pipelines, rapid urbanization and broad installed batching capacity across major construction economies.
| REPORT ATTRIBUTE | DETAILS |
|---|---|
| Historical Period: | 2020-2023 |
| Base Year | 2024 |
| Forecast Period | 2025-2032 |
| Ready Mix Concrete Market Market Size 2024 | USD 4892 Million |
| Ready Mix Concrete Market CAGR | 4.3% |
| Ready Mix Concrete Market Market Size 2032 | USD 6851.10 Million |
Market Insights
- Asia Pacific accounted for 44.2% of global revenue in 2024, making it the leading regional market for ready mix concrete.
- Infrastructure remained the leading application segment in 2024 with an estimated 36.8% share, driven by public investment in roads, rail and utilities.
- Leading companies shaping competition include HOLCIM, CEMEX, S.A.B. de C.V., Heidelberg Materials AG, Vicat S.A. and ACC Limited.
- Stationary batching plant systems held the largest plant type share because high-volume urban projects require stable output, quality control and lower unit costs.
- Low-carbon concrete mixes, digital batching controls and recycled material integration represent key market trends across mature and high-growth construction markets.

Market Segmentation Analysis
By Capacity - Infrastructure-led demand supports large-capacity stationary operations.
On the basis of Capacity type the market is classified into Plant Capacity = 60 m/h, Plant Capacity > 60 m/h, Mobile Batching Plant, Stationary Batching Plant, River Gravel, Crushed Stone, Slag, Commercial Construction, Residential Construction, Infrastructure and Mining. Infrastructure held the largest percentage share at 36.8% in 2024. Its lead reflects sustained demand for bridges, highways, metro corridors and utility networks that require consistent volume supply, strict quality performance and dependable delivery schedules. Large civil contracts also favor integrated producers with stationary plants and crushed stone sourcing. Key companies operating across this segment include HOLCIM, CEMEX, S.A.B. de C.V. and Heidelberg Materials AG.
By Plant Type - Stationary batching plants lead through scale and quality consistency
On the basis of Plant Type, the market is classified into Mobile Batching Plant and Stationary Batching Plant. Stationary Batching Plant held the dominant share of 68.4% in 2024. This segment benefits from higher production stability, stronger process control and lower cost per cubic meter for repetitive commercial and infrastructure pours. Producers also prefer stationary assets near dense urban demand centers because they support dispatch efficiency and broader product portfolios. Key companies in this segment include ACC Limited, Vicat S.A. and HOLCIM.
By Aggregate Type - Crushed stone remains preferred for strength-driven concrete mixes.
On the basis of Aggregate Type, the market is classified into River Gravel, Crushed Stone and Slag. Crushed Stone accounted for the largest share of 51.6% in 2024. Its leadership reflects wide use in structural and pavement applications where compressive strength, particle interlock and uniform grading remain critical procurement criteria. Availability through established quarry networks also supports reliable supply for ready mix operators serving urban and industrial corridors. Key companies participating in this segment include Heidelberg Materials AG, Buzzi SpA and R.W. Sidley, Inc.
By Application - Infrastructure leads as governments prioritize transport and utility assets.
On the basis of Application, the market is classified into Commercial Construction, Residential Construction, Infrastructure and Mining. Infrastructure held the dominant share of 36.8% in 2024. Growth stems from rising investments in roads, airports, tunnels, ports and water systems, where contractors favor ready mix concrete for speed, quality assurance and labor efficiency. Public procurement models also increasingly specify performance-grade mixes and dependable onsite delivery. Key companies active in this segment include CEMEX, S.A.B. de C.V., HOLCIM and ACC Limited.
Key Growth Drivers
Infrastructure spending accelerates volume demand
Public infrastructure continues to be the clearest structural engine of ready mix concrete demand because governments and municipalities are still channeling capital into roads, bridges, rail systems, water networks, ports, and energy-linked civil works that require high-volume, specification-driven concrete supply delivered on tightly managed schedules. These projects favor centralized batching and programmed dispatch because contractors need consistent mix quality, repeatable performance, and dependable cycle times across large repetitive pours where on-site mixing would create greater material handling complexity, quality variation, and execution risk.
eady mix concrete therefore fits modern infrastructure delivery especially well, as it helps civil contractors reduce site congestion, improve productivity, and maintain construction sequencing on complex works such as tunnels, bridge decks, logistics corridors, and treatment facilities. A strong industry proof point comes from CRH, which reported annualized readymixed concrete sales volumes of 39.5 million cubic yards in 2025, while also noting that readymixed concrete is used in roads, tunnels, bridges, water management systems, and clean energy structures, underscoring how closely infrastructure activity translates into concrete demand.
Urban housing and commercial development support recurring demand
Urban migration, household formation, and redevelopment of older city districts continue to create a durable base of demand for ready mix concrete across residential and commercial construction, particularly as developers pursue faster execution and more predictable build quality in increasingly space-constrained urban environments. Compared with site mixing, ready mix concrete helps builders reduce dependence on manual labor, improve uniformity across repeated pours, and maintain tighter control over strength and workability in apartment towers, office complexes, retail projects, and institutional buildings where consistency matters across multiple floors and phases.
Its value becomes even clearer in dense cities, where limited storage space for cement, sand, and aggregates makes centralized batching and scheduled delivery far more practical than handling raw materials on site. The urbanization backdrop remains powerful, with the United Nations reporting that cities housed 45 percent of the world’s 8.2 billion people in 2025 and that the number of megacities had grown from 8 in 1975 to 33 in 2025, reinforcing why developers increasingly rely on scalable concrete supply models built for dense urban growth.
Industrialized construction raises preference for controlled batching Construction firms are placing greater emphasis on productivity, traceability and waste reduction, which strengthens the case for ready mix concrete over site-mixed alternatives. Centralized batching plants deliver better consistency in water-cement ratios, admixture dosing and compressive strength performance. This is increasingly important for high-rise structures, precast integration and projects using pumpable or specialty mixes. Producers also use digital dispatch, fleet tracking and automated plant controls to improve turnaround times and reduce rejected loads. As contractors face labor shortages and tighter project timelines, demand is shifting toward supplier-managed concrete procurement models that can deliver reliable volume, compliance and documentation.
Key Trends & Opportunities
Trend - Low-carbon concrete gains commercial traction Producers are accelerating development of lower-emission ready mix products by increasing use of supplementary cementitious materials, optimized clinker factors and carbon-aware mix design tools. This trend is strongest in commercial and infrastructure projects where procurement teams now evaluate embodied carbon alongside strength and cost. Several multinational suppliers have expanded low-carbon branded concrete portfolios across Europe, North America and Asia Pacific. One clear market signal is that major global cement and concrete producers now report millions of tons of low-carbon product sales annually, showing that greener mix specifications are moving from pilot phase to mainstream procurement in large projects.
Trend - Digital batching and fleet optimization improve service economics Ready mix suppliers are investing in plant automation, telematics and dispatch software to improve batch accuracy, reduce fuel use and manage time-sensitive deliveries more effectively. These systems help operators match truck cycles to site demand, reduce idle time and limit returned concrete. Digital tools also improve customer visibility into pour scheduling and quality records. In fragmented local markets, operational technology is becoming an important differentiator because service reliability often influences contractor retention more than pure price competition.
Opportunity - Public transit, water and energy projects create premium mix demand Large projects in rail, water infrastructure, industrial parks and energy facilities are creating opportunities for suppliers that can deliver high-performance mixes at scale. These applications often require pumpability, sulfate resistance, temperature control or durability against marine and chemical exposure. Suppliers with technical support teams and fixed plant networks near project corridors are well positioned to capture these contracts. The opportunity is especially attractive in regions increasing capital expenditure on resilient infrastructure and utility modernization, where project owners value consistency and compliance over lowest upfront price.
Opportunity - Recycled aggregates and circular materials expand differentiation Environmental constraints on natural aggregate extraction are opening new opportunities for ready mix concrete producers to integrate recycled aggregates, slag and other industrial byproducts into commercial product lines. This strategy can reduce landfill dependence and improve sustainability credentials for public tenders and private green building programs. Companies that secure local recycling streams and adapt mix designs to regional codes can create margin upside through differentiated offerings. The opportunity is strongest in urban markets where demolition waste volumes are high and transport costs for virgin aggregates continue to rise.
Key Challenges
Challenge - Raw material and freight volatility pressure margins Ready mix concrete producers face persistent volatility in cement, aggregates, admixtures, diesel and freight costs. Because concrete is highly price sensitive and sold within limited delivery radiuses, producers cannot always pass through cost inflation immediately. Margin pressure becomes more acute in fragmented markets where local competition remains intense and project bidding cycles lock in prices early. Weather disruptions, quarry restrictions and fuel swings further complicate production planning and fleet utilization.
Challenge - Short shelf life limits logistics flexibility Concrete must be delivered and placed within tight time windows, creating a structural logistics challenge for suppliers and contractors. Traffic congestion, labor shortages, delayed site readiness and pump availability can increase returned loads and reduce plant productivity. These factors are especially problematic for urban projects and remote infrastructure sites. Compliance with stricter environmental rules on dust, water use and emissions also raises operating complexity for batching plants and transport fleets.
Regional Analysis
North America Ready Mix Concrete Market Market Trends North America accounted for 21.3% of global Ready Mix Concrete Market revenue in 2024. Regional demand is supported by transport upgrades, warehousing construction, data center development and public funding for bridges, roads and water systems. Contractors favor ready mix concrete because labor costs are high and job sites increasingly require dependable quality documentation and timed delivery. Stationary batching plants dominate metro markets, while mobile systems support remote energy and infrastructure work. Product demand also reflects growing adoption of performance mixes with supplementary cementitious materials as buyers seek lower embodied carbon without sacrificing strength or placement efficiency.
Asia Pacific Ready Mix Concrete Market Market Trends Asia Pacific accounted for 44.2% of global Ready Mix Concrete Market revenue in 2024. The region leads because of sustained urbanization, dense residential construction and extensive public investment in rail, road, port and utility networks. China, India and Southeast Asia maintain broad installed batching capacity and strong aggregate supply chains that support high-volume production. Price competition is active, yet scale advantages favor integrated producers with quarries, cement plants and dispatch networks. Demand remains strongest for infrastructure-grade and commercial mixes, while growing urban redevelopment also supports recurring residential consumption.
Europe Ready Mix Concrete Market Market Trends Europe accounted for 18.7% of global Ready Mix Concrete Market revenue in 2024. Market performance is shaped by renovation activity, transport modernization and strict environmental expectations in public and private procurement. Buyers increasingly request low-carbon mixes, recycled inputs and documented product performance, pushing suppliers to refine mix design and cement substitution strategies. Mature distribution networks and local plant density support service quality, but energy costs and environmental compliance raise operating pressure. Demand is strongest in commercial, civil engineering and municipal works where consistency and lifecycle durability influence purchasing decisions.
Latin America Ready Mix Concrete Market Market Trends Latin America accounted for 8.4% of global Ready Mix Concrete Market revenue in 2024. Regional growth is linked to housing needs, selective infrastructure expansion and commercial development in major urban centers. Ready mix adoption improves where contractors seek faster construction cycles and better control of material waste, especially in large cities with constrained site storage. Market conditions vary widely by country because interest rates, public budgets and logistics quality affect construction starts and project execution. Local and multinational suppliers compete through plant proximity, contractor relationships and the ability to offer reliable delivery in congested urban markets.
Middle East & Africa Ready Mix Concrete Market Market Trends Middle East & Africa accounted for 7.4% of global Ready Mix Concrete Market revenue in 2024. Demand is driven by urban megaprojects, industrial zones, tourism developments and transport investments in Gulf markets, while selected African countries contribute through housing and basic infrastructure programs. High-temperature performance, pumping capability and durability specifications are important purchasing criteria in this region. Suppliers with onsite technical support, stable cement access and mobile batching capabilities hold advantages on large developments and remote projects. Competitive intensity is strongest around capital cities and major industrial corridors where project pipelines and payment visibility are better. Regional shares are rounded and therefore may not total exactly 100.0%.
Market Segmentations
- By Capacity
- Plant Capacity = 60 m/h
- Plant Capacity > 60 m/h
- By Plant Type
- Mobile Batching Plant
- Stationary Batching Plant
- By Aggregate Type
- River Gravel
- Crushed Stone
- Slag
- By Application
- Commercial Construction
- Residential Construction
- Infrastructure
- Mining
- By Geography
- North America
- U.S.
- Canada
- Mexico
- Europe
- Germany
- France
- U.K.
- Italy
- Spain
- Rest of Europe
- Asia Pacific
- China
- Japan
- India
- South Korea
- South-east Asia
- Rest of Asia Pacific
- Latin America
- Brazil
- Argentina
- Rest of Latin America
- Middle East & Africa
- GCC Countries
- South Africa
- Rest of the Middle East and Africa
- North America
Competitive Landscape
The Ready Mix Concrete Market shows moderate to high competitive intensity, with global multinationals and regional suppliers competing on plant footprint, delivery reliability and mix innovation. Leading companies are expanding low-carbon concrete portfolios, higher-performance mixes and digital quality-control systems to strengthen differentiation. Product strategy increasingly centers on customized solutions for infrastructure, commercial and residential projects rather than standard volume supply alone. Distribution remains critical because concrete economics depend on plant proximity, fleet availability and dispatch efficiency. Partnerships with contractors, developers and public project owners support long-term volume visibility. Integrated players with cement, aggregates and ready mix operations hold cost and sourcing advantages, while local specialists compete through service responsiveness and established customer relationships in metro and peri-urban markets.
Key Player Analysis
Recent Developments
- In February 2026, Cemex expanded its sustainability partnerships across EMEA, including a collaboration in the UAE with RMB ReadyMix Concrete to fully integrate Vertua cement into RMB’s operations. The same report said Cemex also partnered with Spanish developer Metrovacesa to supply more than 19,500 cubic metres of Vertua lower-carbon concrete for three residential projects, with the use of the product estimated to avoid about 1,709 tonnes of CO2 during construction. This development is important for the ready-mix concrete sector because it shows how producers and downstream concrete operators are moving from pilot sustainability claims to embedded, commercial-scale low-carbon supply partnerships.
- In August 2025, Lafarge Africa launched EcoCrete, which it described as Nigeria’s first low-carbon ready-mix concrete product. The company said EcoCrete delivers at least a 20% reduction in CO2 emissions compared with conventional CEM I concrete while maintaining comparable performance and reliability, and it also converted its Abuja Ready-Mix plant to 100% EcoCrete production as the first phase of the rollout. This was a notable product launch because it tied a new low-carbon mix directly to full plant conversion, showing a shift from niche green-concrete offerings to mainstream ready-mix manufacturing adoption.
- In February 2026, GCC completed the acquisition of aggregates, asphalt, and ready-mix concrete operations in El Paso, Texas, strengthening its footprint in one of its core cross-border markets. The announcement said the acquired platform generates about US$30 million in annual revenue and includes aggregate reserves with an estimated life of around 50 years, giving the company both immediate operating scale and longer-term raw material security. For the ready-mix concrete industry, this matters because it reflects continued vertical integration, where producers are pairing concrete capacity with upstream material control to improve supply resilience and cash flow.
- In March 2026, Holcim New Zealand acquired the Stevenson ready-mix concrete business, adding four plants in Rānui, Penrose, East Tāmaki, and Drury to expand its Auckland supply network. Holcim said the deal supports infrastructure, commercial, and residential construction demand in a key growth corridor and broadens access to products such as ECOPact low-carbon concrete, Superslab foundations, engineered steel fibre floor systems, and Hydromedia permeable concrete. This acquisition stands out as a meaningful sector development because it combines network expansion with broader availability of specialized and lower-carbon ready-mix solutions, rather than adding commodity capacity alone.
Request a Free Sample
Fill in your details and we'll send you a free sample report.
- Sample data tables & charts
- Research methodology
Need a Custom Version of This Report?
Tailor the scope, geography, or segments to your exact requirements.
- Custom geography or segment scope
- Direct access to our analyst team
Frequently Asked Questions
What is the market size of the Ready Mix Concrete Market in 2024?
What is driving growth in the Ready Mix Concrete Market?
What are the key trends in the Ready Mix Concrete Market?
Which segment leads the Ready Mix Concrete Market by application?
Who are the top players in the Ready Mix Concrete Market?
Table of Content
Chapter 1 Market Segmentation
- 1.1 Segmentation Framework
- 1.1.1 Product and Service Classification
- 1.1.2 Application and End-Use Classification
- 1.1.3 Technology and Solution Classification
- 1.1.4 Customer and Distribution Channel Classification
- 1.1.5 Geographic Segmentation
- 1.1.6 Market Segment Definitions and Boundaries
Chapter 2 Introduction
- 2.1 Report Objectives and Scope
- 2.2 Product Definition and Industry Terminology
- 2.3 Market Inclusions and Exclusions
- 2.4 Research Process
- 2.4.1 Primary Research and Expert Interviews
- 2.4.2 Secondary Research and Source Review
- 2.4.3 Top-Down and Bottom-Up Estimation
- 2.4.4 Data Triangulation and Verification
- 2.5 Market Size Measurement Basis
- 2.5.1 2024: USD 4892 Million → 2032: USD 6,851.10 Million
- 2.6 Historical and Forecast Reference Periods
- 2.6.1 Base Year: 2024
- 2.6.2 Forecast Period: 2024-2032
- 2.7 Research Assumptions and Limitations
Chapter 3 Executive Summary
- 3.1 Market Snapshot and Key Findings
- 3.2 Base-Year Market Size, 2024
- 3.3 Forecast Market Size, 2032
- 3.4 Revenue and Volume Growth Outlook
- 3.5 Key Demand and Supply Indicators
- 3.6 Leading Market Segments
- 3.7 Fastest-Growing Market Opportunities
- 3.8 Regional Performance Highlights
- 3.9 Technology and Industry Transformation
- 3.10 Competitive Landscape Summary
- 3.11 Analyst View and Strategic Implications
Chapter 4 Global Ready Mix Concrete Market Trends and Developments
- 4.1 Historical Industry Development
- 4.2 Recent Market Trends and Developments
- 4.3 Demand and Customer Behavior Trends
- 4.4 Technology and Product Innovation
- 4.5 Artificial Intelligence, Automation and Digitalization
- 4.6 Local Manufacturing and Supply Chain Realignment
- 4.7 Industry Partnerships, Mergers and Acquisitions
- 4.8 Sustainability and Circular Economy Developments
- 4.9 Government and Private Sector Investment Trends
- 4.10 Emerging Business Models and Commercialization
- 4.11 Industry Developments and Announcements
Chapter 5 Global Ready Mix Concrete Market Production, Supply and Demand Analysis
- 5.1 Demand Trend and Consumption Analysis
- 5.2 Demand Forecast, 2024-2032
- 5.3 Production and Output Trend
- 5.4 Production and Output Forecast, 2024-2032
- 5.5 Installed Capacity and Capacity Utilization
- 5.6 Company-Wise Production Plants and Statistics
- 5.6.1 Installed Production Capacity
- 5.6.2 Actual Production
- 5.6.3 Planned Capacity and Expansion Targets
- 5.7 Supply Chain Structure and Procurement Trends
- 5.8 Supply-Demand Gap and Bottlenecks
- 5.9 Import Dependence and Sourcing Structure
- 5.10 Contract Manufacturing and Outsourcing
- 5.11 Regional Supply and Demand Concentration
Chapter 6 Global Ready Mix Concrete Market Pricing Analysis
- 6.1 Pricing Structure and Measurement
- 6.2 Historical Pricing Trends
- 6.3 Pricing Outlook, 2024-2032
- 6.4 Average Selling Price and Unit Economics
- 6.5 Pricing by Product and Market Segment
- 6.6 Geographic Pricing Differences
- 6.7 Key Input, Energy, Labor and Logistics Costs
- 6.8 Contract Pricing and Purchasing Models
- 6.9 Pricing Sensitivity and Competitive Positioning
- 6.10 Price, Margin and Profitability Implications
Chapter 7 Global Ready Mix Concrete Market Dynamics
- 7.1 Market Growth Drivers
- 7.1.1 Demand-Side Drivers
- 7.1.2 Technology and Innovation Drivers
- 7.1.3 Infrastructure and Investment Drivers
- 7.1.4 Regulatory and Policy Drivers
- 7.2 Market Restraints
- 7.2.1 Cost and Affordability Constraints
- 7.2.2 Technology and Adoption Barriers
- 7.2.3 Supply Chain and Operational Constraints
- 7.3 Market Challenges
- 7.3.1 Competitive Pressure and Margin Erosion
- 7.3.2 Skills, Infrastructure and Implementation Gaps
- 7.4 Emerging Market Opportunities
- 7.5 Market Dynamics Impact and Time-Horizon Assessment
Chapter 8 Global Ready Mix Concrete Value Chain Analysis
- 8.1 Industry Value Chain Overview
- 8.2 Upstream Suppliers and Critical Inputs
- 8.3 Technology and Component Providers
- 8.4 Manufacturing or Service Delivery
- 8.5 Distribution, Channel Partners and Integrators
- 8.6 Downstream Applications and End Users
- 8.7 Value Addition and Profit Pools
- 8.8 Vertical Integration and Outsourcing
- 8.9 Supplier Concentration and Risk
- 8.10 Supply Chain Localization and Resilience
Chapter 9 Global Ready Mix Concrete Market Regulations and Policies
- 9.1 Relevant Laws, Standards and Compliance Frameworks
- 9.2 Product, Service, Safety and Quality Requirements
- 9.3 Government Policies, Incentives and Subsidies
- 9.4 Imports, Exports and Trade Barriers
- 9.5 Public Procurement and Local Content Requirements
- 9.6 Environmental and Sustainability Compliance
- 9.7 Upcoming Policy Changes and Market Implications
Chapter 10 Global Ready Mix Concrete Market Hotspots and Opportunities
- 10.1 Market Opportunity Mapping and Growth Hotspots
- 10.2 High-Growth Applications and Customer Groups
- 10.3 Underserved Markets and White-Space Opportunities
- 10.4 Emerging Technology and Product Opportunities
- 10.5 New Capacity and Investment Hotspots
- 10.6 Market Entry and Expansion Opportunities
- 10.7 Distribution and Partnership Opportunities
- 10.8 Near-Term and Long-Term Commercial Potential
- 10.9 Opportunity Attractiveness and Execution Risks
Chapter 11 Global Ready Mix Concrete Market Outlook, 2024-2032
- 11.1 Market Size and Analysis
- 11.1.1 Revenue (Market Measurement: 2024: USD 4892 Million → 2032: USD 6,851.10 Million)
- 11.1.2 Market Volume and Quantity Sold
- 11.1.3 Historical Market Size
- 11.1.4 Base-Year Market Size, 2024
- 11.2 Market Forecast, 2024-2032
- 11.2.1 Revenue Forecast to 2032
- 11.2.2 Volume Forecast to 2032
- 11.2.3 CAGR and Year-on-Year Growth
- 11.2.4 Incremental Revenue Opportunity
- 11.3 Forecast Assumptions and Scenario Analysis
- 11.3.1 Base-Case Forecast
- 11.3.2 Optimistic and Conservative Scenarios
- 11.3.3 Technology, Pricing and Policy Sensitivities
- 11.4 Market Attractiveness and Growth Outlook
Chapter 12 Global Ready Mix Concrete Market Segmentation and Outlook
- 12.1 Segmentation Summary and Market Shares, 2024
- 12.2 Largest and Fastest-Growing Segments
- 12.3 Segment Growth Comparison
- 12.4 Segment Attractiveness and Priority Matrix
Chapter 13 Global Ready Mix Concrete Geographic Market Outlook, 2024-2032
- 13.1 Regional Market Size and Share, 2024
- 13.2 Regional Market Forecast, 2024-2032
- 13.3 Regional Pricing, Production and Demand Differences
- 13.4 North America
- 13.4.1 United States
- 13.4.2 Canada
- 13.4.3 Mexico
- 13.5 Europe
- 13.5.1 Germany
- 13.5.2 France
- 13.5.3 Italy
- 13.5.4 United Kingdom
- 13.5.5 Spain
- 13.5.6 Poland
- 13.5.7 Russia
- 13.5.8 Netherlands
- 13.5.9 Belgium
- 13.5.10 Sweden
- 13.5.11 Denmark
- 13.5.12 Norway
- 13.5.13 Rest of Europe
- 13.6 Asia Pacific
- 13.6.1 China
- 13.6.2 India
- 13.6.3 Japan
- 13.6.4 South Korea
- 13.6.5 Thailand
- 13.6.6 Indonesia
- 13.6.7 Vietnam
- 13.6.8 Malaysia
- 13.6.9 Australia
- 13.6.10 Rest of Asia Pacific
- 13.7 Latin America
- 13.7.1 Brazil
- 13.7.2 Argentina
- 13.7.3 Colombia
- 13.7.4 Chile
- 13.7.5 Rest of Latin America
- 13.8 Middle East
- 13.8.1 Saudi Arabia
- 13.8.2 United Arab Emirates
- 13.8.3 Turkey
- 13.8.4 Israel
- 13.8.5 Iran
- 13.8.6 Rest of the Middle East
- 13.9 Africa
- 13.9.1 South Africa
- 13.9.2 Egypt
- 13.9.3 Nigeria
- 13.9.4 Morocco
- 13.9.5 Rest of Africa
- 13.10 Regional Investment, Policy and Supply Chain Differences
- 13.11 Regional Competitive Landscape
- 13.12 Geographic Growth Hotspots
Chapter 14 Global Ready Mix Concrete Technology, Innovation and Sustainability Outlook
- 14.1 Technology Landscape and Maturity
- 14.2 Product, Process and Service Innovation
- 14.3 AI, Automation and Digital Tools in the Industry
- 14.4 Technology Adoption and Performance Benchmarking
- 14.5 Innovation Pipeline and R&D Investment
- 14.6 Patent and Intellectual Property Trends
- 14.7 Energy Efficiency and Resource Management
- 14.8 Sustainability, Recycling and Circularity
- 14.9 Technology Roadmap, 2024-2032
- 14.10 Risks of Obsolescence and Technology Substitution
Chapter 15 Global Ready Mix Concrete Market Key Strategic Imperatives
- 15.1 Growth and Market Entry Priorities
- 15.2 High-Return Products and Segments
- 15.3 Pricing, Profitability and Cost Optimization
- 15.4 Technology Investment and Product Differentiation
- 15.5 Supply Chain Localization and Resilience
- 15.6 Distribution and Customer Acquisition
- 15.7 Partnership, Acquisition and Capacity Strategy
- 15.8 Regional Expansion Priorities
- 15.9 Short-, Medium- and Long-Term Actions
Chapter 16 Competition Outlook
- 16.1 Industry Competition Characteristics
- 16.2 Market Structure and Concentration
- 16.3 Market Share and Competitive Positioning, 2024
- 16.4 Company-Wise Revenue and Product Benchmarking
- 16.5 Production and Service Capacity Benchmarking
- 16.6 Technology, Pricing and Differentiation
- 16.7 Regional Footprint and Distribution Strength
- 16.8 Mergers, Acquisitions and Strategic Alliances
- 16.9 New Entrants and Competitive Threats
- 16.10 Porter's Five Forces and Industry Attractiveness
- 16.11 Competitive Outlook, 2024-2032
Chapter 17 Company Profiles
- 17.1 Company Coverage and Selection Criteria
- 17.2 Leading Market Participants – Standard Profile Structure
- 17.2.1 Business Description
- 17.2.2 Company Ownership and Geographic Presence
- 17.2.3 Product and Service Portfolio
- 17.2.4 Manufacturing and Operating Footprint
- 17.2.5 Production Capacity and Expansion Plans
- 17.2.6 Financial Performance and Investment
- 17.2.7 Market Share and Competitive Position
- 17.2.8 Technology and Innovation Capabilities
- 17.2.9 Strategic Alliances or Partnerships
- 17.2.10 Recent Developments
- 17.2.11 Growth Strategy and Outlook
- 17.3 Other Relevant Market Participants
Note: Every listed company is profiled on the structure shown under the first company. The company list is preliminary and may change based on research findings, market developments, data availability and client requirements.
Chapter 18 Disclaimer
- 18.1 Research and Forecast Disclaimer
- 18.2 Data Source and Estimation Limitations
Note: The depth of individual sections depends on data availability for this market. Volume, capacity, trade and other unit-based metrics are included where applicable.