
Quick answer
An electric vehicle charging station manufacturing plant assembling 30,000 AC wallboxes and 1,200 DC fast chargers a year, with in-house board assembly, cabinet integration and full-power testing, needs total CapEx of roughly USD 7–12.5 million in an Asian industrial park, including land and working capital margin. Gross margin typically runs 18–26% of ex-factory price, and payback falls in a 3.5–5.5 year band at about 70% utilization, longer if low-price wallboxes dominate.
Feasible for entrants with operator or fleet offtake, certified DC products and a local-content edge; a plant selling only commodity AC wallboxes faces Chinese export prices and thin margins.
Electric Vehicle Charging Station plant: key highlights
| Parameter | Indicative value | Note |
|---|---|---|
| Plant capacity | 30,000 AC wallboxes and 1,200 DC fast chargers a year | 7–22 kW AC and 60–240 kW DC, two shifts, 300 working days |
| Total CapEx | USD 7–12.5 million | Asian industrial park; land, building, SMT, assembly, test and burn-in, working capital margin |
| Raw material share of operating cost | 75–82% | Power modules, semiconductors, contactors, meters, cables, connectors, enclosures |
| Gross margin | 18–26% | On ex-factory price after components and direct conversion |
| Payback period | 3.5–5.5 years | At about 70% utilization from year two, including ramp-up |
| IRR | Available in report | Post-tax, 10-year model |
| Break-even | Available in report | Capacity utilization basis |
Ranges assume 30,000 AC wallboxes and 1,200 DC fast chargers a year, bought-in power modules, an 8,000 sq m building on 16,000 sq m in an Asian industrial park, assumed land and building rates, 2026 prices, about 70% utilization from year two, assumed ex-factory prices of USD 300–450 per wallbox and USD 18,000–28,000 per DC unit, and 88 rupees per USD. U.S. or EU sites cost more. The full report can be customized to any country.
What is an electric vehicle charging station?
An electric vehicle charging station, in manufacturing terms, is the equipment that delivers grid power to a vehicle battery: the enclosure, power electronics, control boards, metering, connectors and cable that make up an AC wallbox or a DC fast charger. AC units, usually 7–22 kW, pass alternating current to the car's onboard charger and contain mainly a contactor, a residual current device, a meter, a control board and communications. DC fast chargers, from about 50 kW to above 400 kW, carry rectifier and DC-DC converter modules that convert power inside the cabinet, so they are far heavier, costlier and harder to build.
The two families also sit in different customs lines. American customs authorities classified a 120 kW DC charging station under HS subheading 8504.40, static converters, in 2022, while a March 2025 ruling placed a wall-mounted AC unit that supplies unconditioned power under 8537.10, the subheading for control boards and panels up to 1,000 V. Products also differ by connector standard (CCS, NACS, CHAdeMO, GB/T or Type 2), power rating, cable length, payment hardware and software protocol such as OCPP. Buyers include charge point operators, utilities, fleet depots, automaker dealer networks, homebuilders and electrical distributors.
Electric vehicle charging station market overview and global demand
Credence Research values the global charging equipment market at USD 39.7 billion in 2024, growing at a 29.11% CAGR to about USD 306.4 billion by 2032. That implies roughly USD 51.2 billion in 2025, a figure derived from the 2024 value and the CAGR rather than separately reported. High-power hardware is the fastest-moving slice, tracked in the DC fast charging station market.
Physical volumes show where the units go. The International Energy Agency's Global EV Outlook 2026 counts more than 7 million public charging points worldwide at the end of 2025, after nearly 1.8 million were added during the year, a rise of more than 33%. China holds over 65% of the public stock and supplied more than 75% of 2025 growth, with its fast and ultra-fast points rising 40% to about 2.2 million. Europe's public network grew about 20%, led by the Netherlands, Germany and France, and the United States reached about 235,000 public points after record additions. Private chargers form an even larger unit market, at more than 43 million light-duty points globally.
For a manufacturer, that split matters. Wallboxes are a high-volume, price-sensitive business sold through distributors and automakers, while DC fast chargers are a lower-volume, higher-value business tied to operator tenders, highway programs and fleet depots. Ultra-fast units of 150 kW and above already make up close to 15% of public points, and local-content rules in North America and India are pulling final assembly closer to demand.
Electric vehicle charging station manufacturing process
Most charger plants are assemblers and integrators, not semiconductor makers. They buy power semiconductors, magnetics, contactors, connectors and often complete power modules, then add value through board assembly, cabinet integration, firmware and, above all, testing at real power.
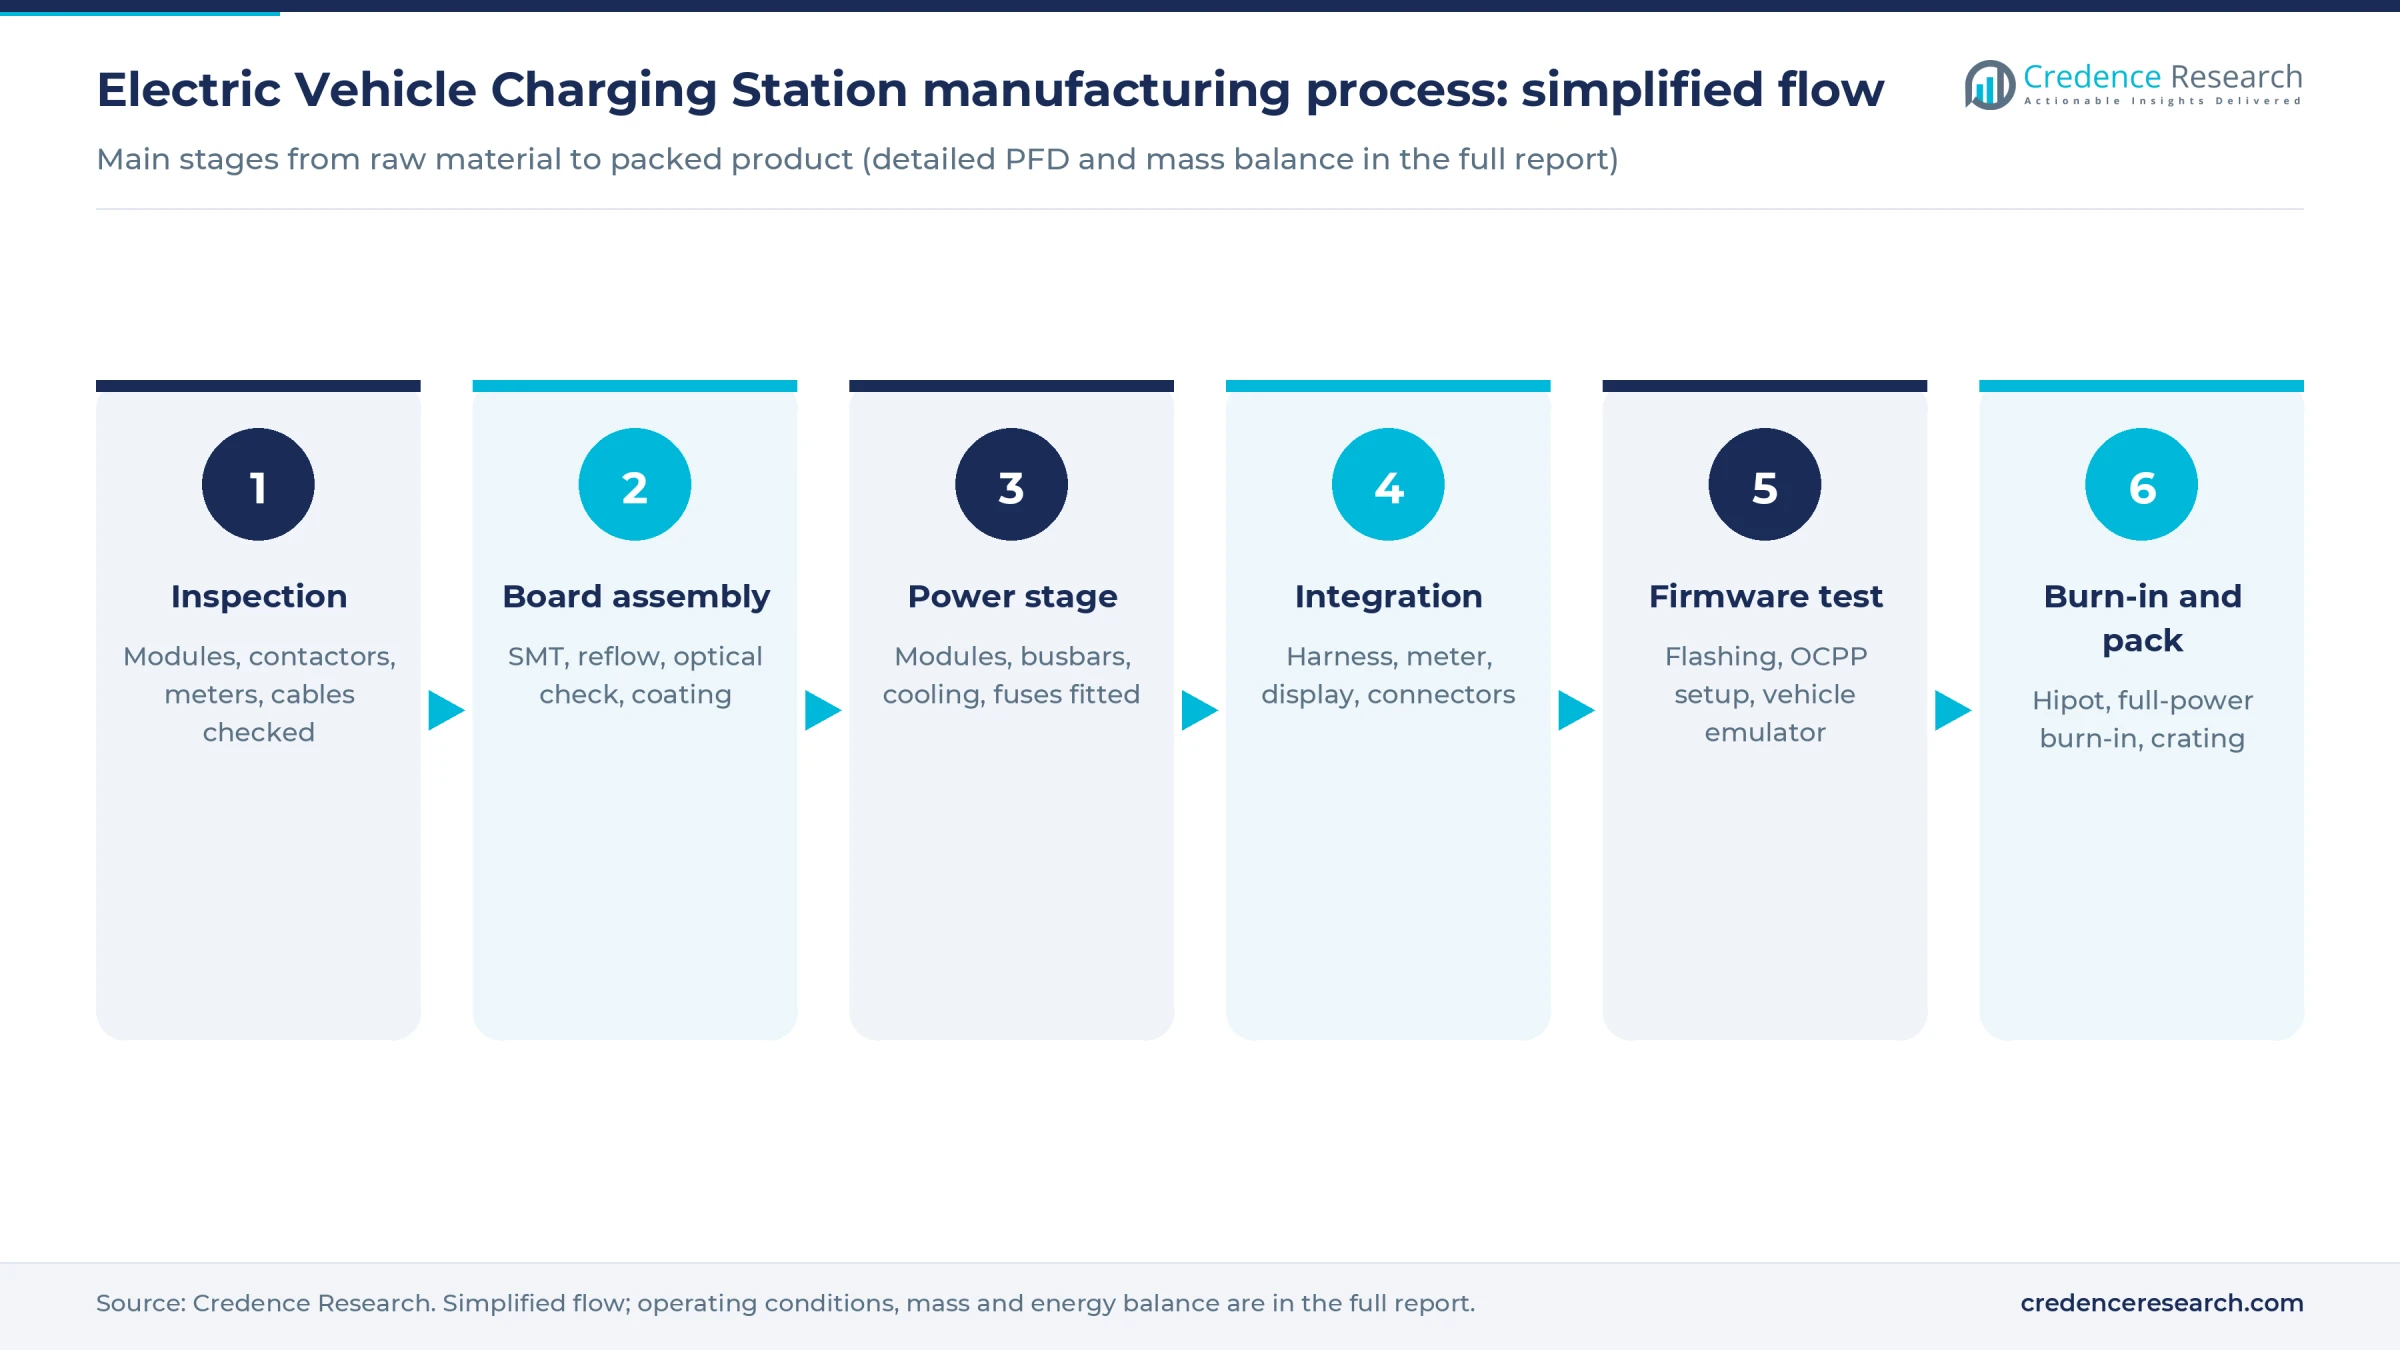
- Incoming inspection. Contactors, residual current devices, meters, cable assemblies, enclosures and power modules are checked against drawings and supplier test data.
- Board assembly. Control, communication and wallbox main boards are built on a surface mount line with paste printing, placement, reflow and optical inspection, then conformally coated for outdoor duty.
- Power stage assembly. For DC chargers, rectifier and DC-DC modules are mounted in the power cabinet with busbars, fans or liquid-cooling loops, fuses and isolation monitoring. Torque on high-current joints is logged, since loose connections are a common cause of field failures.
- Cabinet and dispenser integration. Harnesses, the meter, payment terminal, display, cable management and connectors are fitted. Wallboxes move down a short line, while DC units use station-based assembly; one European maker reports about two and a half hours per standard fast charger.
- Firmware and functional test. Units are flashed, configured for OCPP back-office communication and run against a vehicle emulator to check the charging handshake, metering accuracy and fault responses.
- Safety test, burn-in and packing. Each unit passes dielectric strength and ground continuity checks, then a burn-in at rated power. Regenerative loads return most test energy to the grid, as a June 2026 report from Alpitronic's Bolzano plant described alongside 18 parallel burn-in boxes and a 2.5 MW grid connection. Units are then labeled and crated.
Quality risk concentrates in high-current joints, cooling and software. A charger that fails in service damages the operator's uptime record, which public funding programs increasingly track, so first-pass yield at burn-in and early-life failure rates are the numbers buyers ask about first.
Electric vehicle charging station plant setup cost
The representative plant assembles 30,000 AC wallboxes of 7–22 kW and 1,200 DC fast chargers of 60–240 kW a year on two shifts, with bought-in power modules and in-house board assembly. Total project cost lands at roughly USD 7–12.5 million in an Asian industrial park, the cost region behind this range. U.S. or EU sites can cost 1.5–2.5 times as much (assumed), mainly because of land, buildings and labor, and the full report can be customized to any country.
Two disclosed plants anchor the scale. Exicom put about USD 24.5 million, converted at 88 rupees per dollar, into an 18.4-acre Hyderabad campus with about 280,000 sq ft of built-up space that also makes batteries and critical power products. Wallbox spent about USD 11 million on a 12,000 sq m Arlington, Texas, plant for AC wallboxes. Both work out near USD 900–950 per sq m of factory floor, so an 8,000 sq m plant implies about USD 7.5 million before working capital.
Land shows how the bottom-up build works. The plant needs about 16,000 sq m for the factory, test yard, stores and truck access. At an assumed USD 30–70 per sq m, land costs about USD 480,000–1.1 million, and a leased plot shifts that cost into rent.
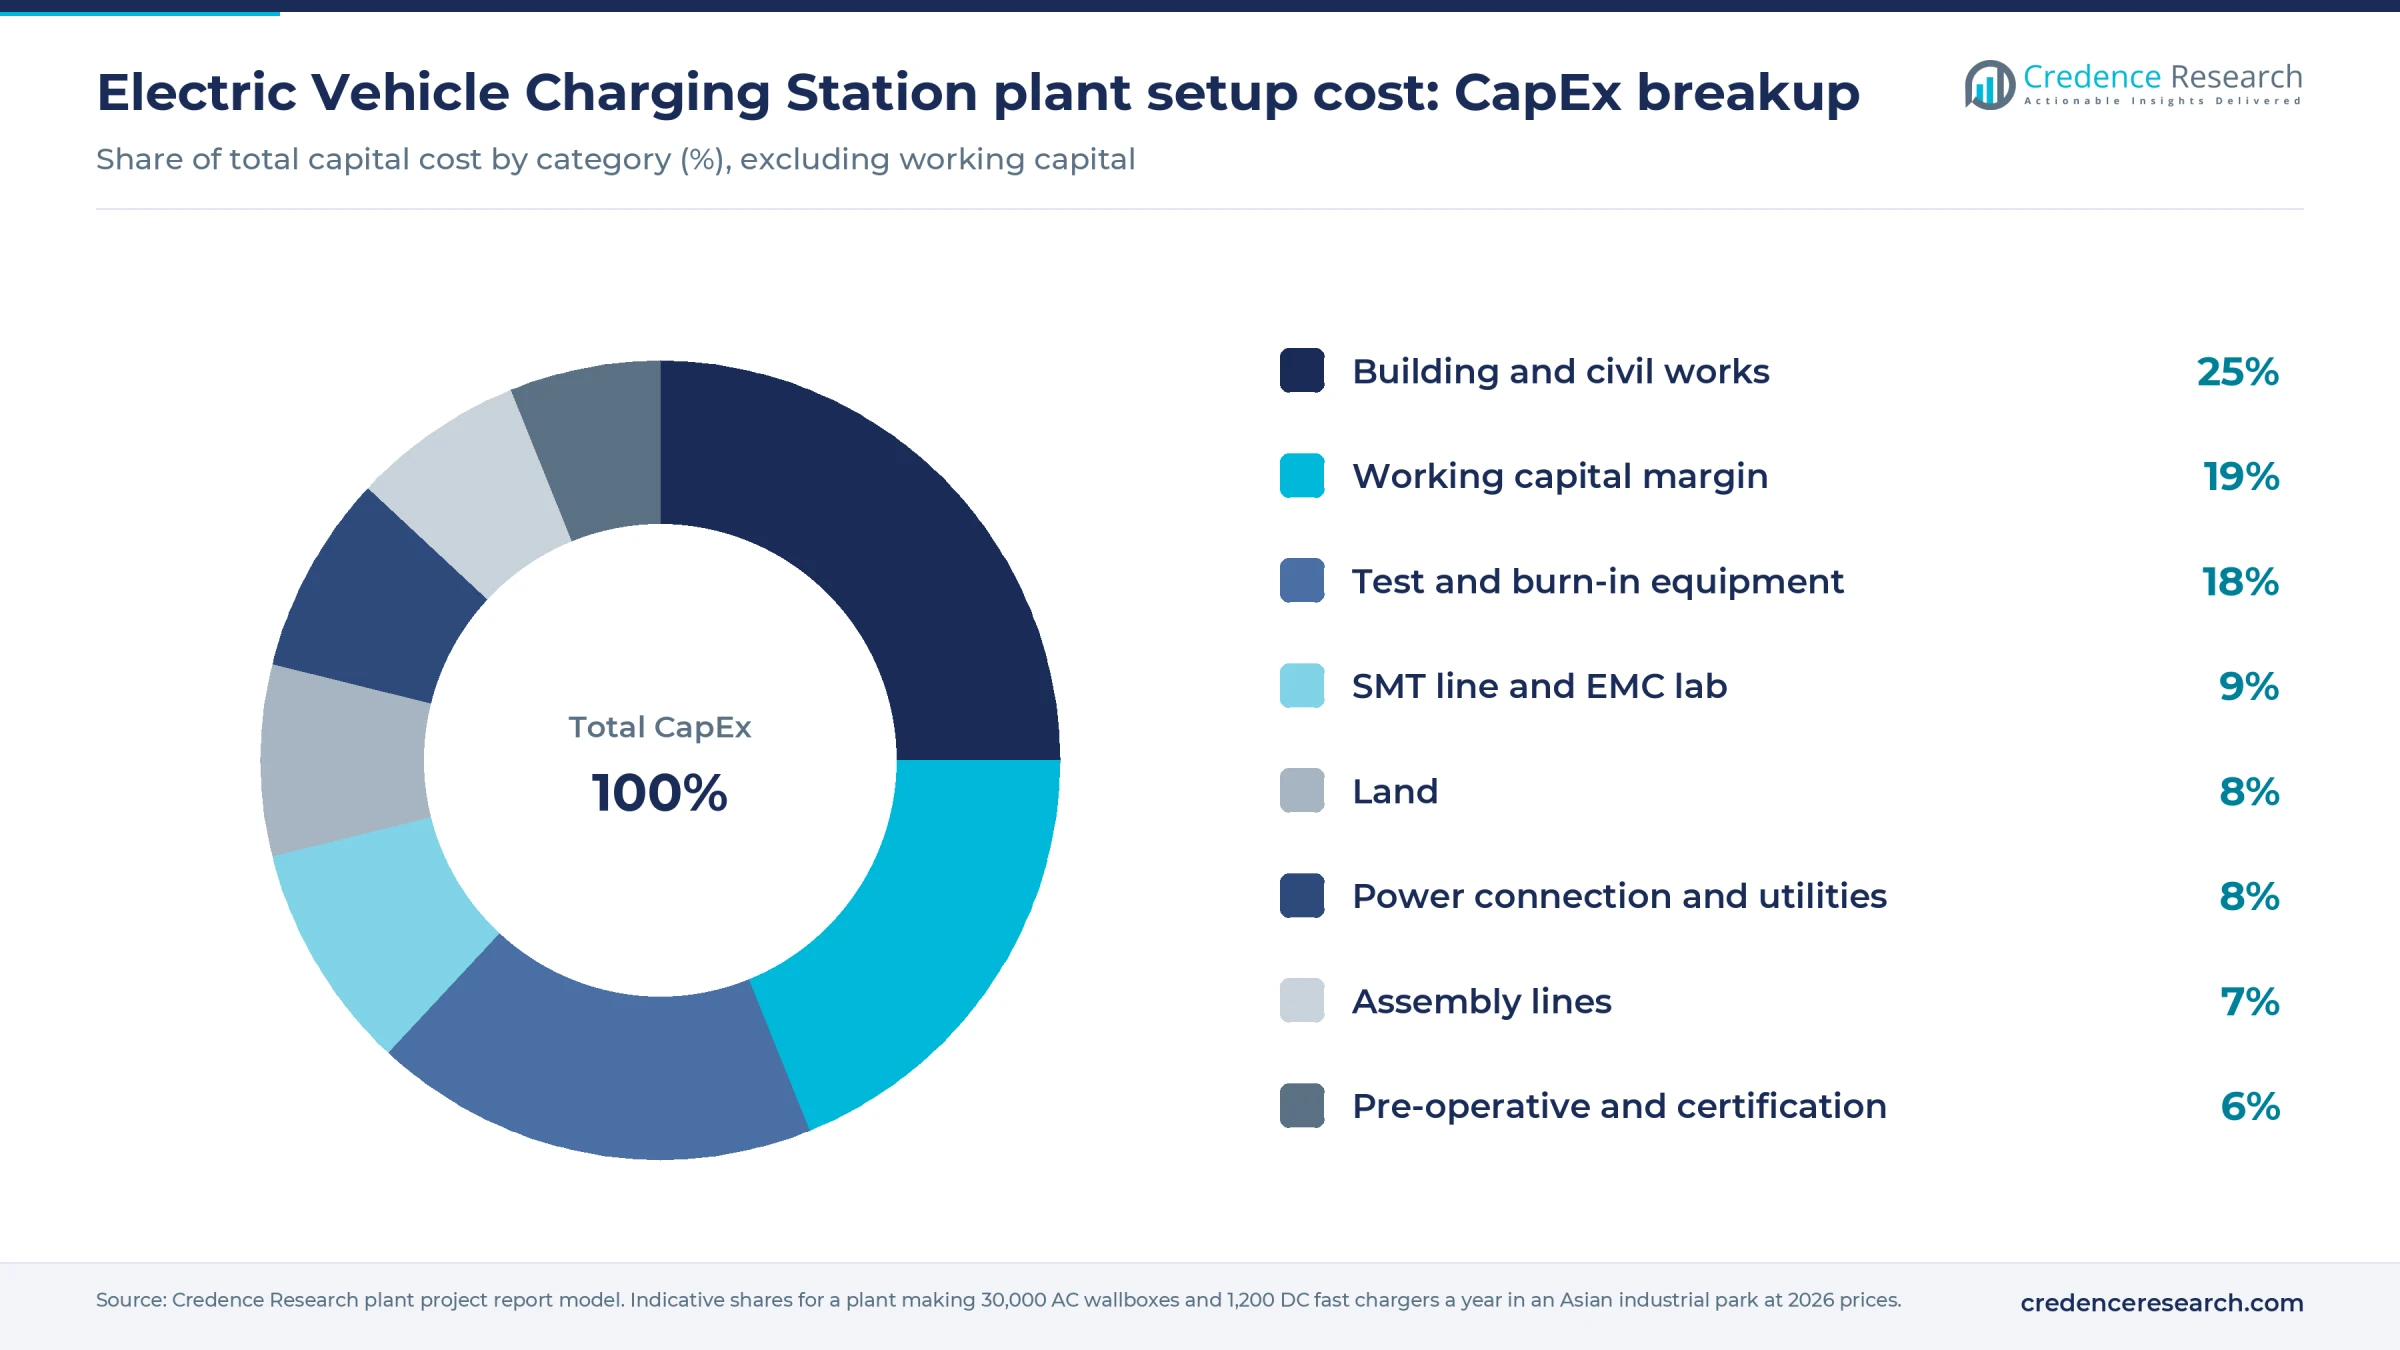
The 8,000 sq m building with static-safe floors and a reinforced test bay adds USD 2.0–2.8 million at an assumed USD 250–350 per sq m. Test and burn-in equipment, including regenerative loads, vehicle emulators and safety testers, takes USD 1.2–2.2 million (assumed), the largest machinery item. Assembly lines need USD 500,000–900,000 (assumed). The SMT line, priced from supplier-published ranges, and an EMC pre-compliance lab (assumed) together take USD 600,000–1.2 million. Power connection and utilities add USD 600,000–1.0 million (assumed), and pre-operative costs with product certification USD 400,000–800,000 (assumed). Working capital margin is about USD 1.3–2.4 million.
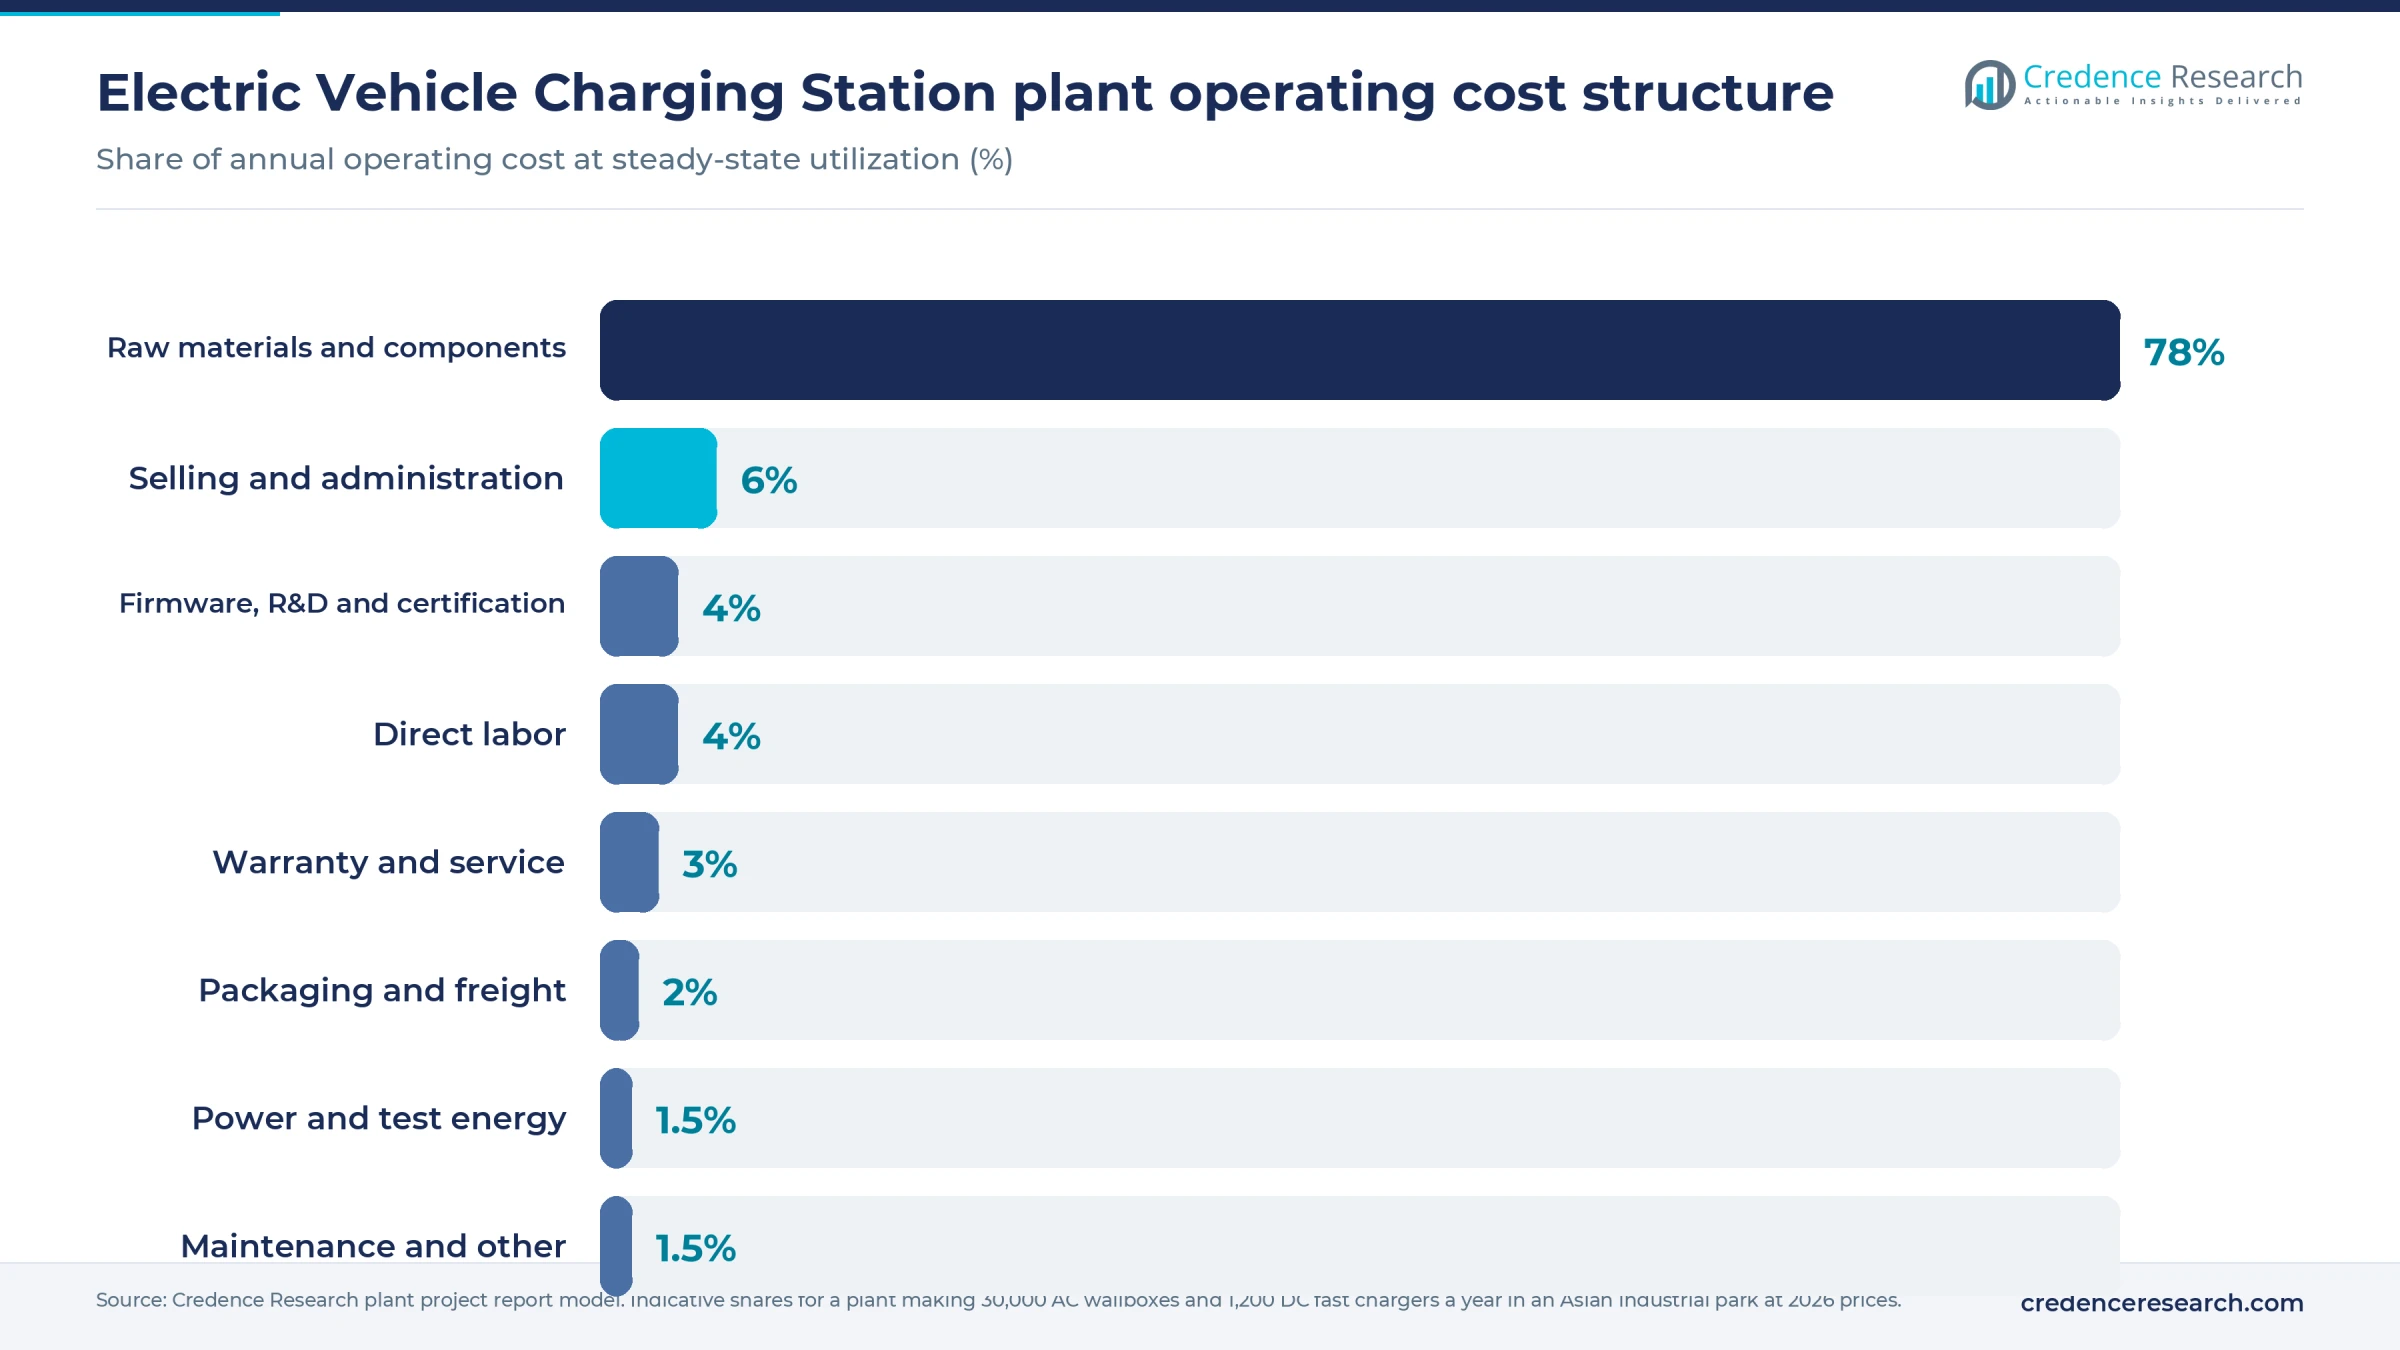
Operating cost is dominated by bought components, with power modules, semiconductors, copper and connectors making up most of the bill.
Machinery and raw materials for an EV charging station plant
The machinery list covers a surface mount line with paste printer, placement machines, reflow oven and automated optical inspection, a selective soldering station, conformal coating, wallbox assembly conveyors, DC cabinet stations with jib cranes, torque-controlled tools, cable crimping and harness benches, and a laser marker. Testing is the heaviest part: regenerative AC and DC electronic loads, grid simulators, vehicle charging emulators for CCS, NACS and other protocols, dielectric and ground bond testers, burn-in cells and an EMC pre-compliance setup. Support systems include a medium-voltage substation sized for full-power testing and a backup generator.
Key inputs are rectifier and DC-DC power modules, silicon carbide and silicon power semiconductors, magnetics, film capacitors, contactors and relays, residual current devices, energy meters, communication modules, touchscreens, payment terminals, charging cables and connectors, copper busbars, and steel or aluminum enclosures. Demand for power stages is covered in the EV charger converter module market.
Sourcing is global, and China supplies most charger power modules, magnetics, enclosures and cable assemblies at the lowest cost. Silicon carbide devices come mainly from the United States, Europe and Japan, while contactors, meters and protection devices come from Europe, Japan and China. Connectors and liquid-cooled cables for high-power units come largely from Europe and China. Plants selling into programs with domestic-content rules need a second, local supply chain for enclosures and cabinets.
Electric vehicle charging station business profit margin and ROI
Margins depend on product mix, purchasing power and warranty performance. Public equipment prices in the United States, which the U.S. Alternative Fuels Data Center cites at about USD 3,500 per Level 2 connector and USD 38,000–90,000 per DC fast connector, sit well above Asian ex-factory prices, which this plan assumes at USD 300–450 per AC wallbox and USD 18,000–28,000 per DC unit. With components at an assumed 66–74% of sales and direct conversion near 8%, gross margin comes to about 18–26%.
At 70% utilization the plant ships about 21,000 wallboxes and 840 DC units, for sales of about USD 21–33 million. DC chargers bring about 70% of revenue. After selling, firmware development, warranty and administrative costs of 9–12% of sales, post-tax cash profit of about USD 2.0–3.1 million supports a payback of 3.5–5.5 years on a midpoint investment near USD 9.75 million, including ramp-up. A wallbox-heavy mix or slow tender wins would stretch it.
| Metric | Value |
|---|---|
| Gross margin | 18–26% |
| Payback period | 3.5–5.5 years |
| IRR (post-tax) | Available in report |
| NPV | Available in report |
| ROI | Available in report |
| DSCR | Available in report |
Sensitivity is strongest to power module cost: if modules are about 40% of DC charger material cost (assumed), a sustained 10% price rise without a list price revision trims gross margin by about 2 percentage points.
How to start an EV charging station business, licenses and approvals
A new plant needs business and tax registration, land use and building permits, an environmental permit or consent, occupational safety registration, a grid connection agreement sized for the test load, and import-export registration for components. Assembly itself is low-impact, though solder fumes, coating solvents and electronic scrap need controls. The bigger gate is product approval: each charger family needs electrical safety, electromagnetic compatibility and connector conformity backed by type tests, with metering, cybersecurity and payment rules added for public units.
| Market | Product safety and certification | Program and installation rules |
|---|---|---|
| United States | Listing by an OSHA Nationally Recognized Testing Laboratory, typically to UL 2594 for AC equipment and UL 2202 for DC charging systems, with UL 2231 personnel protection; FCC Part 15 emission limits | National Electrical Code Article 625; for federally funded sites, 23 CFR 680.106 requires NRTL certification and ENERGY STAR for AC Level 2 units, plus FHWA Buy America rules |
| European Union | CE marking under the Low Voltage Directive 2014/35/EU, EMC Directive 2014/30/EU, RoHS Directive 2011/65/EU and, where wireless modules are fitted, the Radio Equipment Directive, using the EN IEC 61851 series and IEC 62196 connectors | Alternative Fuels Infrastructure Regulation (EU) 2023/1804 for public chargers, including ad hoc card payment; national metrology rules for billing meters; WEEE registration |
| India | Conformity to the Bureau of Indian Standards IS 17017 series, aligned with IEC 61851, with type tests at NABL-accredited labs such as ARAI or ICAT | Ministry of Power guidelines for EV charging infrastructure issued in 2024; distribution company connection approval for public sites |
Rules in this category move quickly, so applicants should confirm the version in force with the regulator before freezing a design.
Key electric vehicle charging station manufacturers and developments
Global supply is led by ABB E-mobility in Switzerland, Alpitronic in Italy, Kempower in Finland, Wallbox in Spain, Siemens and Schneider Electric in Europe, ChargePoint, Tesla and BTC Power in the United States, Delta Electronics in Taiwan, SK Signet in South Korea, and TELD, Star Charge and XCharge in China. Exicom, which acquired Australia's Tritium in 2024, is a leading Indian specialist, with Servotech and Delta's Indian unit also active.
- February 2026. The U.S. Department of Transportation proposed raising the Buy America requirement for FHWA-funded chargers from 55% to as much as 100% domestic component cost, which would require U.S.-made units.
- March 2026. Exicom opened its Hyderabad plant, a USD 24.5 million investment that raises capacity 2.5 times in its first phase and will build liquid-cooled power modules.
- March 2026. Alpitronic unveiled the Hypercharger HYC400 Series 2, a 400 kW unit built from up to four 100 kW silicon carbide power modules.
For a new entrant, these moves point toward local assembly near protected demand and toward modular silicon carbide power stages. Connected features tracked in the smart EV charger market also separate premium wallboxes from commodity units.
What's inside the Electric Vehicle Charging Station project report PDF
The report runs to 21 chapters. Open a chapter to see its sections.
1. Preface
2. Scope and Methodology
- 2.1 Objectives of the Study
- 2.2 Stakeholders
- 2.3 Research Methodology
- 2.4 Data Sources and Key Assumptions
3. Executive Summary
- 3.1 Market Snapshot
- 3.2 Project at a Glance (Capacity, CapEx, OpEx)
- 3.3 Key Financial Indicators (IRR, NPV, Payback, Break-even)
- 3.4 Feasibility Verdict
4. Product Overview
- 4.1 Electric Vehicle Charging Station Definition and Properties
- 4.2 Grades and Specifications (BIS / ISO / ASTM)
- 4.3 HS Code and Classification
- 4.4 Key Applications
- 4.5 Substitutes
5. Global Electric Vehicle Charging Station Market
- 5.1 Market Overview
- 5.2 Historical and Current Market Performance (Volume and Value)
- 5.3 Market Breakup by Grade / Type
- 5.4 Market Breakup by End-Use Industry
- 5.5 Market Breakup by Region
- 5.6 Market Drivers, Restraints and Trends
- 5.7 Value Chain Analysis
- 5.8 Market Forecast
6. Target Country Electric Vehicle Charging Station Market Analysis
- 6.1 Demand and Supply Analysis
- 6.2 Installed Capacity vs Demand Gap
- 6.3 Import Dependence
- 6.4 Demand Forecast by End-Use
7. Trade Analysis
- 7.1 Imports by Volume, Value and Country
- 7.2 Exports by Volume, Value and Country
- 7.3 Trade Balance and Opportunities
8. Price Analysis
- 8.1 Historical Electric Vehicle Charging Station Price Trends by Region
- 8.2 Raw Material / Feedstock Price Trends and Linkage
- 8.3 Price Forecast
- 8.4 Margins Across the Value Chain
9. Competitive Landscape
- 9.1 Market Structure
- 9.2 Key Players and Installed Capacities
- 9.3 Profiles of Key Players
- 9.4 Recent Developments (Expansions, M&A, New Plants)
10. Manufacturing Process and Technology
- 10.1 Comparison of Technology Routes
- 10.2 Selected Route and Process Flow Diagram
- 10.3 Unit Operations Involved
- 10.4 Chemical Reactions Involved
- 10.5 Mass Balance and Raw Material Requirements
- 10.6 Energy Balance
- 10.7 Quality Assurance Criteria and Technical Tests
- 10.8 By-products and Waste Handling
- 10.9 Technology Licensors / Providers
11. Project Details, Requirements and Costs
- 11.1 Land, Location and Site Development
- 11.1.1 Site Selection Criteria
- 11.1.2 Location Analysis
- 11.1.3 Land Requirement and Costs
- 11.1.4 Site Development Costs
- 11.2 Plant Layout
- 11.2.1 Layout Principles
- 11.2.2 Proposed Layout
- 11.2.3 Factors Influencing Layout
- 11.3 Civil Works and Buildings
- 11.4 Plant Machinery
- 11.4.1 Machinery Requirements and Specifications
- 11.4.2 Machinery Costs
- 11.4.3 Machinery Suppliers
- 11.5 Raw Materials
- 11.5.1 Requirements per Tonne of Output
- 11.5.2 Procurement and Sourcing
- 11.5.3 Costs
- 11.5.4 Suppliers
- 11.6 Packaging
- 11.6.1 Packaging Requirements
- 11.6.2 Packaging Costs
- 11.6.3 Packaging Suppliers
- 11.7 Storage and Material Handling
- 11.8 Transportation Requirements and Costs
- 11.9 Utilities
- 11.9.1 Power Requirements and Costs
- 11.9.2 Water Requirements and Costs
- 11.9.3 Steam, Fuel and Other Utilities
- 11.10 Manpower Requirements and Wages
12. Environment, Health, Safety and Sustainability
- 12.1 Effluent and Emissions Management
- 12.2 Hazard Classification and Safety Measures
- 12.3 Carbon Footprint
- 12.4 Green / Low-Carbon Process Options
13. Regulatory Procedures, Approvals and Certifications
- 13.1 Licences and Registrations
- 13.2 Environmental Clearances
- 13.3 Product Certifications (BIS, REACH, etc.)
- 13.4 Approval Timeline
14. Project Implementation Schedule
15. Project Economics
- 15.1 Capital Cost of the Project
- 15.2 Techno-Economic Parameters
- 15.3 Capacity Utilization and Ramp-up
- 15.4 Product Pricing and Margins
- 15.5 Income Projections
- 15.6 Expenditure Projections
- 15.7 Working Capital Requirement
- 15.8 Taxation
- 15.9 Depreciation
16. Financial Analysis
- 16.1 Projected Profit and Loss Account
- 16.2 Projected Cash Flow Statement
- 16.3 Projected Balance Sheet
- 16.4 Liquidity Analysis
- 16.5 Profitability Analysis (Payback, NPV, IRR, ROI)
- 16.6 Break-even Analysis
- 16.7 Debt Service Coverage Ratio (DSCR)
- 16.8 Sensitivity Analysis
- 16.9 Scenario and Uncertainty Analysis
17. Funding and Incentives
- 17.1 Means of Finance and Debt-Equity Structure
- 17.2 Loans and Financial Assistance
- 17.3 Government Schemes and Subsidies (PLI, State Policies)
18. Risk Assessment
- 18.1 Key Success Factors
- 18.2 Key Risk Factors
- 18.3 Risk Mitigation
19. Strategic Recommendations
20. Case Study of a Successful Venture
21. Appendix
- 21.1 Detailed Assumptions
- 21.2 Abbreviations
- 21.3 List of Tables and Figures
- 21.4 Sources
This page vs. the full report
| Data point | On this page (free) | In the full report |
|---|---|---|
| Total CapEx | One rounded range at one capacity | Exact figure at three capacities with a line-item breakup |
| CapEx breakup | Category shares (%) only | Cost, quantity and supplier for every machine |
| Operating cost | Share of raw materials, utilities and labor | Per-unit cost sheet with each input price and consumption |
| Profitability | Gross margin range and payback band | Exact IRR, NPV, ROI, break-even and DSCR |
| Financial statements | List of what is included | 10-year P&L, cash flow, balance sheet and Excel model |
| Sensitivity | One directional line | Full sensitivity and scenario tables |
| Process | Simplified flow diagram | Detailed process flow, mass and energy balance, operating conditions |
| Machinery | Names of the main machines | Specifications, capacity, cost and supplier list |
| Market | Headline size, growth and global demand | Segment, region, trade and price forecast tables |
| Suppliers and buyers | Supplier types and sourcing hubs | Named suppliers and buyers |
Electric Vehicle Charging Station project report: FAQs
How much does it cost to set up an EV charging station manufacturing plant?
Is a charger manufacturing plant the same as running a charging station?
Should a new plant make AC wallboxes or DC fast chargers?
What certifications does an EV charger need?
What is the profit margin in EV charger manufacturing?
What is the payback period for an EV charging station plant?
Does a charger plant need to make its own power modules?

About the analyst
Satyabrat Rajawat, Senior Research Analyst – Strategic Advisory
Satyabrat Rajawat is a Senior Research Analyst in the Strategic Advisory practice at Credence Research Inc. He works across domains, with the deepest coverage in packaging, automotive parts and machinery, and sits at the point where a client question becomes a research plan: he works with sales and business development teams to scope RFP and RFI responses, set the project methodology, and then build the quantitative databases and econometric forecasts that answer it.
Related market research
- Electric Vehicle Charging Stations Equipment Market Size, Share and Forecast 2032
- Electric Vehicle Charging Station Market Size, Share and Forecast 2032
- DC Fast Electric Vehicle Charging Station Market Size, Share and Forecast 2032
- AC Electric Vehicle Charging Station Market Size, Share and Forecast 2032
- EV Charger Converter Module Market Size, Share and Forecast 2032
- Smart EV Charger Market Size, Share and Growth Report 2032
More plant project reports
- Vinyl Chloride Manufacturing Plant Project Report (DPR) 2026
- Rice Bran Oil Processing Plant Project Report (DPR) 2026
- Neopentyl Glycol Manufacturing Plant Project Report (DPR) 2026
- Generic Injectables Manufacturing Plant Project Report (DPR) 2026
- Citric Acid Manufacturing Plant Project Report (DPR) 2026
- Castor Oil Processing Plant Project Report (DPR) 2026