
Market Overview
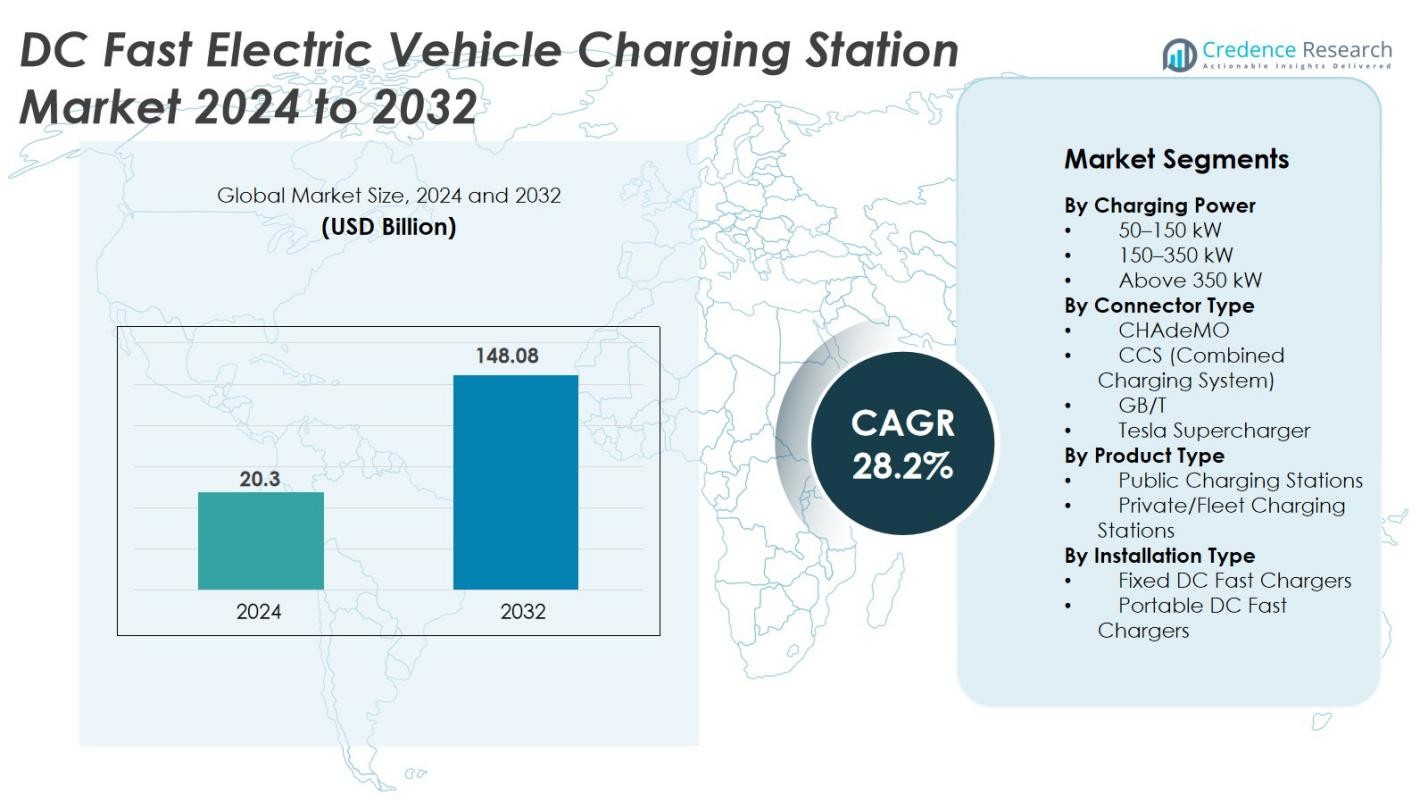
The DC Fast Electric Vehicle Charging Station market size was valued USD 20.3 billion in 2024 and is anticipated to reach USD 148.08 billion by 2032, at a CAGR of 28.2% during the forecast period.
| REPORT ATTRIBUTE | DETAILS |
|---|---|
| Historical Period | 2020-2023 |
| Base Year | 2024 |
| Forecast Period | 2025-2032 |
| DC Fast Electric Vehicle Charging Station Market Size 2024 | USD 20.3 Billion |
| DC Fast Electric Vehicle Charging Station Market, CAGR | 28.2% |
| DC Fast Electric Vehicle Charging Station Market Size 2032 | USD 148.08 Billion |
The DC Fast Electric Vehicle Charging Station market is led by major global providers including ABB, ChargePoint, Blink Charging, Delta Electronics, Eaton, EVBox, EVgo, Fortum, GreenWay Infrastructure, and E.ON. These companies expand networks using 150–350 kW chargers, liquid-cooled ultra-fast systems, and smart energy management platforms. Partnerships with automakers, utilities, and retail chains support rapid rollout across highways and urban hubs. Asia-Pacific remains the leading region with a 40% market share, driven by strong EV adoption and large-scale government infrastructure programs. Europe follows with 36%, supported by strict emission mandates and dense public charging deployments, while North America holds 32%, backed by federal funding and high commercial fleet electrification.
Market Insights
- The DC Fast Electric Vehicle Charging Station market was valued at USD 20.3 billion in 2024 and will reach USD 148.08 billion by 2032, registering a CAGR of 28.2%.
- Higher EV adoption, government subsidies, and long-range vehicle launches drive installations of 150–350 kW chargers, which lead the market with a 52% share due to fast charging speeds and wide compatibility.
- Key players such as ABB, ChargePoint, EVgo, Delta Electronics, Blink Charging, and Fortum expand networks using ultra-fast chargers, smart billing, and renewable integration to lower energy cost and improve uptime.
- High installation cost, grid upgrades, and slow permitting processes remain challenges, especially in emerging economies where power capacity limits large-scale deployments.
- Asia-Pacific holds 40% of the market, Europe has 36%, and North America follows with 32%, supported by public infrastructure funding, commercial fleet electrification, and strong charging network partnerships.
Market Segmentation Analysis
By Charging Power
The 150–350 kW fast chargers dominate this segment with 52% market share in 2024. These chargers balance installation cost and charging speed, enabling most EVs to reach 80% charge in under 30 minutes. Their deployment suits highways, public stations, and fleet hubs. Automakers support this range due to broad vehicle compatibility and efficient power usage. As EV adoption rises, utilities and charging networks continue upgrading sites to 150–350 kW units, driving higher throughput and reduced queue times compared to 50–150 kW systems.
- For instance, EVgo installed a 150-kW fast charger station capable of later upgrades to 350 kW at a high-traffic location in Fremont, California, supporting EV research platforms and utility impact studies.
By Connector Type:
The CCS (Combined Charging System) leads the market with a 48% share. CCS supports both AC and DC charging, offering flexibility for automakers and network operators. Most new electric cars in Europe and North America adopt CCS, making it the standard choice for public charging installations. Interoperability with multiple brands and growing regulations that promote common connector standards strengthen market growth. CHAdeMO and GB/T remain relevant in regional markets, while Tesla Supercharger adoption expands with greater public access agreements.
- For instance, Tesla's Supercharger network reached over 70,000 stalls globally, with an average daily throughput per stall not publicly detailed in official data but understood to be efficient for typical travel needs, and Tesla completed some of its highest quarterly openings with over 3,500 new stalls in one quarter alone, facilitating faster charging and broader accessibility.
By Product Type
Public charging stations account for the largest share at 63%. Governments, utilities, and private charging networks invest in public infrastructure to reduce range anxiety and support long-distance travel. Shopping centers, fuel stations, parking spaces, and highways host high-power stations that serve both passenger cars and commercial fleets. Incentive programs and public-private partnerships accelerate deployments, while higher footfall locations ensure rapid utilization of assets. Private and fleet charging stations grow steadily, but public sites remain the primary driver of market expansion due to widespread accessibility.
Key Growth Drivers
Rapid Expansion of Electric Vehicle Adoption
EV sales rise in every major region, and this directly boosts demand for fast charging. More consumers want shorter charging times and wider charging access. Governments support EV growth with subsidies, tax credits, and emission targets. Automakers expand production and launch long-range models that rely on high-power DC chargers for quick top-ups. Ride-hailing fleets and commercial logistics also shift toward electric mobility to reduce fuel cost and comply with clean-fleet targets. These users need reliable, high-power stations along highways and inside cities. As charging networks grow, faster stations improve travel confidence and remove range anxiety. This synergy between EV adoption and infrastructure keeps the DC fast charging market on a strong growth path.
- For instance, Volkswagen’s ID.4 electric SUV supports rapid charging at DC fast chargers with capacities up to 125 kW, enabling drivers to add about 320 km of range within 30 minutes.
Government Incentives and Infrastructure Funding
National and regional authorities provide funding to improve public charging access. Many countries support installation grants, reduced land fees, and power-grid upgrades. These policies help private networks expand faster and lower installation cost for operators. Highway corridors receive priority to support long-distance travel. Municipal bodies add stations in parking areas, commercial hubs, and fuel stations to increase visibility and access. Incentives also include carbon credit programs that reward clean-transport infrastructure. Combined support encourages partnerships among utilities, real estate groups, charging operators, and automakers.
- For instance, EVgo earned tradable credits for deploying over 300 DC fast charging stations under the Low Carbon Fuel Standard program in California, directly benefiting profitability and reinvestment in infrastructure.
Technological Advancements and High-Power Charging
High-power chargers reduce charging time and increase asset utilization for station owners. Liquid-cooled cables, smart power modules, and real-time energy management improve efficiency and safety. New chargers support 350 kW or higher output, allowing compatible EVs to charge in minutes. Smart chargers integrate load balancing and renewable energy, lowering power cost for operators. Software platforms manage billing, maintenance, and remote diagnostics, improving uptime and customer experience. Automakers add 800-volt vehicle platforms that draw more power from fast stations. These advancements support commercial fleets, long-range cars, and highway charging, pushing demand for fast charging far beyond older AC and low-power DC models.
Key Trends & Opportunities
Integration of Energy Storage and Renewable Power
Grid upgrades are expensive and slow, so many operators adopt on-site energy storage to support fast chargers. Battery banks handle peak loads and lower electricity cost during busy hours. Solar-powered charging stations grow in commercial and highway applications, creating cleaner and more efficient charging networks. Renewable charging attracts fleet owners, corporate users, and sustainability-focused consumers. This trend opens opportunities for energy companies, battery suppliers, and smart-grid solution providers to partner with charging operators. The result is a more reliable, flexible, and cost-efficient network that reduces dependence on traditional grid infrastructure.
- For instance, BYD has introduced a flash-charging platform capable of 1 MW charging power, with charging stations equipped with energy storage that can discharge 1 MW bursts while drawing a steadier fraction of that from the grid, enabling ultra-fast charging up to 400 kilometers range in 5 minutes.
Growth of Fleet and Commercial Fast Charging
Delivery fleets, electric buses, and shared mobility services shift to electric power to cut fuel and maintenance cost. These users require fast turnaround times and high uptime. Fleet depots install multiple high-power chargers linked with energy management systems. Companies also deploy charging hubs near airports, logistics parks, and ports. Subscription-based charging and charging-as-a-service give fleet managers predictable costs and improved planning. As commercial EV usage rises, fast charging for fleets becomes a major profitability driver for operators, unlocking strong business potential.
- For instance, Siemens has developed high-power chargers specifically targeting electric trucks and buses, with capacities ranging from 400 kW to over 1 MW, allowing for efficient top-up charging during short breaks.
Key Challenges
High Installation and Power Infrastructure Cost
Fast chargers need high-capacity grid connections, costly transformer upgrades, and smart metering systems. Hardware cost, civil work, and power distribution make installation expensive for new operators. Rural and remote locations need heavier investment with slower payback periods. Many small businesses face delays due to land approvals, permits, and utility coordination. These challenges limit station density and slow expansion in price-sensitive markets. Without financial support and grid modernization, scaling fast charging networks becomes difficult.
Grid Stability and Energy Demand Management
High-power charging creates heavy demand spikes when many vehicles charge at once. Older grids cannot handle these loads without risk of overload or voltage drop. Operators must install advanced load balancing and real-time monitoring systems to avoid power issues. Utility delays and long connection timelines slow deployments. As the number of fast chargers increases, energy planners must strengthen local grids and integrate renewable sources and storage. Without strategic planning, grid stress becomes a long-term barrier for widespread fast charging adoption.
Regional Analysis
North America
North America holds 32% market share, supported by rising EV adoption, large highway networks, and federal funding for nationwide charging corridors. The United States leads installations through tax incentives, infrastructure grants, and partnerships among utilities, automakers, and charging networks. Canada accelerates deployment in urban hubs and cold-weather regions where fast charging reduces range loss during winter. Leading companies expand 150–350 kW stations across retail parking lots, fuel stations, and logistics centers. Private fleets adopt fast charging to lower carbon footprint and fuel expenses. The region focuses on interoperability, open-access payment systems, and renewable-powered chargers.
Europe
Europe captures 36% market share, driven by strict emission regulations and strong EV sales across Germany, the UK, France, and the Nordic countries. The European Union mandates dense fast-charging coverage along major travel corridors, creating consistent growth for public networks. Automakers support CCS standardization, enabling seamless compatibility across brands. Energy companies build high-power corridors enabling long-distance travel and heavy-duty fleet charging. Countries invest in smart-grid integration and renewable energy to reduce electricity cost and carbon footprint. Urban fast-charging hubs expand near residential zones where home charging remains limited, supporting consistent charger utilization.
Asia-Pacific
Asia-Pacific leads the market with 40% share, backed by massive EV fleets in China, Japan, India, and South Korea. China builds one of the world’s largest fast-charging networks with government subsidies, public-private partnerships, and high-density urban rollout. Japan advances CHAdeMO-supported infrastructure, while South Korea invests in ultra-fast stations for next-gen EVs. India expands stations along highways and commercial hubs to support two-wheelers, passenger cars, and electric buses. Strong manufacturing capabilities reduce hardware costs, helping operators scale installations. High demand from logistics fleets and ride-hailing services drives adoption of 150–350 kW chargers.
Latin America
Latin America holds around 6% market share, with adoption rising across Brazil, Chile, and Mexico. Government sustainability targets encourage electrified transport, especially buses and commercial fleets. Public utilities and energy companies lead infrastructure development in major cities and tourist corridors. Charging operators pilot ultra-fast stations along highways connecting large metro centers. Partnerships with global EV manufacturers help lower equipment costs and improve network reliability. Although deployment remains in early stages, fast charging grows steadily as more affordable EVs reach the market and urban congestion policies promote green mobility.
Middle East & Africa
Middle East & Africa account for 4% market share, supported by smart city development and renewable-energy investments. The UAE and Saudi Arabia build fast-charging corridors to support premium EV demand and tourism routes. South Africa advances charging rollout in commercial hubs and fuel stations. Solar-powered chargers gain attention in areas with unstable grids. Regional governments promote sustainability through incentives and public charging tenders. While adoption remains modest, high-end consumer demand and green mobility initiatives support gradual expansion of fast-charging infrastructure across leading cities.
Market Segmentations:
By Charging Power
- 50–150 kW
- 150–350 kW
- Above 350 kW
By Connector Type
- CHAdeMO
- CCS (Combined Charging System)
- GB/T
- Tesla Supercharger
By Product Type
- Public Charging Stations
- Private/Fleet Charging Stations
By Installation Type
- Fixed DC Fast Chargers
- Portable DC Fast Chargers
By Geography
- North America
- U.S.
- Canada
- Mexico
- Europe
- Germany
- France
- U.K.
- Italy
- Spain
- Rest of Europe
- Asia Pacific
- China
- Japan
- India
- South Korea
- South-east Asia
- Rest of Asia Pacific
- Latin America
- Brazil
- Argentina
- Rest of Latin America
- Middle East & Africa
- GCC Countries
- South Africa
- Rest of the Middle East and Africa
Competitive Landscape
The DC fast electric vehicle charging station market features strong competition among global charging networks, utility companies, automotive manufacturers, and power equipment suppliers. Major players such as ABB, ChargePoint, Delta Electronics, EVBox, Blink Charging, EVgo, Fortum, GreenWay Infrastructure, Eaton, and E. ON expand networks through public-private partnerships and high-power corridor deployments. Companies focus on 150–350 kW and ultra-fast 350 kW+ chargers to support long-range EVs and commercial fleets. Many providers integrate smart billing, remote diagnostics, renewable energy, and energy storage to reduce power cost and improve uptime. Automakers also invest in charging networks to secure customer loyalty and ensure nationwide coverage. Competitive strategies include charger reliability, uptime guarantees, user-friendly mobile apps, and fleet-management platforms. Global brands scale rapidly, while regional companies strengthen presence in urban hubs and highway networks. As battery technology improves, players aim to offer faster charging, unified payment systems, and interoperability, shaping an intensely competitive and high-growth market.
Key Player Analysis
- Fortum
- EVgo
- GreenWay Infrastructure
- ABB
- ChargePoint
- Blink Charging
- Eaton
- Delta Electronics
- EVBox
- EON
Recent Developments
- In August 2025, ChargePoint partnered with Eaton to launch a next-generation ultrafast DC and V2X charging platform, offering a compact design and reduced infrastructure costs.
- In October 2024, ABB E-Mobility commissioned its first A400 fast chargers at two DACHSER logistics sites in Germany. The A400, designed for logistics operations, delivers up to 400 kW and enhances ABB’s market presence and reliability in the DC fast-charging sector.
- In October 2024, Blink Charging Co. received nearly USD 2 million in grant funding from the Illinois Environmental Protection Department to expand EV charging infrastructure across Illinois. The funding supports the installation of commercial-grade DC fast chargers and AC Level 2 stations in public locations.
- In September 2024, Siemens announced the carve-out of its EV charging division, including Heliox, to focus more strategically on high-power DC fast-charging technology.
Report Coverage
The research report offers an in-depth analysis based on Charging Power, Connector Type, Product Type, Installation Type and Geography. It details leading market players, providing an overview of their business, product offerings, investments, revenue streams, and key applications. Additionally, the report includes insights into the competitive environment, SWOT analysis, current market trends, as well as the primary drivers and constraints. Furthermore, it discusses various factors that have driven market expansion in recent years. The report also explores market dynamics, regulatory scenarios, and technological advancements that are shaping the industry. It assesses the impact of external factors and global economic changes on market growth. Lastly, it provides strategic recommendations for new entrants and established companies to navigate the complexities of the market.
Future Outlook
- Fast charging stations will expand along highways, commercial hubs, and urban centers to support long-distance and daily travel.
- Ultra-fast chargers above 350 kW will gain traction as next-generation EVs adopt 800-volt platforms.
- Charging networks will integrate renewable power and battery storage to reduce electricity cost and grid dependency.
- Fleet electrification in logistics, ride-hailing, and public transport will drive large-scale depot installations.
- Software-based energy management, remote diagnostics, and predictive maintenance will improve charger uptime.
- Interoperability and unified payment systems will allow seamless cross-network charging.
- Oil and gas companies will convert fuel stations into hybrid charging hubs.
- Smart cities will adopt public fast charging to support clean mobility goals and reduce vehicle emissions.
- Automakers will co-invest in infrastructure to increase brand loyalty and improve user experience.
- Emerging markets will accelerate deployment as EV prices fall and policy incentives increase.

Request a Free Sample
Fill in your details and we'll send you a free sample report.
- Sample data tables & charts
- Research methodology
Need a Custom Version of This Report?
Tailor the scope, geography, or segments to your exact requirements.
- Custom geography or segment scope
- Direct access to our analyst team
Frequently Asked Questions
What is the current market size for DC Fast Electric Vehicle Charging Station market, and what is its projected size in 2032?
At what Compound Annual Growth Rate is the DC Fast Electric Vehicle Charging Station market projected to grow between 2025 and 2032?
Which DC Fast Electric Vehicle Charging Station market segment held the largest share in 2024?
What are the primary factors fueling the growth of the DC Fast Electric Vehicle Charging Station market?
Who are the leading companies in the DC Fast Electric Vehicle Charging Station market?
Which region commanded the largest share of the DC Fast Electric Vehicle Charging Station market in 2024?
Table of Content
Chapter 1 Market Segmentation
- 1.1 Segmentation Framework
- 1.1.1 Product and Service Classification
- 1.1.2 Application and End-Use Classification
- 1.1.3 Technology and Solution Classification
- 1.1.4 Customer and Distribution Channel Classification
- 1.1.5 Geographic Segmentation
- 1.1.6 Market Segment Definitions and Boundaries
Chapter 2 Introduction
- 2.1 Report Objectives and Scope
- 2.2 Product Definition and Industry Terminology
- 2.3 Market Inclusions and Exclusions
- 2.4 Research Process
- 2.4.1 Primary Research and Expert Interviews
- 2.4.2 Secondary Research and Source Review
- 2.4.3 Top-Down and Bottom-Up Estimation
- 2.4.4 Data Triangulation and Verification
- 2.5 Market Size Measurement Basis
- 2.5.1 2024: USD 20.3 Billion → 2032: USD 148.08 Billion
- 2.6 Historical and Forecast Reference Periods
- 2.6.1 Base Year: 2024
- 2.6.2 Forecast Period: 2024-2032
- 2.7 Research Assumptions and Limitations
Chapter 3 Executive Summary
- 3.1 Market Snapshot and Key Findings
- 3.2 Base-Year Market Size, 2024
- 3.3 Forecast Market Size, 2032
- 3.4 Revenue and Volume Growth Outlook
- 3.5 Key Demand and Supply Indicators
- 3.6 Leading Market Segments
- 3.7 Fastest-Growing Market Opportunities
- 3.8 Regional Performance Highlights
- 3.9 Technology and Industry Transformation
- 3.10 Competitive Landscape Summary
- 3.11 Analyst View and Strategic Implications
Chapter 4 Global DC Fast Electric Vehicle Charging Station Market Market Trends and Developments
- 4.1 Historical Industry Development
- 4.2 Recent Market Trends and Developments
- 4.3 Demand and Customer Behavior Trends
- 4.4 Technology and Product Innovation
- 4.5 Artificial Intelligence, Automation and Digitalization
- 4.6 Local Manufacturing and Supply Chain Realignment
- 4.7 Industry Partnerships, Mergers and Acquisitions
- 4.8 Sustainability and Circular Economy Developments
- 4.9 Government and Private Sector Investment Trends
- 4.10 Emerging Business Models and Commercialization
- 4.11 Industry Developments and Announcements
Chapter 5 Global DC Fast Electric Vehicle Charging Station Market Market Production, Supply and Demand Analysis
- 5.1 Demand Trend and Consumption Analysis
- 5.2 Demand Forecast, 2024-2032
- 5.3 Production and Output Trend
- 5.4 Production and Output Forecast, 2024-2032
- 5.5 Installed Capacity and Capacity Utilization
- 5.6 Company-Wise Production Plants and Statistics
- 5.6.1 Installed Production Capacity
- 5.6.2 Actual Production
- 5.6.3 Planned Capacity and Expansion Targets
- 5.7 Supply Chain Structure and Procurement Trends
- 5.8 Supply-Demand Gap and Bottlenecks
- 5.9 Import Dependence and Sourcing Structure
- 5.10 Contract Manufacturing and Outsourcing
- 5.11 Regional Supply and Demand Concentration
Chapter 6 Global DC Fast Electric Vehicle Charging Station Market Market Pricing Analysis
- 6.1 Pricing Structure and Measurement
- 6.2 Historical Pricing Trends
- 6.3 Pricing Outlook, 2024-2032
- 6.4 Average Selling Price and Unit Economics
- 6.5 Pricing by Product and Market Segment
- 6.6 Geographic Pricing Differences
- 6.7 Key Input, Energy, Labor and Logistics Costs
- 6.8 Contract Pricing and Purchasing Models
- 6.9 Pricing Sensitivity and Competitive Positioning
- 6.10 Price, Margin and Profitability Implications
Chapter 7 Global DC Fast Electric Vehicle Charging Station Market Market Dynamics
- 7.1 Market Growth Drivers
- 7.1.1 Demand-Side Drivers
- 7.1.2 Technology and Innovation Drivers
- 7.1.3 Infrastructure and Investment Drivers
- 7.1.4 Regulatory and Policy Drivers
- 7.2 Market Restraints
- 7.2.1 Cost and Affordability Constraints
- 7.2.2 Technology and Adoption Barriers
- 7.2.3 Supply Chain and Operational Constraints
- 7.3 Market Challenges
- 7.3.1 Competitive Pressure and Margin Erosion
- 7.3.2 Skills, Infrastructure and Implementation Gaps
- 7.4 Emerging Market Opportunities
- 7.5 Market Dynamics Impact and Time-Horizon Assessment
Chapter 8 Global DC Fast Electric Vehicle Charging Station Market Value Chain Analysis
- 8.1 Industry Value Chain Overview
- 8.2 Upstream Suppliers and Critical Inputs
- 8.3 Technology and Component Providers
- 8.4 Manufacturing or Service Delivery
- 8.5 Distribution, Channel Partners and Integrators
- 8.6 Downstream Applications and End Users
- 8.7 Value Addition and Profit Pools
- 8.8 Vertical Integration and Outsourcing
- 8.9 Supplier Concentration and Risk
- 8.10 Supply Chain Localization and Resilience
Chapter 9 Global DC Fast Electric Vehicle Charging Station Market Market Regulations and Policies
- 9.1 Relevant Laws, Standards and Compliance Frameworks
- 9.2 Product, Service, Safety and Quality Requirements
- 9.3 Government Policies, Incentives and Subsidies
- 9.4 Imports, Exports and Trade Barriers
- 9.5 Public Procurement and Local Content Requirements
- 9.6 Environmental and Sustainability Compliance
- 9.7 Upcoming Policy Changes and Market Implications
Chapter 10 Global DC Fast Electric Vehicle Charging Station Market Market Hotspots and Opportunities
- 10.1 Market Opportunity Mapping and Growth Hotspots
- 10.2 High-Growth Applications and Customer Groups
- 10.3 Underserved Markets and White-Space Opportunities
- 10.4 Emerging Technology and Product Opportunities
- 10.5 New Capacity and Investment Hotspots
- 10.6 Market Entry and Expansion Opportunities
- 10.7 Distribution and Partnership Opportunities
- 10.8 Near-Term and Long-Term Commercial Potential
- 10.9 Opportunity Attractiveness and Execution Risks
Chapter 11 Global DC Fast Electric Vehicle Charging Station Market Market Outlook, 2024-2032
- 11.1 Market Size and Analysis
- 11.1.1 Revenue (Market Measurement: 2024: USD 20.3 Billion → 2032: USD 148.08 Billion)
- 11.1.2 Market Volume and Quantity Sold
- 11.1.3 Historical Market Size
- 11.1.4 Base-Year Market Size, 2024
- 11.2 Market Forecast, 2024-2032
- 11.2.1 Revenue Forecast to 2032
- 11.2.2 Volume Forecast to 2032
- 11.2.3 CAGR and Year-on-Year Growth
- 11.2.4 Incremental Revenue Opportunity
- 11.3 Forecast Assumptions and Scenario Analysis
- 11.3.1 Base-Case Forecast
- 11.3.2 Optimistic and Conservative Scenarios
- 11.3.3 Technology, Pricing and Policy Sensitivities
- 11.4 Market Attractiveness and Growth Outlook
Chapter 12 Global DC Fast Electric Vehicle Charging Station Market Market Segmentation and Outlook
- 12.1 Segmentation Summary and Market Shares, 2024
- 12.2 Largest and Fastest-Growing Segments
- 12.3 Segment Growth Comparison
- 12.4 Segment Attractiveness and Priority Matrix
Chapter 13 Global DC Fast Electric Vehicle Charging Station Market Geographic Market Outlook, 2024-2032
- 13.1 Regional Market Size and Share, 2024
- 13.2 Regional Market Forecast, 2024-2032
- 13.3 Regional Pricing, Production and Demand Differences
- 13.4 North America
- 13.4.1 United States
- 13.4.2 Canada
- 13.4.3 Mexico
- 13.5 Europe
- 13.5.1 Germany
- 13.5.2 France
- 13.5.3 Italy
- 13.5.4 United Kingdom
- 13.5.5 Spain
- 13.5.6 Poland
- 13.5.7 Russia
- 13.5.8 Netherlands
- 13.5.9 Belgium
- 13.5.10 Sweden
- 13.5.11 Denmark
- 13.5.12 Norway
- 13.5.13 Rest of Europe
- 13.6 Asia Pacific
- 13.6.1 China
- 13.6.2 India
- 13.6.3 Japan
- 13.6.4 South Korea
- 13.6.5 Thailand
- 13.6.6 Indonesia
- 13.6.7 Vietnam
- 13.6.8 Malaysia
- 13.6.9 Australia
- 13.6.10 Rest of Asia Pacific
- 13.7 Latin America
- 13.7.1 Brazil
- 13.7.2 Argentina
- 13.7.3 Colombia
- 13.7.4 Chile
- 13.7.5 Rest of Latin America
- 13.8 Middle East
- 13.8.1 Saudi Arabia
- 13.8.2 United Arab Emirates
- 13.8.3 Turkey
- 13.8.4 Israel
- 13.8.5 Iran
- 13.8.6 Rest of the Middle East
- 13.9 Africa
- 13.9.1 South Africa
- 13.9.2 Egypt
- 13.9.3 Nigeria
- 13.9.4 Morocco
- 13.9.5 Rest of Africa
- 13.10 Regional Investment, Policy and Supply Chain Differences
- 13.11 Regional Competitive Landscape
- 13.12 Geographic Growth Hotspots
Chapter 14 Global DC Fast Electric Vehicle Charging Station Market Technology, Innovation and Sustainability Outlook
- 14.1 Technology Landscape and Maturity
- 14.2 Product, Process and Service Innovation
- 14.3 AI, Automation and Digital Tools in the Industry
- 14.4 Technology Adoption and Performance Benchmarking
- 14.5 Innovation Pipeline and R&D Investment
- 14.6 Patent and Intellectual Property Trends
- 14.7 Energy Efficiency and Resource Management
- 14.8 Sustainability, Recycling and Circularity
- 14.9 Technology Roadmap, 2024-2032
- 14.10 Risks of Obsolescence and Technology Substitution
Chapter 15 Global DC Fast Electric Vehicle Charging Station Market Market Key Strategic Imperatives
- 15.1 Growth and Market Entry Priorities
- 15.2 High-Return Products and Segments
- 15.3 Pricing, Profitability and Cost Optimization
- 15.4 Technology Investment and Product Differentiation
- 15.5 Supply Chain Localization and Resilience
- 15.6 Distribution and Customer Acquisition
- 15.7 Partnership, Acquisition and Capacity Strategy
- 15.8 Regional Expansion Priorities
- 15.9 Short-, Medium- and Long-Term Actions
Chapter 16 Competition Outlook
- 16.1 Industry Competition Characteristics
- 16.2 Market Structure and Concentration
- 16.3 Market Share and Competitive Positioning, 2024
- 16.4 Company-Wise Revenue and Product Benchmarking
- 16.5 Production and Service Capacity Benchmarking
- 16.6 Technology, Pricing and Differentiation
- 16.7 Regional Footprint and Distribution Strength
- 16.8 Mergers, Acquisitions and Strategic Alliances
- 16.9 New Entrants and Competitive Threats
- 16.10 Porter's Five Forces and Industry Attractiveness
- 16.11 Competitive Outlook, 2024-2032
Chapter 17 Company Profiles
- 17.1 Company Coverage and Selection Criteria
- 17.2 Leading Market Participants – Standard Profile Structure
- 17.2.1 Business Description
- 17.2.2 Company Ownership and Geographic Presence
- 17.2.3 Product and Service Portfolio
- 17.2.4 Manufacturing and Operating Footprint
- 17.2.5 Production Capacity and Expansion Plans
- 17.2.6 Financial Performance and Investment
- 17.2.7 Market Share and Competitive Position
- 17.2.8 Technology and Innovation Capabilities
- 17.2.9 Strategic Alliances or Partnerships
- 17.2.10 Recent Developments
- 17.2.11 Growth Strategy and Outlook
- 17.3 Other Relevant Market Participants
Note: Every listed company is profiled on the structure shown under the first company. The company list is preliminary and may change based on research findings, market developments, data availability and client requirements.
Chapter 18 Disclaimer
- 18.1 Research and Forecast Disclaimer
- 18.2 Data Source and Estimation Limitations
Note: The depth of individual sections depends on data availability for this market. Volume, capacity, trade and other unit-based metrics are included where applicable.

