Home » Food & Beverage » Ginger Beer Market

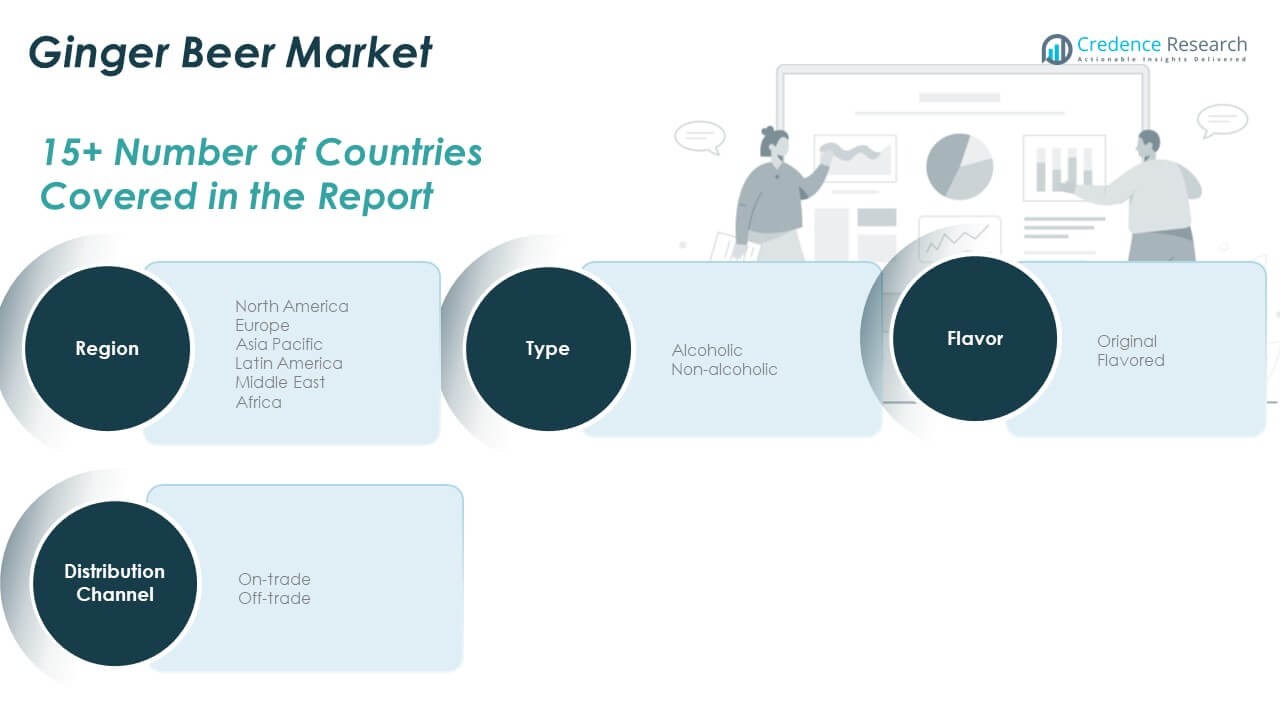
Ginger Beer Market by Type (Alcoholic Beverage, Non-Alcoholic Beverage) by Distribution Channel (Household, HoReCa (Hotels, Restaurants and Cafe), Catering)- Growth, Future Prospects And Competitive Analysis, 2016 – 2028

Price: $4699

Published: | Report ID: 6639 | Report Format : PDF

Ginger Beer Market Analysis

Ginger beer is a drink that’s widely accepted worldwide due to its carbonated properties. It’s a well-enjoyed beverage served in pubs, clubs, cafes, and restaurants, making it pretty demanding, especially in North and South America. Ginger beer is made by fermenting prepared ginger spice and adding yeast and sugar. The sugar makes it sweetened; sometimes, the extra syrup is added for more taste.

Often, ginger beer is mistaken for ginger ale. However, both of these drinks are different from each other. They’re prepared differently and also have contrasting tastes. Ginger ale is carbonated water that tastes like ginger. At the same time, ginger beer is fermented adequately as it’s a beer.

There’s organic and inorganic ginger beer as well. The former is fresh and is prepared through natural ingredients, such as raw ginger and sugar. The latter, however, has artificial colorings and chemicals added to it, making it highly preserved.

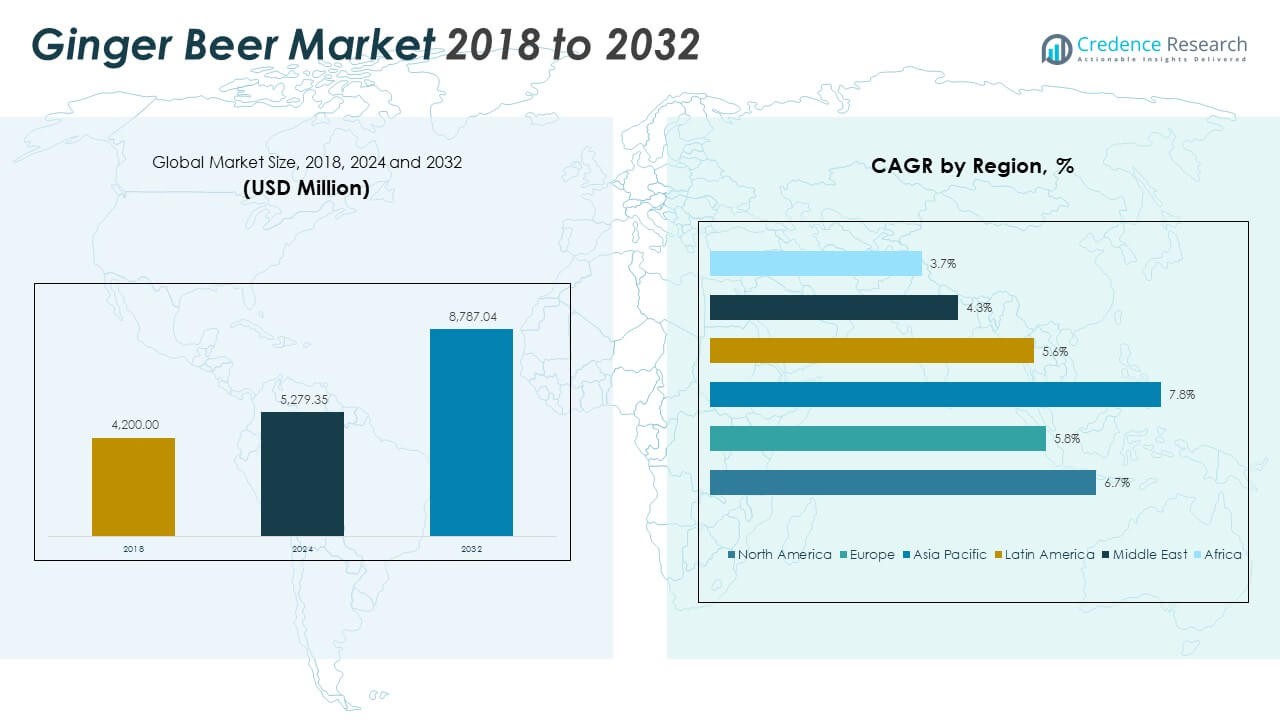
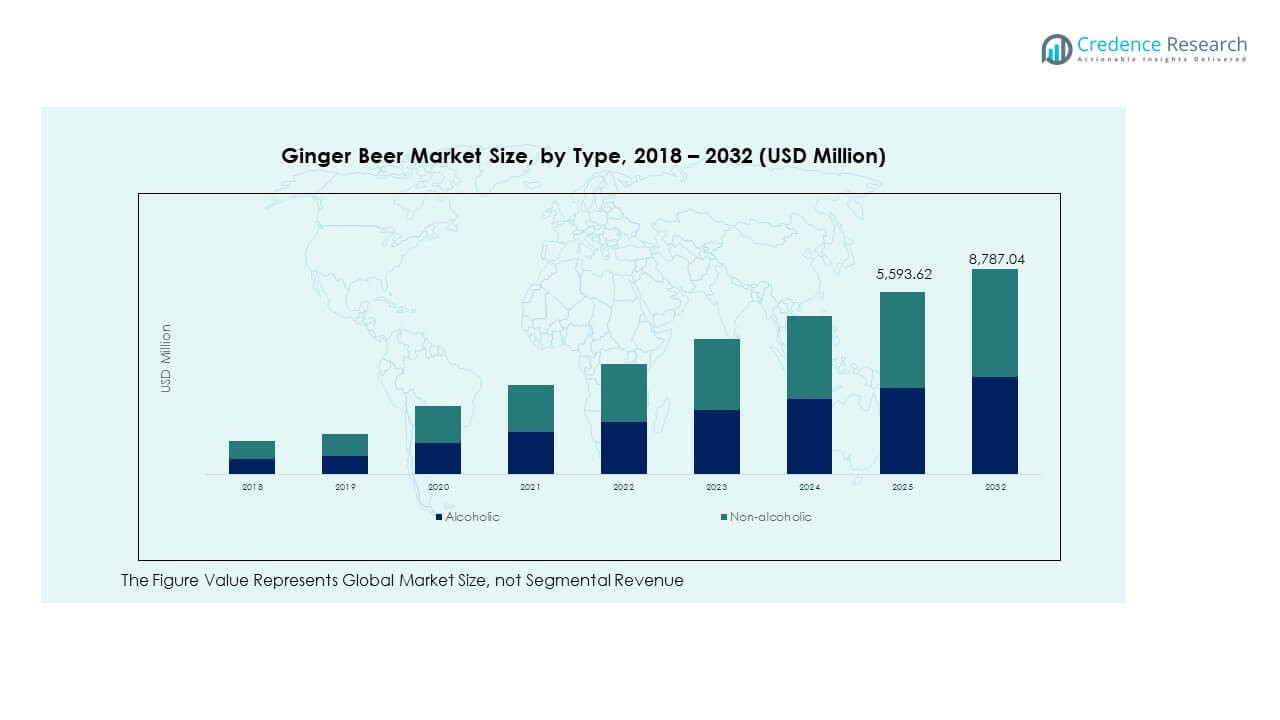
The Global Ginger Beer market is expected to witness a CAGR of 9.58% during the forecast period. The revenue generated by the global Ginger Beer market in 2021 was over USD 9,057.00 million and is expected to generate revenue worth USD 18,036.40 million in 2028. Therefore, the incremental growth opportunity offered by the global Ginger Beer is estimated to be USD 106.75 billion between 2022 and 2028.

Interesting Facts about Ginger Beer Industry

  • Ginger Beer was First Made in the UK
  • Ginger Beer has Never Contained Actual Beer
  • Ginger Beer Believed to Be Good Promoter of Mental Health
  • Natural Fermentation produces ginger Beer
  • Ginger Beer Production reached around 900 million liters in 2021
Design Element 2

Access crucial information at unmatched prices!

Request your free sample report today & start making informed decisions powered by Credence Research!

Download Free Sample

CTA Design Element 3

Health Benefits of Ginger Beer

Ginger beer doesn’t always have to be alcoholic, and non-alcoholic ones have quite the health benefits for the human body. That’s primarily because of an active ingredient in ginger beer that helps contribute to the benefits.

The ingredient used in ginger beer is gingerol, a highly enriched mineral oil, just like magnesium, copper, potassium, and vitamin B6. Gingerol helps with plenty of medical conditions, such as relieving nausea. It also aids in digestion, helping one feel light and at ease. Gingerol is said to help reduce the risk of cancer too.

There’s a reason why ginger beer is always in demand; it’s because of how much it benefits the human body. Gingerol is known to act as the best anti-inflammatory agent, helping significantly with swelling. Another benefit of gingerol is that it’s an anti-bacterial, killing any active bacteria in your system when you consume it.

HoReCa (Hotels, Restaurants, and Cafe) to Dominate Sales Channel of Ginger Beer

Household, HoReCa (Hotels, Restaurants, and Cafe), and Catering are major sales channels of ginger beer. However, the problem wasn’t with ginger beer’s demand but its supply. When the Global Pandemic announced itself, many businesses took a hit, halting production and shutting down factories. As a result, no active factories could produce ginger beer, which slowed its market.

Apart from that, restaurants and pubs that served ginger beer were also ordered to shut down due to the lockdown. There was no way for ginger beer to be sold anywhere in the market. Companies who manufactured it saw severe dips in numbers, with the product life cycle drawing close to its end.

Shape Your Report to Specific Countries or Regions & Enjoy 30% Off!

Speedy Recovery from Post COVID 19 Decline

Luckily for ginger beer manufacturers, the COVID-19 situation improved, with governments worldwide lifting the lockdown. Restaurants have opened up again, and so have factories. Since ginger beer’s an already pretty demanded product, brands wouldn’t have to re-market it.

The supply is slowly coming back up, with ginger beers back in production. Ginger beer originated in Europe, but it’s now more popular in the North American region. It isn’t just known for its great taste and health benefits that significantly impact the human body.

MAVIG, AADCO Medical, Bundaberg Brewed Drinks, C-B Beverages Corp., Crabbie’s International, Epimed, Fever Tree, Gosling Rum Ltd., Maine Root Handcrafted Beverages (MRHB), Q- Mixers, Reed’s Inc., Scanflex Medical, Spindrift, Wardray Premise, and Wolf X-Ray Corporation are leading manufacturers of ginger beer.

1.Preface

1.1.Report Description
1.1.1.Purpose of the Report
1.1.2.Target Audience
1.1.3.USP and Key Offerings
1.2.Research Scope
1.3.Research Methodology
1.3.1.Phase I – Secondary Research
1.3.2.Phase II – Primary Research
1.3.3.Phase III – Expert Panel Review
1.3.4.Approach Adopted
1.3.4.1.Top-Down Approach
1.3.4.2.Bottom-Up Approach
1.3.5.Assumptions
1.4.Market Segmentation

2.Executive Summary
2.1.Market Snapshot: Global Ginger Beer Market

3.Market Dynamics & Factors Analysis
3.1.Introduction
3.1.1. Global Ginger Beer Market Value, 2016-2028, (US$ Bn)
3.2.Market Dynamics
3.2.1.Key Growth Trends
3.2.2.Major Industry Challenges
3.2.3.Key Growth Pockets
3.3.Attractive Investment Proposition,2021
3.3.1.Type
3.3.2.Sales Channel
3.3.3.Geography
3.4.Porter’s Five Forces Analysis
3.4.1.Threat of New Entrants
3.4.2.Bargaining Power of Buyers/Consumers
3.4.3.Bargaining Power of Suppliers
3.4.4.Threat of Substitute Types
3.4.5.Intensity of Competitive Rivalry
3.5.Value Chain Analysis

4.Market Positioning of Key Players, 2021
4.1.Company market share of key players, 2021
4.2.Top 6 Players
4.3.Top 3 Players
4.4.Major Strategies Adopted by Key Players

5.COVID 19 Impact Analysis
5.1.Global Ginger Beer Market Pre Vs Post COVID 19, 2019 – 2028
5.2.Impact on Import & Export
5.3.Impact on Demand & Supply

6.North America
6.1.North America Ginger Beer Market, by Country, 2016-2028(US$ Bn)
6.1.1.U.S.
6.1.2.Canada
6.1.3.Mexico
6.2.North America Ginger Beer Market, by Type, 2016-2028(US$ Bn)
6.2.1.Overview
6.2.2.Alcoholic Beverage
6.2.3.Non-Alcoholic Beverage
6.3.North America Ginger Beer Market, by Sales Channel, 2016-2028(US$ Bn)
6.3.1.Overview
6.3.2.Household
6.3.3.HoReCa (Hotels, Restaurants and Cafe)
6.3.4.Catering
6.3.5.Others

7.Europe
7.1.Europe Ginger Beer Market, by Country, 2016-2028(US$ Bn)
7.1.1.UK
7.1.2.France
7.1.3.Germany
7.1.4.Italy
7.1.5.Russia
7.1.6.Spain
7.1.7.Belgium
7.1.8.Netherland
7.1.9.Austria
7.1.10.Sweden
7.1.11.Poland
7.1.12.Denmark
7.1.13.Switzerland
7.1.14.Rest of Europe
7.2.Europe Ginger Beer Market, by Type, 2016-2028(US$ Bn)
7.2.1.Overview
7.2.2.Alcoholic Beverage
7.2.3.Non-Alcoholic Beverage
7.3.urope Ginger Beer Market, by Sales Channel, 2016-2028(US$ Bn)
7.3.1.Overview
7.3.2.Household
7.3.3.HoReCa (Hotels, Restaurants and Cafe)
7.3.4.Catering
7.3.5.Others

8.Asia Pacific
8.1.Asia Pacific Ginger Beer Market, by Country, 2016-2028(US$ Bn)
8.1.1.China
8.1.2.Japan
8.1.3.South Korea
8.1.4.India
8.1.5.Australia
8.1.6.New Zealand
8.1.7.Taiwan
8.1.8.Southeast Asia
8.1.9.Central Asia
8.1.10.Rest of Asia Pacific
8.2.Asia Pacific Ginger Beer Market, by Type, 2016-2028(US$ Bn)
8.2.1.Overview
8.2.2.Alcoholic Beverage
8.2.3.Non-Alcoholic Beverage
8.3.Asia Pacific Ginger Beer Market, by Sales Channel, 2016-2028(US$ Bn)
8.3.1.Overview
8.3.2.Household
8.3.3.HoReCa (Hotels, Restaurants and Cafe)
8.3.4.Catering
8.3.5.Others
9.Latin America
9.1.Latin America Ginger Beer Market, by Country, 2016-2028(US$ Bn)
9.1.1.Brazil
9.1.2.Argentina
9.1.3.Peru
9.1.4.Chile
9.1.5.Colombia
9.1.6.Rest of Latin America
9.2.Latin America Ginger Beer Market, by Type, 2016-2028(US$ Bn)
9.2.1.Overview
9.2.2.Alcoholic Beverage
9.2.3.Non-Alcoholic Beverage
9.3.Latin America Ginger Beer Market, by Sales Channel, 2016-2028(US$ Bn)
9.3.1.Overview
9.3.2.Household
9.3.3.HoReCa (Hotels, Restaurants and Cafe)
9.3.4.Catering
9.3.5.Others

10.Middle East
10.1.Middle East Ginger Beer Market, by Country, 2016-2028(US$ Bn)
10.1.1.UAE
10.1.2.KSA
10.1.3.Israel
10.1.4.Turkey
10.1.5.Iran
10.1.6.Rest of Middle East
10.2.Middle East Ginger Beer Market, by Type, 2016-2028(US$ Bn)
10.2.1.Overview
10.2.2.Alcoholic Beverage
10.2.3.Non-Alcoholic Beverage
10.3.Middle East Ginger Beer Market, by Sales Channel, 2016-2028(US$ Bn)
10.3.1.Overview
10.3.2.Household
10.3.3.HoReCa (Hotels, Restaurants and Cafe)
10.3.4.Catering
10.3.5.Others

11.Africa
11.1.Africa Ginger Beer Market, by Country, 2016-2028(US$ Bn)
11.1.1.South Africa
11.1.2.Egypt
11.1.3.Nigeria
11.1.4.Rest of Africa
11.2.Africa Ginger Beer Market, by Type, 2016-2028(US$ Bn)
11.2.1.Overview
11.2.2.Alcoholic Beverage
11.2.3.Non-Alcoholic Beverage
11.3.Africa Ginger Beer Market, by Sales Channel, 2016-2028(US$ Bn)
11.3.1.Overview
11.3.2.Household
11.3.3.HoReCa (Hotels, Restaurants and Cafe)
11.3.4.Catering
11.3.5.Others

12.Global
12.1.Global Ginger Beer Market, by Type, 2016-2028(US$ Bn)
12.1.1.Overview
12.1.2.Alcoholic Beverage
12.1.3.Non-Alcoholic Beverage
12.2.Global Ginger Beer Market, by Sales Channel, 2016-2028(US$ Bn)
12.2.1.Overview
12.2.2.Household
12.2.3.HoReCa (Hotels, Restaurants and Cafe)
12.2.4.Catering
12.2.5.Others

13.Company Profiles
13.1.MAVIG
13.2.AADCO Medical
13.3.Bundaberg Brewed Drinks
13.4.C-B Beverages Corp.
13.5.Crabbie’s International
13.6.Epimed
13.7.Fever Tree
13.8.Gosling Rum Ltd.
13.9.Maine Root Handcrafted Beverages (MRHB)
13.10.Q- Mixers
13.11.Reed’s Inc.
13.12.Scanflex Medical
13.13.Spindrift
13.14.Wardray Premise
13.15.Wolf X-Ray Corporation
13.16.Others

List of Figures

FIG. 1Global Ginger Beer Market: Research Methodology
FIG. 2Market Size Estimation – Top Down & Bottom up Approach
FIG. 3Global Ginger Beer Market Segmentation
FIG. 4Global Ginger Beer Market, by Type, 2019 (US$ Bn)
FIG. 5Global Ginger Beer Market, by Sales Channel, 2021 (US$ Bn)
FIG. 6Global Ginger Beer Market, by Geography, 2021 (US$ Bn)
FIG. 7Attractive Investment Proposition, by Geography, 2021
FIG. 8Global Market Positioning of Key Ginger Beer Market Manufacturers, 2019
FIG. 9Global Ginger Beer Market Value Contribution, By Type, 2021 & 2028 (Value %)
FIG. 10Global Ginger Beer Market, by Alcoholic Beverage, Value, 2016-2028 (US$ Bn)
FIG. 11Global Ginger Beer Market, by Non-Alcoholic Beverage, Value, 2016-2028 (US$ Bn)
FIG. 12Global Ginger Beer Market Value Contribution, By Sales Channel, 2021 & 2028 (Value %)
FIG. 13Global Ginger Beer Market, by Household, Value, 2016-2028 (US$ Bn)
FIG. 14Global Ginger Beer Market, by HoReCa (Hotels, Restaurants and Cafe), Value, 2016-2028 (US$ Bn)
FIG. 15Global Ginger Beer Market, by Catering, Value, 2016-2028 (US$ Bn)
FIG. 16Global Ginger Beer Market, by Others, Value, 2016-2028 (US$ Bn)
FIG. 17U.S. Ginger Beer Market, 2016-2028 (US$ Bn)
FIG. 18Rest of North America Ginger Beer Market, 2016-2028 (US$ Bn)
FIG. 19U.K. Ginger Beer Market, 2016-2028 (US$ Bn)
FIG. 20Germany Ginger Beer Market, 2016-2028 (US$ Bn)
FIG. 21France Ginger Beer Market, 2016-2028 (US$ Bn)
FIG. 22Italy Ginger Beer Market, 2016-2028 (US$ Bn)
FIG. 23Spain Ginger Beer Market, 2016-2028 (US$ Bn)
FIG. 24Russia Ginger Beer Market, 2016-2028 (US$ Bn)
FIG. 25BENELUX Ginger Beer Market, 2016-2028 (US$ Bn)
FIG. 26Poland Ginger Beer Market, 2016-2028 (US$ Bn)
FIG. 27Austria Ginger Beer Market, 2016-2028 (US$ Bn)
FIG. 28Rest of Europe Ginger Beer Market, 2016-2028 (US$ Bn)
FIG. 29Japan Ginger Beer Market, 2016-2028 (US$ Bn)
FIG. 30China Ginger Beer Market, 2016-2028 (US$ Bn)
FIG. 31India Ginger Beer Market, 2016-2028 (US$ Bn)
FIG. 32South Korea Ginger Beer Market, 2016-2028 (US$ Bn)
FIG. 33Australia Ginger Beer Market, 2016-2028 (US$ Bn)
FIG. 34Southeast Asia Ginger Beer Market, 2016-2028 (US$ Bn)
FIG. 35Rest of Asia Pacific Ginger Beer Market, 2016-2028 (US$ Bn)
FIG. 36Middle East & Africa Ginger Beer Market, 2016-2028 (US$ Bn)
FIG. 37South Africa Ginger Beer Market, 2016-2028 (US$ Bn)
FIG. 38Nigeria Ginger Beer Market, 2016-2028 (US$ Bn)
FIG. 39Egypt Ginger Beer Market, 2016-2028 (US$ Bn)
FIG. 40GCC Ginger Beer Market, 2016-2028 (US$ Bn)
FIG. 41Israel Ginger Beer Market, 2016-2028 (US$ Bn)
FIG. 42Latin America Ginger Beer Market, 2016-2028 (US$ Bn)
FIG. 43Mechanicalzil Ginger Beer Market, 2016-2028 (US$ Bn)
FIG. 44Argentina Ginger Beer Market, 2016-2028 (US$ Bn)
FIG. 45Colombia Ginger Beer Market, 2016-2028 (US$ Bn)
FIG. 46Peru Ginger Beer Market, 2016-2028 (US$ Bn)
FIG. 47Chile Ginger Beer Market, 2016-2028 (US$ Bn)

List of Tables

TABLE 1Market Snapshot: Global Beauty Devices (Ginger Beer) Market
TABLE 2Global Ginger Beer Market, by Type, 2016-2028 (US$ Bn)
TABLE 3Global Ginger Beer Market, by Sales Channel, 2016-2028 (US$ Bn)
TABLE 4Global Ginger Beer Market, by Geography, 2016-2028 (US$ Bn)
TABLE 5North America Ginger Beer Market, by Type, 2016-2028 (US$ Bn)
TABLE 6North America Ginger Beer Market, by Sales Channel, 2016-2028 (US$ Bn)
TABLE 7North America Ginger Beer Market, by Country, 2016-2028 (US$ Bn)
TABLE 8Europe Ginger Beer Market, by Type, 2016-2028 (US$ Bn)
TABLE 9Europe Ginger Beer Market, by Sales Channel, 2016-2028 (US$ Bn)
TABLE 10Europe Ginger Beer Market, by Country/Region, 2016-2028 (US$ Bn)
TABLE 11Asia Pacific Ginger Beer Market, by Type, 2016-2028 (US$ Bn)
TABLE 12Asia Pacific Ginger Beer Market, by Sales Channel, 2016-2028 (US$ Bn)
TABLE 13Asia Pacific Ginger Beer Market, by Country/Region, 2016-2028 (US$ Bn)
TABLE 14Latin America Ginger Beer Market, by Type, 2016-2028 (US$ Bn)
TABLE 15Latin America Ginger Beer Market, by Sales Channel, 2016-2028 (US$ Bn)
TABLE 16Latin America Ginger Beer Market, by Country/Region, 2016-2028 (US$ Bn)
TABLE 17Middle East Ginger Beer Market, by Type, 2016-2028 (US$ Bn)
TABLE 18Middle East Ginger Beer Market, by Sales Channel, 2016-2028 (US$ Bn)
TABLE 19Middle East Ginger Beer Market, by Country/Region, 2016-2028 (US$ Bn)
TABLE 20Africa Ginger Beer Market, by Type, 2016-2028 (US$ Bn)
TABLE 21Africa Ginger Beer Market, by Sales Channel, 2016-2028 (US$ Bn)
TABLE 22Africa Ginger Beer Market, by Country/Region, 2016-2028 (US$ Bn)

Frequently Asked Questions

How COVID 19 Impacted Ginger Beer Market?

Likewise other industries, COVID 19 also taken a toll on Ginger Beer market with around 9.43% decline in its revenue in 2020 as compare to 2019

Which is the leading regional market for Ginger Beer?

U.S. is the largest regional market with highest share in the total volume of Ginger Beer consumed in 2021

What is the major growth driving factors for global Ginger Beer market?

Increasing awareness about health benefits offered by the ginger beer to result in growing demand for ginger beer

Which is major segment in Ginger Beer market by Type?

Non-alcoholic ginger beer segment dominated the Ginger Beer market in 2021 with over 60% share

Which is major segment in Ginger Beer market by application?

HoReCa (Hotels, Restaurants and Cafe) segment was the largest application of Ginger Beer in 2021 with over 40% share

Nitro Tea Market

Published:
Report ID: 42678

Middle East and Africa Spices Market

Published:
Report ID: 41892

North America Spices Market

Published:
Report ID: 41889

U.S. Spices Market

Published:
Report ID: 41878

Europe Spices Market

Published:
Report ID: 41718

OTC Cough Cold And Allergy Medicine Market

Published:
Report ID: 20062

Tonic Wine Market

Published:
Report ID: 11416

Caffeine Market

Published:
Report ID: 14018

Animal Feed Preservative Market

Published:
Report ID: 63868

Activated Charcoal Supplement Market

Published:
Report ID: 1273

Vetiver Oil Market

Published:
Report ID: 63767

Vegan Eggs Market

Published:
Report ID: 63764

Soy Protein Market

Published:
Report ID: 63276

Superfood Market

Published:
Report ID: 63142

Silk Protein Market

Published:
Report ID: 63133

Ready to Drink Beverages Market

Published:
Report ID: 63054

Probiotic Infant Formula Market

Published:
Report ID: 63047

Probiotic for Kids Market

Published:
Report ID: 63042

Probiotic Cheese Market

Published:
Report ID: 63036

Purchase Options

The report comes as a view-only PDF document, optimized for individual clients. This version is recommended for personal digital use and does not allow printing.
$4699

To meet the needs of modern corporate teams, our report comes in two formats: a printable PDF and a data-rich Excel sheet. This package is optimized for internal analysis and multi-location access, making it an excellent choice for organizations with distributed workforce.
$5699

The report will be delivered in printable PDF format along with the report’s data Excel sheet. This license offers 100 Free Analyst hours where the client can utilize Credence Research Inc.’s research team. It is highly recommended for organizations seeking to execute short, customized research projects related to the scope of the purchased report.
$7699

Smallform of Sample request

Have a question?

User Profile

Don’t settle for less – trust Mitul to help you find the best solution.

Report delivery within 24 to 48 hours

– Other Info –

What people say?-

User Review

I am very impressed with the information in this report. The author clearly did their research when they came up with this product and it has already given me a lot of ideas.

Jana Schmidt
CEDAR CX Technologies

– Connect with us –

Phone

+91 6232 49 3207


support

24/7 Research Support


sales@credenceresearch.com

– Research Methodology –

Going beyond the basics: advanced techniques in research methodology

– Trusted By –

Pepshi, LG, Nestle
Motorola, Honeywell, Johnson and johnson
LG Chem, SIEMENS, Pfizer
Unilever, Samsonite, QIAGEN