
Market Overview
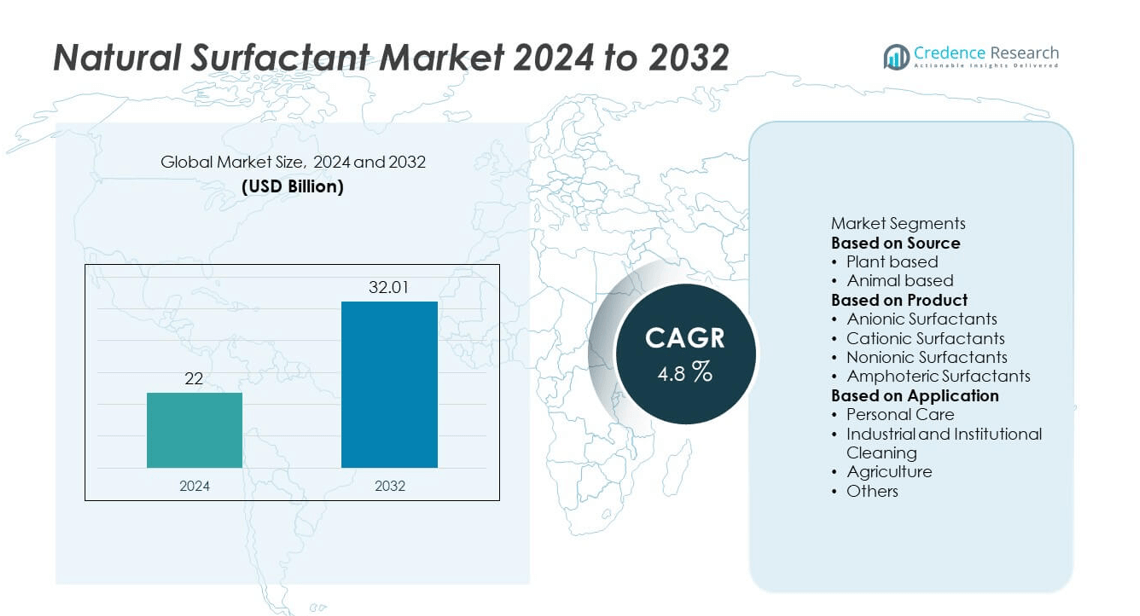
Natural Surfactant Market size was valued at USD 22 billion in 2024 and is projected to reach USD 32.01 billion by 2032, growing at a CAGR of 4.8% during the forecast period.
| REPORT ATTRIBUTE | DETAILS |
|---|---|
| Historical Period | 2020-2023 |
| Base Year | 2024 |
| Forecast Period | 2025-2032 |
| Natural Surfactant Market Size 2024 | USD 22 billion |
| Natural Surfactant Market, CAGR | 4.8% |
| Natural Surfactant Market Size 2032 | USD 32.01 billion |
The Natural Surfactant Market grows through rising demand for eco-friendly and biodegradable ingredients, supported by strict regulations restricting synthetic surfactants. Consumers prefer clean-label formulations in personal care, cosmetics, home care, and food products, driving adoption of plant and sugar-based alternatives.
The Natural Surfactant Market demonstrates strong geographical presence across North America, Europe, Asia-Pacific, Latin America, and the Middle East & Africa. North America leads with high adoption driven by consumer awareness, strong regulatory support, and rapid uptake of eco-friendly personal care and home care products. Europe shows consistent growth with strict environmental regulations, strong demand for clean-label cosmetics, and heavy investment in green chemistry. Asia-Pacific emerges as the fastest-growing region, supported by urbanization, rising disposable incomes, and large-scale production of plant-based raw materials in China, India, and Southeast Asia. Latin America and the Middle East & Africa witness gradual adoption, supported by local agricultural resources and growing awareness of sustainable products. Key players shaping the competitive landscape include BASF, Croda International, Evonik Industries, and Arkema Group, all of which invest in biotechnology, sustainable sourcing, and product innovation to capture opportunities in diverse applications and strengthen their global market positions.
Market Insights
- The Natural Surfactant Market was valued at USD 22 billion in 2024 and is projected to reach USD 32.01 billion by 2032, growing at a CAGR of 4.8%.
- Rising demand for biodegradable, eco-friendly, and plant-based surfactants drives market growth. Consumers and industries shift from synthetic to natural alternatives to meet sustainability goals.
- Trends show increased use of bio-based raw materials, biotechnology-driven innovations, and wider adoption in clean-label cosmetics, food products, and specialty applications such as agriculture and pharmaceuticals.
- Key players such as BASF, Croda International, Evonik Industries, Arkema Group, and The Dow Chemical Company dominate the market. They invest in R&D, sustainable sourcing, and strategic partnerships to strengthen competitiveness.
- High production costs and raw material price volatility restrain growth. Limited performance in certain industrial applications compared to synthetic surfactants also creates adoption barriers.
- North America leads due to strong regulatory frameworks and high consumer awareness, while Europe shows steady growth through environmental compliance and clean-label trends. Asia-Pacific grows fastest, supported by urbanization, rising incomes, and local raw material availability.
- Long-term opportunities lie in functional foods, premium cosmetics, and industrial applications, with Latin America and the Middle East & Africa gradually expanding adoption through awareness programs, agricultural integration, and partnerships with global manufacturers.
Market Drivers
Rising Demand for Eco-Friendly and Sustainable Ingredients
The Natural Surfactant Market grows with the increasing shift toward eco-friendly and biodegradable ingredients. Consumers prefer products with natural origins that reduce environmental impact and align with sustainability goals. Personal care, home care, and food industries integrate natural surfactants to meet green-label expectations. Regulatory frameworks restricting synthetic surfactants also accelerate adoption. Brands highlight natural formulations to gain consumer trust and differentiate in competitive markets. It creates strong opportunities for manufacturers offering bio-based and renewable surfactant solutions.
- For instance, BASF SE launched Plantapon® Soy, a 100% natural-origin anionic surfactant derived from non-GMO European soy protein and coconut oil. Delivering mild cleansing for personal care products, it is classified as "readily biodegradable" according to tests like the OECD 301F standard, which requires achieving at least 60% degradation within 28 days.
Expansion of Personal Care and Cosmetic Applications
The Natural Surfactant Market benefits from high demand in personal care and cosmetics. Growing awareness of skin health and sensitivity drives preference for mild, plant-derived surfactants. Shampoos, body washes, and facial cleansers increasingly feature natural options to appeal to health-conscious buyers. Multinational brands reformulate portfolios to align with consumer demand for safer, transparent ingredients. Rising disposable incomes in emerging markets further strengthen growth in premium natural cosmetics. It reinforces the importance of surfactants in supporting clean beauty trends worldwide.
- For instance, Clariant introduced GlucoTain® GEM, a sugar-based surfactant with a high renewable content (up to 96% Renewable Carbon Index) and excellent skin compatibility, recommended for products including baby shampoos. It is used as an ingredient in various formulations globally, including those for solid and waterless formats.
Strong Adoption in Food and Beverage Processing
The Natural Surfactant Market gains traction in the food and beverage sector due to rising demand for natural emulsifiers. Applications in bakery, dairy, and confectionery highlight their role in enhancing stability and texture. Clean-label food products increasingly rely on natural surfactants to replace synthetic additives. Manufacturers adopt bio-based emulsifiers to meet consumer preference for simple and safe ingredient lists. Growing popularity of functional and fortified foods further supports demand. It ensures continued adoption across diverse food and beverage categories.
Supportive Regulatory Policies and Industry Investments
The Natural Surfactant Market advances with supportive regulations promoting safer alternatives to petrochemical surfactants. Governments encourage the use of bio-based raw materials to reduce environmental pollution. Industry players invest in R&D to improve cost efficiency and performance of natural surfactants. Partnerships between chemical companies and biotechnology firms expand production capacity and innovation. Sustainable sourcing of raw materials such as plant oils enhances market reliability. It ensures long-term growth by combining regulatory compliance with industry-led innovation.
Market Trends
Growing Preference for Bio-Based and Renewable Raw Materials
The Natural Surfactant Market shows a clear trend toward bio-based raw materials derived from plant oils, sugar, and starch. Manufacturers highlight renewable sourcing to appeal to environmentally conscious consumers. Growing restrictions on petrochemical surfactants strengthen this transition. Food, cosmetics, and home care sectors prioritize natural inputs to enhance product safety and sustainability. Demand for biodegradable solutions supports stronger adoption in developed economies. It positions natural surfactants as essential components of eco-friendly formulations.
- For instance, Croda International launched its ECO range with 100% renewable content certified by RSPO and USDA BioPreferred®, producing over 30,000 metric tons of bio-based surfactants annually at its Atlas Point site using bio-ethylene feedstock.
Rising Integration in Personal and Home Care Formulations
The Natural Surfactant Market evolves with higher integration in skincare, haircare, and home cleaning products. Consumers prefer products with mild, non-toxic properties that reduce irritation risks. Multinational brands expand clean-label portfolios by replacing synthetic surfactants with natural alternatives. Marketing strategies highlight transparency and safety, reinforcing consumer trust. Emerging markets show growing preference for natural-based products supported by rising disposable incomes. It strengthens long-term adoption in daily-use personal and household products.
- For instance, Evonik Industries introduced RHEANCE® One, a glycolipid surfactant produced via bacterial fermentation of sugar. The bacterium used belongs to the Pseudomonas putida family, which was modified by Evonik to produce the biosurfactant on an industrial scale.
Expansion of Biotechnological Innovations and Manufacturing Efficiency
The Natural Surfactant Market advances with biotechnological breakthroughs that improve yield and cost-effectiveness. Enzymatic and microbial processes produce surfactants with higher purity and stability. Biotechnology reduces dependence on traditional plant sources, ensuring consistent supply. Companies adopt advanced fermentation techniques to scale production sustainably. Research focuses on enhancing performance for complex industrial applications. It reinforces the role of innovation in boosting competitiveness and reducing production costs.
Increasing Role in Functional and Specialty Applications
The Natural Surfactant Market demonstrates rising demand in specialty applications beyond conventional uses. Pharmaceutical, agriculture, and oilfield industries adopt natural surfactants for their biodegradability and multifunctional properties. Growing focus on functional foods and nutraceuticals expands their role as natural emulsifiers. Specialty cleaning solutions incorporate them to meet strict safety standards. Industrial users seek high-performance natural surfactants for eco-friendly operations. It diversifies opportunities and positions natural surfactants as strategic solutions across multiple industries.
Market Challenges Analysis
High Production Costs and Limited Raw Material Availability
The Natural Surfactant Market faces challenges from high production costs and limited raw material supply. Extraction and processing of plant-based inputs such as sugar, starch, and vegetable oils require advanced technology, driving up costs. Seasonal variations and agricultural dependency further affect raw material availability and pricing stability. Smaller manufacturers often struggle to compete with synthetic alternatives that remain cheaper. Volatility in supply chains, especially in developing regions, increases risks for large-scale adoption. It restricts market growth where cost sensitivity is a major factor for consumers and industries.
Performance Gaps and Regulatory Complexity Across Industries
The Natural Surfactant Market also encounters difficulties due to performance limitations in certain applications. Some natural surfactants show weaker foaming, emulsifying, or stability properties compared to synthetic options. Industrial users demand high-performance solutions, creating barriers to wider replacement of petrochemical surfactants. Regulatory compliance varies across regions, leading to fragmented approval processes that slow product launches. Manufacturers must invest heavily in R&D to overcome technical barriers and meet diverse standards. It highlights the need for continuous innovation and harmonized regulations to support consistent global adoption.
Market Opportunities
Expansion in Clean-Label Consumer Products and Green Chemicals
The Natural Surfactant Market offers strong opportunities through the expansion of clean-label personal care, cosmetics, and home care products. Consumers increasingly demand formulations that use safe, non-toxic, and biodegradable ingredients. Brands highlight natural surfactants to align with sustainability goals and appeal to eco-conscious buyers. Growth in premium skincare and organic cosmetics further supports demand. Rising awareness in emerging markets creates new opportunities for affordable, natural-based daily-use products. It positions natural surfactants as a key differentiator for companies targeting environmentally responsible consumers.
Innovation in Industrial and Specialty Applications
The Natural Surfactant Market also benefits from increasing adoption in pharmaceuticals, agriculture, and oilfield applications. Biodegradable surfactants are preferred in industrial operations that seek to reduce environmental footprints. Functional foods and nutraceuticals use natural emulsifiers to meet safety and performance standards. Biotechnology-driven innovation improves production efficiency, enabling wider use in specialty sectors. Partnerships between chemical companies and biotech firms accelerate development of high-performance solutions. It strengthens the long-term potential of natural surfactants by extending their role beyond traditional consumer applications.
Market Segmentation Analysis:
By Source The Natural Surfactant Market divides by source into plant-based, sugar-based, and others. Plant-based surfactants derived from vegetable oils dominate due to wide availability and suitability across industries. Sugar-based surfactants gain strong traction with rising demand for mild, biodegradable, and skin-friendly products. They are widely used in personal care and home care formulations. Other natural sources, including starch and microbial fermentation, also contribute to diversification. It creates opportunities for producers to balance performance, cost, and sustainability in sourcing strategies.
- For instance, Solvay released its Mirasoft® SL L60 and SL A60 biosurfactants derived from rapeseed oil and sugar, targeting personal care formulations such as shampoos and face washes and emphasizing full biodegradability and renewable composition.
By Product The Natural Surfactant Market includes anionic, cationic, non-ionic, and amphoteric surfactants. Anionic surfactants hold a leading share, driven by strong use in detergents, personal care, and household cleaners. Non-ionic surfactants grow steadily due to their mildness and compatibility with sensitive formulations. Amphoteric surfactants gain popularity in personal care and cosmetics where mild foaming properties are valued. Cationic surfactants, though niche, support applications in conditioning and antimicrobial products. It ensures diverse product development tailored to consumer and industrial needs.
- For instance, Clariant's Hostapon® SGC, an amino acid–based anionic surfactant, is noted for its mild performance and versatility across pH ranges. It features a high Renewable Carbon Index of 86 and an Environmental Working Group score of 0, indicating safety and green credentials.
By Application The Natural Surfactant Market demonstrates wide application across personal care, home care, food and beverage, agriculture, and industrial sectors. Personal care leads adoption, with shampoos, body washes, and cosmetics increasingly using natural formulations. Home care follows, where natural detergents and cleaners replace synthetic alternatives to meet eco-friendly demand. Food and beverage sectors utilize natural surfactants as emulsifiers in bakery, dairy, and confectionery products. Agriculture adopts them in crop protection and soil treatment for safer farming practices. Industrial applications, including oilfield and pharmaceutical operations, expand adoption due to performance and environmental benefits. It highlights the growing versatility of natural surfactants across diverse industries.
Segments:
Based on Source
- Plant based
- Animal based
Based on Product
- Anionic Surfactants
- Cationic Surfactants
- Nonionic Surfactants
- Amphoteric Surfactants
Based on Application
- Personal Care
- Industrial and Institutional Cleaning
- Agriculture
- Others
Based on the Geography:
- North America
- U.S.
- Canada
- Mexico
- Europe
- UK
- France
- Germany
- Italy
- Spain
- Russia
- Belgium
- Netherlands
- Austria
- Sweden
- Poland
- Denmark
- Switzerland
- Rest of Europe
- Asia Pacific
- China
- Japan
- South Korea
- India
- Australia
- Thailand
- Indonesia
- Vietnam
- Malaysia
- Philippines
- Taiwan
- Rest of Asia Pacific
- Latin America
- Brazil
- Argentina
- Peru
- Chile
- Colombia
- Rest of Latin America
- Middle East
- UAE
- KSA
- Israel
- Turkey
- Iran
- Rest of Middle East
- Africa
- Egypt
- Nigeria
- Algeria
- Morocco
- Rest of Africa
Regional Analysis
North America
North America holds the largest share of the Natural Surfactant Market, accounting for 32% in 2024. Strong consumer awareness of eco-friendly and sustainable products drives consistent adoption across personal care, cosmetics, and home care industries. The United States dominates the regional market due to widespread demand for clean-label products and strict environmental regulations. Canada contributes through growing investments in green chemicals and rising penetration of organic personal care brands. Well-established R&D infrastructure supports innovation in biotechnology-based surfactants, improving performance and scalability. Companies operating in this region focus on strategic collaborations with raw material suppliers to strengthen sustainable sourcing. It reinforces North America’s role as a leader in promoting natural and biodegradable surfactant solutions.
Europe
Europe represents the second-largest region in the Natural Surfactant Market, with a 30% share in 2024. Regulatory frameworks such as REACH and directives promoting reduced use of synthetic chemicals accelerate adoption. Countries like Germany, France, and the United Kingdom lead in demand, supported by strong consumer preference for organic and eco-friendly products. The cosmetics and personal care industry in Europe is a key driver, with manufacturers reformulating products to meet clean-label requirements. Demand for sustainable cleaning agents in households and industries further boosts growth. Investments in green chemistry and circular economy initiatives enhance innovation in surfactant production. It ensures Europe remains a key hub for environmentally responsible formulations and sustainable growth.
Asia-Pacific
Asia-Pacific accounts for 25% of the Natural Surfactant Market in 2024 and emerges as the fastest-growing region. Rising urbanization, disposable incomes, and awareness of health and wellness fuel strong demand for natural-based personal care and food products. China, India, Japan, and South Korea are major contributors, with expanding cosmetics and home care industries. Local production of bio-based surfactants, supported by abundant agricultural resources, enhances supply chain resilience. Governments in the region promote eco-friendly practices and sustainable manufacturing, further stimulating growth. Multinational companies expand partnerships with regional players to capture diverse consumer bases. It positions Asia-Pacific as a long-term growth engine for natural surfactants globally.
Latin America
Latin America contributes 7% share to the Natural Surfactant Market in 2024. Brazil and Mexico drive demand with rising preference for natural personal care, food, and household cleaning products. Growth in middle-class populations and increased awareness of environmental issues encourage adoption. Expansion of local agricultural resources provides raw material support for bio-based surfactant production. Economic constraints in some countries limit large-scale deployment, but niche demand for eco-friendly products grows steadily. International companies strengthen market presence through partnerships with local distributors and product localization strategies. It ensures gradual yet sustainable expansion across the region.
Middle East & Africa
The Middle East & Africa region holds 6% of the Natural Surfactant Market in 2024. Gulf countries such as the UAE and Saudi Arabia lead adoption due to growing demand for sustainable cleaning products and cosmetics. Africa shows potential with rising consumer awareness and mobile-driven e-commerce platforms increasing product accessibility. Governments invest in sustainable manufacturing initiatives, though local production capacity remains limited. Imports of natural surfactants play a key role in meeting regional demand. Growth opportunities emerge in food processing, personal care, and agricultural applications. It highlights the region as a developing market with steady adoption potential and long-term prospects for international players.
Key Player Analysis
- SEPPIC
- BASF
- Clariant
- Evonik Industries
- The Dow Chemical Company
- Croda International
- Innovative Chemical Technologies
- Arkema Group
- Stepan Company
- Kao Corporation
Competitive Analysis
Competitive landscape of the Natural Surfactant Market is led by BASF, Arkema Group, Clariant, Croda International, Evonik Industries, Innovative Chemical Technologies, Kao Corporation, SEPPIC, Stepan Company, and The Dow Chemical Company. These companies focus on expanding their portfolios with bio-based and biodegradable surfactants to meet rising global demand for eco-friendly solutions. Strong emphasis is placed on research and development, with players investing in biotechnology, microbial fermentation, and renewable raw materials to improve performance and reduce production costs. Strategic collaborations and partnerships with food, cosmetics, and industrial manufacturers enhance their market penetration across diverse applications. Companies also strengthen their positions by securing sustainable sourcing of raw materials, developing clean-label products, and expanding regional manufacturing capacities. Competitive intensity remains high as manufacturers address cost-efficiency challenges while differentiating products through innovation and regulatory compliance. Growing opportunities in emerging markets and specialty applications further push companies to prioritize sustainability, scalability, and technological advancements in natural surfactant production.
Recent Developments
- In April 2025, At in-cosmetics Global 2025, BASF unveiled three sustainable personal care ingredients: Verdessence® Maize, Lamesoft® OP Plus, and Dehyton® PK45 GA/RA, integrating biodegradable and plant-derived surfactant technologies within its "Longevity Ecosystem."
- In April 2025, Stepan began production at its new alkoxylation facility in Pasadena, Texas, enhancing its capability to produce ethoxylated surfactants and intermediate materials.
- In 2025, Evonik Industries received the Ringier Technology Innovation Award for its 100% natural and readily biodegradable biosurfactant TEGO® Wet 580 Terra, designed for coatings and inks and lauded for efficiency and eco performance.
- In May 2024, Evonik inaugurated the world’s first industrial-scale biosurfactant facility in Slovakia, producing rhamnolipid biosurfactants via fermentation-a major milestone in sustainable surfactant production.
Report Coverage
The research report offers an in-depth analysis based on Source, Product, Application and Geography. It details leading market players, providing an overview of their business, product offerings, investments, revenue streams, and key applications. Additionally, the report includes insights into the competitive environment, SWOT analysis, current market trends, as well as the primary drivers and constraints. Furthermore, it discusses various factors that have driven market expansion in recent years. The report also explores market dynamics, regulatory scenarios, and technological advancements that are shaping the industry. It assesses the impact of external factors and global economic changes on market growth. Lastly, it provides strategic recommendations for new entrants and established companies to navigate the complexities of the market.
Future Outlook
- Demand for natural surfactants will rise with increasing consumer preference for eco-friendly products.
- Biotechnology and fermentation processes will improve cost efficiency and production scalability.
- Personal care and cosmetics will remain leading application areas for natural surfactants.
- Food and beverage industries will expand use of natural surfactants as safe emulsifiers.
- Industrial applications such as agriculture and oilfield chemicals will adopt biodegradable alternatives.
- Asia-Pacific will continue as the fastest-growing region with abundant raw material availability.
- Strategic collaborations between chemical producers and biotech firms will accelerate innovation pipelines.
- Clean-label and sustainability certifications will drive stronger adoption across developed markets.
- Premium product segments in skincare and organic cosmetics will create high-value opportunities.
- Continuous R&D investment will focus on performance improvements to compete with synthetic surfactants.

Request a Free Sample
Fill in your details and we'll send you a free sample report.
- Sample data tables & charts
- Research methodology
Need a Custom Version of This Report?
Tailor the scope, geography, or segments to your exact requirements.
- Custom geography or segment scope
- Direct access to our analyst team
Frequently Asked Questions
What is the current market size for Natural Surfactant, and what is its projected size in 2032?
Which Natural Surfactant market segment held the largest share in 2024?
What are the primary factors fueling the growth of the Natural Surfactant market?
Who are the leading companies in the Natural Surfactant market?
Table of Content
Chapter 1. Report Introduction
- 1.1 Report Description & Purpose
- 1.1.1 Report Title & Market Definition
- 1.1.2 Unique Selling Propositions (USP) & Key Differentiators
- 1.1.3 Value Proposition for Stakeholders
- 1.2 Research Objectives
- 1.2.1 Market Sizing Objectives (Volume & Revenue) (Volume Where Applicable)
- 1.2.2 Segmentation Objectives
- 1.2.3 Competitive Intelligence Objectives
- 1.2.4 Forecast & Scenario Objectives
- 1.3 Report Scope
- 1.3.1 Natural Surfactant Scope – Segments & Subsegments Covered
- 1.3.2 Geographic Scope – Regions & Countries Covered
- 1.3.3 Historical Period, Base Year & Forecast Period (2024; forecast to 2032)
- 1.3.4 Inclusions & Exclusions
- 1.4 Industry Classification & Applicable Codes
- 1.5 Currency, Measurement Units & Valuation Basis
- 1.6 Target Stakeholders
- 1.7 Limitations & Assumptions
Chapter 2. Executive Summary
- 2.1 Global Natural Surfactant Market Snapshot
- 2.1.1 Market Size – Historical (2024) & Forecast (2024-2032) (2024: USD 22 billion → 2032: USD 32.01 billion)
- 2.1.2 Volume & Revenue – Global Totals (Volume Where Applicable)
- 2.1.3 Key Market Highlights – Top Five Facts
- 2.2 Natural Surfactant Market Segmentation Snapshot
- 2.2.1 Market Split by Region – 2024 vs. 2032
- 2.3 Competitive Snapshot
- 2.3.1 Top 10 Players by Revenue Share – 2024
- 2.3.2 Top 10 Players by Volume Share – 2024 (Volume Where Applicable)
- 2.3.3 Recent Strategic Developments (18-Month Summary)
- 2.4 Key Investment Highlights & Strategic Conclusions
Chapter 3. Natural Surfactant Market Dynamics & Industry Analysis
- 3.1 Market Overview & Context
- 3.1.1 Natural Surfactant Market Position in the Broader Industry Value Chain
- 3.1.2 Demand Structure & Purchasing Dynamics
- 3.1.3 Market Maturity & Development Stage by Region
- 3.2 Natural Surfactant Market Drivers
- 3.3 Natural Surfactant Market Restraints & Challenges
- 3.4 Natural Surfactant Market Opportunities
- 3.5 Porter's Five Forces Analysis
- 3.5.1 Threat of New Entrants
- 3.5.2 Bargaining Power of Suppliers
- 3.5.3 Bargaining Power of Buyers
- 3.5.4 Threat of Substitutes
- 3.5.5 Competitive Rivalry – Intensity Assessment
- 3.6 Natural Surfactant Value Chain Analysis
- 3.6.1 Upstream – Key Inputs, Resources & Suppliers
- 3.6.1.1 Key Input/Resource 1
- 3.6.1.2 Key Input/Resource 2
- 3.6.1.3 Key Input/Resource 3
- 3.6.2 Midstream – Core Operations & Value Creation
- 3.6.2.1 Operating Model & Process Overview
- 3.6.2.2 Key Operating Locations & Capabilities by Company
- 3.6.3 Downstream – Market Channels & End Users
- 3.6.3.1 Direct Sales & Customer Engagement Channels
- 3.6.3.2 Indirect Sales, Intermediaries & Partner Channels
- 3.6.4 Value Chain Profitability Analysis
- 3.6.1 Upstream – Key Inputs, Resources & Suppliers
- 3.7 PESTEL Analysis
- 3.7.1 Political Factors
- 3.7.2 Economic Factors
- 3.7.3 Social Factors
- 3.7.4 Technological Factors
- 3.7.5 Environmental Factors
- 3.7.6 Legal Factors
- 3.8 Natural Surfactant Supply Chain Analysis
- 3.8.1 Critical Input & Resource Availability Risk Assessment
- 3.8.2 Supplier & Operational Concentration Risk (Geographic Exposure)
- 3.8.3 Supply & Service Disruption Impact Analysis
- 3.9 Regulatory & Policy Landscape
Note: The regulatory and policy landscape section covers regulations based on their applicability to the market, Natural Surfactant category, geography, and scope of the study. Only regulatory frameworks with a material impact on operations, compliance, trade, sustainability, or market access are analyzed in detail.
Chapter 4. Key Investment Pockets & Opportunity Analysis
- 4.1 Natural Surfactant Market Attractiveness Analysis
- 4.1.1 By Region – Investment Attractiveness Matrix (Market Size × CAGR)
- 4.2 Absolute Revenue Growth Opportunity
- 4.2.1 By Region – Absolute Revenue Growth Through 2032
- 4.3 Incremental Demand Opportunity
- 4.3.1 By Region – Incremental Demand Through 2032
- 4.3.2 Segment – Incremental Demand
- 4.4 Emerging Submarket Opportunity Deep Dive (Subject to Applicability)
- 4.5 Priority Market Opportunity Scorecards
- 4.5.1 United States
- 4.5.2 Europe
- 4.5.3 Asia
- 4.5.4 Middle East & Africa
Note: Priority market opportunity scorecards reflect the geographic scope and strategic relevance of the study. Listed markets are indicative and may be adapted to the industry.
Chapter 5. Natural Surfactant Cross-Border Trade & Market Access Analysis
- 5.1 International Trade & Cross-Border Activity Overview
- 5.1.1 Global Export Value by Country (2024)
- 5.1.2 Global Export Volume by Country (2024) (Volume Where Applicable)
- 5.1.3 Global Import Value by Country (2024)
- 5.1.4 Global Import Volume by Country (2024) (Volume Where Applicable)
- 5.1.5 Net Trade Balance by Country (2024)
- 5.2 Export Analysis – Segment
- 5.2.1 Category 1 (Applicable Classification Code)
- 5.2.2 Category 2 (Applicable Classification Code)
- 5.2.3 Category 3 (Applicable Classification Code)
- 5.2.4 Category 4 (Applicable Classification Code)
- 5.2.5 Category 5 (Applicable Classification Code)
- 5.3 Import Analysis – Segment
- 5.3.1 Category 1 (Applicable Classification Code)
- 5.3.2 Category 2 (Applicable Classification Code)
- 5.3.3 Category 3 (Applicable Classification Code)
- 5.3.4 Category 4 (Applicable Classification Code)
- 5.3.5 Category 5 (Applicable Classification Code)
- 5.4 Cross-Border Pricing & Transaction Benchmarks
- 5.4.1 Export Pricing – Segment & Country
- 5.4.2 Import Pricing – Segment & Source Country
- 5.4.3 Price Trends (2024)
- 5.5 Key Cross-Border Trade & Delivery Routes
- 5.5.1 Cross-Border Trade/Delivery Route 1
- 5.5.2 Cross-Border Trade/Delivery Route 2
- 5.5.3 Cross-Border Trade/Delivery Route 3
- 5.5.4 Cross-Border Trade/Delivery Route 4
- 5.5.5 Cross-Border Trade/Delivery Route 5
- 5.6 Trade Policy & Market Access Impact Assessment
- 5.6.1 Tariff & Non-Tariff Barriers
- 5.6.2 Regional Trade & Economic Integration Frameworks
- 5.6.3 Bilateral & Multilateral Trade Agreements
- 5.6.4 Cross-Border Operating, Licensing & Localization Requirements
Note: This chapter applies where cross-border trade or delivery is relevant to Natural Surfactant. Goods, services, and digital offerings are assessed using applicable classifications and transaction measures. Import-export volumes, trade balances, and route analyses are included only where meaningful to the market.
Chapter 6. Competitive Landscape & Company Benchmarking
- 6.1 Natural Surfactant Market Concentration & Structure
- 6.1.1 Herfindahl-Hirschman Index (HHI) – vs. 2024
- 6.1.2 Leading, Mid-Sized & Emerging Player Structure
- 6.1.3 Global, Regional & Local Player Dynamics
- 6.2 Natural Surfactant Market Share Analysis – 2024
- 6.2.1 Global Revenue Share by Company
- 6.2.2 Global Volume Share by Company (Volume Where Applicable)
- 6.2.3 Regional Revenue Share
- 6.2.4 Market Share Evolution ( vs. 2024)
- 6.2.5 Company Market Share by Key Segment
- 6.2.6 Company Market Share by Customer Group
- 6.3 Operating Scale, Capacity & Infrastructure Analysis
- 6.3.1 Global Operating Scale & Supply Capacity
- 6.3.2 Resource Utilization & Operating Efficiency
- 6.3.3 Output, Service Delivery & Activity Metrics
- 6.3.4 Operating Footprint & Infrastructure Map
- 6.3.5 Planned Operational & Capacity Expansion
- 6.4 Natural Surfactant Competitive Benchmarking Matrix
- 6.4.1 Revenue, Growth, Profitability & Operating Metric Comparison
- 6.4.2 Channel Revenue Mix
- 6.4.3 Geographic Revenue Exposure
- 6.4.4 R&D Intensity
- 6.4.5 Sustainability Maturity
- 6.5 Strategic Developments in Natural Surfactant (Last 24 Months)
- 6.5.1 Mergers, Acquisitions & Divestments
- 6.5.2 New Products, Services & Solutions in Natural Surfactant
- 6.5.3 Operational & Infrastructure Expansions
- 6.5.4 Strategic Alliances, Joint Ventures & Partnerships
- 6.5.5 Distribution Expansion & Market Entry
- 6.5.6 Sustainability & ESG Initiatives
- 6.6 Competitive Strategy Mapping
- 6.6.1 Leader, Challenger, Follower & Niche Classification
- 6.6.2 Pricing Strategy Comparison
- 6.6.3 Channel Strategy Matrix
Note: Strategic developments are included based on their materiality and the availability of reliable information.
Chapter 7. Global Natural Surfactant Market – By Sales & Delivery Channel
- 7.1 Segment Overview
- 7.1.1 Volume & Revenue Split by Channel (2024 & 2032) (Volume Where Applicable)
- 7.1.2 Channel Mix Evolution (2024-2032)
Chapter 8. Regional Market Analysis – Global Overview
- 8.1 Global Regional Overview
- 8.1.1 Regional Volume Share (Volume Where Applicable)
- 8.1.2 Regional Revenue Share
- 8.1.3 Regional Volume by Region (Volume Where Applicable)
- 8.1.4 Regional Revenue by Region
- 8.1.5 Regional Forecast Through 2032
- 8.2 Cross-Regional Segment Analysis
- 8.2.1 By Sales & Delivery Channel
- 8.2.2 By Competitive Positioning & Price Tier
Chapter 9. North America Natural Surfactant Market
- 9.1 United States
- 9.2 Canada
- 9.3 Mexico
Chapter 10. Europe Natural Surfactant Market
- 10.1 Germany
- 10.2 France
- 10.3 Italy
- 10.4 United Kingdom
- 10.5 Spain
- 10.6 Poland
- 10.7 Russia
- 10.8 Netherlands
- 10.9 Belgium
- 10.10 Sweden
- 10.11 Denmark
- 10.12 Norway
- 10.13 Rest of Europe
Chapter 11. Asia Pacific Natural Surfactant Market
- 11.1 China
- 11.2 India
- 11.3 Japan
- 11.4 South Korea
- 11.5 Thailand
- 11.6 Indonesia
- 11.7 Vietnam
- 11.8 Malaysia
- 11.9 Australia
- 11.10 Rest of Asia Pacific
Chapter 12. Latin America Natural Surfactant Market
- 12.1 Brazil
- 12.2 Argentina
- 12.3 Colombia
- 12.4 Chile
- 12.5 Rest of Latin America
Chapter 13. Middle East Natural Surfactant Market
- 13.1 Saudi Arabia
- 13.2 United Arab Emirates
- 13.3 Turkey
- 13.4 Israel
- 13.5 Iran
- 13.6 Rest of the Middle East
Chapter 14. Africa Natural Surfactant Market
- 14.1 South Africa
- 14.2 Egypt
- 14.3 Nigeria
- 14.4 Morocco
- 14.5 Rest of Africa
Chapter 15. Natural Surfactant Company Profiles
- 15.1 [Company 01]
- 15.1.1 Company Overview
- 15.1.2 Key Management Personnel
- 15.1.3 Products & Services Portfolio
- 15.1.4 Financial Performance
- 15.1.5 Key Market Focus & Geographic Presence
- 15.1.6 Recent Developments & Strategic Initiatives
Note: The company profile list is preliminary and may change based on research findings, market developments, data availability, and client requirements.
Chapter 16. Appendices
- Appendix A – List of Abbreviations & Acronyms
- Appendix B – Industry Classification Code Reference – Full Series
- Appendix C – Supply, Output & Operating Capacity Data Tables
- Appendix D – End-Use & Demand Base Tables
- Appendix E – Demand, Adoption & Usage Assumptions
- Appendix F – Pricing & Revenue Metric Reference Tables
- Appendix G – Company Operations & Infrastructure Database
- Appendix H – Cross-Border Trade & Activity Data Tables (Where Applicable)
- Appendix I – Regulatory Summary Tables
- Appendix J – Primary Research Participant List (Anonymized)
- Appendix K – Primary Research Questionnaire Framework
- Appendix L – Data Sources & Bibliography
- Appendix M – Market Size Divergence & Source Comparison
Chapter 17. Research Methodology
- 17.1 Research Framework & Philosophy
- 17.2 Secondary Research – Sources, Hierarchy & Data Extraction
- 17.3 Data Modeling – Bottom-Up & Top-Down Market Sizing
- 17.4 Primary Research – Stakeholder Framework, LOI & Sample Sizes
- 17.5 Forecast Methodology – Regression, Scenario & Sensitivity Analysis
- 17.6 Quality Control – Four-Layer Validation Framework
- 17.7 Limitations & Standard Assumptions
- 17.8 Disclaimer
