
Market Overview
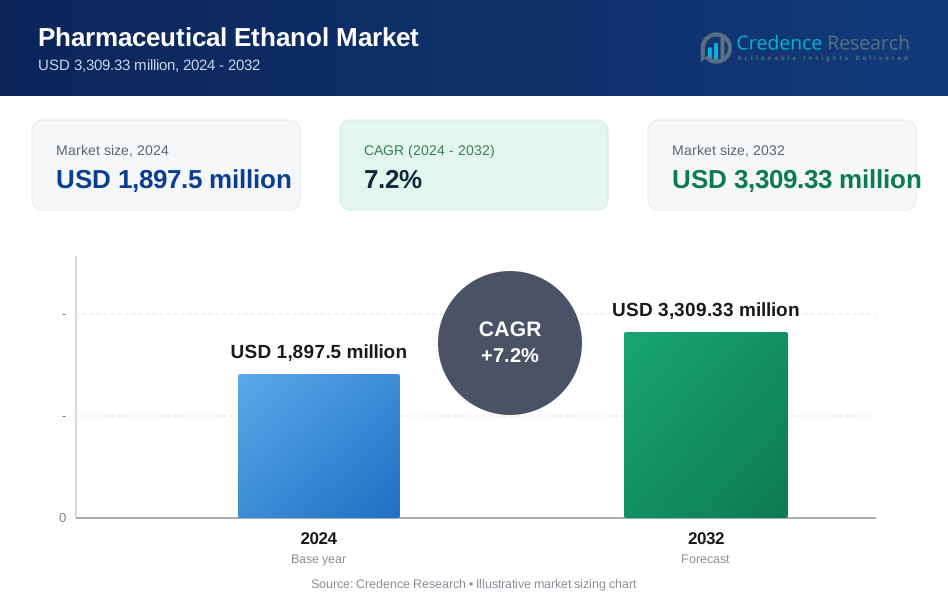
Pharmaceutical Ethanol Market size was valued at USD 1,897.5 million in 2024 and is anticipated to reach USD 3,309.33 million by 2032, expanding at a CAGR of 7.2% during the forecast period (2025–2032).
| REPORT ATTRIBUTE | DETAILS |
|---|---|
| Historical Period | 2020-2023 |
| Base Year | 2024 |
| Forecast Period | 2025-2032 |
| Pharmaceutical Ethanol Market Size 2024 | USD 1,897.5 Million |
| Pharmaceutical Ethanol Market, CAGR | 7.2% |
| Pharmaceutical Ethanol Market Size 2032 | USD 3,309.33 Million |
The pharmaceutical ethanol market is shaped by a strong group of global producers, including Raízen (Cosan S.A.), Greenfield Global Inc., Grain Processing Corporation, Wilmar International Limited, Cristal Union, Univar Solutions Inc., Archer Daniels Midland Company, MGP Ingredients, Inc., Cargill, Incorporated, and Roquette Frères. These companies compete by offering high-purity, GMP-compliant ethanol grades and maintaining robust supply reliability for pharmaceutical manufacturing. North America leads the market with approximately 34–36% share, supported by advanced formulation capabilities, strong CDMO presence, and stringent regulatory standards. Europe follows as a major hub due to its well-established pharmaceutical production ecosystem and high-quality compliance frameworks.
Market Insights
- The pharmaceutical ethanol market reached USD 1,897.5 million in 2024 and is projected to hit USD 3,309.33 million by 2032, growing at a 7.2% CAGR, driven by rising use in formulations and clinical hygiene applications.
- Market growth is driven by expanding demand for high-purity ethanol in oral solutions, topical antiseptics, and solvent-dependent drug manufacturing, with synthetic ethanol holding the largest share at around 58–60% due to superior purity and regulatory compliance.
- Key trends include increasing adoption of bio-based ethanol, stronger CDMO partnerships, and growing integration of ethanol across sterile manufacturing and OTC product categories.
- Competitive activity intensifies as major players enhance purification technologies and supply chain reliability, while challenges persist in regulatory variability and feedstock price fluctuations across regions.
- Regionally, North America leads with 34–36% share, followed by Europe at 28–30%, Asia-Pacific at 22–24%, Latin America at 6–7%, and MEA at 4–5%, reflecting strong formulation capacity and expanding pharmaceutical production footprints.
Market Segmentation Analysis:
By Source
Synthetic ethanol holds the dominant position in the pharmaceutical ethanol market, accounting for around 58–60% of total share, driven by its high purity levels, consistent batch-to-batch quality, and strong compliance with pharmacopoeial specifications. Its controlled production process enables manufacturers to meet strict solvent standards for oral dose forms, injectables, and disinfectants. Bio-based ethanol continues to grow due to rising sustainability commitments and lower carbon-intensity production pathways, while the “Others” category comprising blended and specialized solvent grades serves niche formulation needs across select small-volume therapeutic products.
· For instance, Greenfield Global’s Johnstown facility, expanded in September 2023, now produces nearly 70 million gallons of high-purity USP-, EP-, BP-, and JP-grade ethanol each year. The plant uses advanced multi-stage distillation and a GMP-certified laboratory to meet strict pharmacopeia limits, ensuring ethanol purity suitable for oral, topical, and injectable formulations.
By Application
Oral formulations represent the largest application segment, contributing approximately 42–45% of the market, supported by extensive use of ethanol as a solvent, preservative, and carrier in syrups, elixirs, and tinctures. Demand is further strengthened by its compatibility with a wide range of APIs and its ability to enhance solubility for poorly water-soluble compounds. Topical formulations also show robust uptake in antiseptics and dermatological products, while parenteral use remains limited to controlled environments. API manufacturing utilizes ethanol primarily for extraction and purification steps across high-value drug categories.
- For instance, MGP Ingredients supplies high-purity USP-grade ethanol widely used in pharmaceutical formulations. Manufacturers rely on this ethanol as a solvent to help dissolve active ingredients and flavoring agents in medicinal syrups and other oral preparations. The company is recognized as a major U.S. producer of specialty and pharmaceutical-grade alcohols.
Key Growth Drivers
Expanding Use of Ethanol as a Solvent in High-Value Drug Formulations
Pharmaceutical ethanol demand continues to grow as manufacturers intensify the use of ethanol as a versatile solvent across oral, topical, and injectable formulations. Its ability to enhance solubility, stabilize active ingredients, and support controlled-release technologies positions ethanol as an essential excipient in modern drug development. Rising production of complex formulations, including pediatric syrups, cough remedies, dermatological solutions, and herbal-extract-based therapeutics, further boosts uptake. Additionally, ethanol’s GRAS status, low toxicity profile, and wide regulatory acceptance accelerate its integration into global manufacturing pipelines. Increased outsourcing of formulation development to CDMOs also strengthens demand, as these facilities rely on high-purity, pharma-grade ethanol to meet international quality standards. As the number of new chemical entities and reformulated generics rises worldwide, ethanol remains a critical enabling excipient, driving its continued market expansion.
· For instance, Archer Daniels Midland (ADM) supplies USP-grade ethanol distilled to 190-proof and 200-proof specifications, meeting verified pharmacopeial purity standards required for solvent use in syrups, tinctures, and OTC drug formulations.
Strong Growth in Antiseptic, Disinfection, and Clinical Hygiene Products
The pharmaceutical ethanol market benefits significantly from rising global demand for antiseptic and disinfection products across hospitals, ambulatory care centers, and home-use categories. Ethanol is widely preferred for its rapid antimicrobial action, broad-spectrum efficacy, and compatibility with skin-contact products, enabling pharmaceutical manufacturers to meet stringent infection control protocols. The surge in surgical procedures, outpatient care, and chronic disease management increases the consumption of ethanol-based antiseptic liquids, swabs, preoperative solutions, and hand hygiene formulations. Clinical procurement teams continue to prioritize ethanol-based disinfectants due to their faster drying time, minimal residue, and compliance with proven microbiological standards. Furthermore, growing adoption of sterile packaging formats and unit-dose applicators in healthcare settings supports sustained demand. As healthcare providers worldwide invest in infection prevention infrastructure, pharmaceutical ethanol remains integral to disinfection workflows, reinforcing its long-term market growth.
- For instance, Grain Processing Corporation’s Muscatine facility produces high-purity USP-grade ethanol used in pharmaceutical formulations, disinfectants, and hand sanitizers. GPC is recognized for supplying consistent, pharmacopeia-compliant ethanol for regulated health and hygiene applications.
Rising Preference for High-Purity, Regulatory-Compliant Ethanol Grades
Stringent global quality regulations such as USP, EP, and JP pharmacopoeial standards continue to fuel demand for high-purity pharmaceutical ethanol. Manufacturers increasingly require ethanol with low impurity levels, controlled water content, and consistent chemical profiles to support advanced manufacturing processes. Growth in biologics, sterile injectables, and specialty APIs further amplifies the need for ethanol that meets rigorous production tolerances. Suppliers that invest in refined distillation technology, contamination-free storage, and validated supply chain systems gain competitive advantage as regulatory audits intensify. Pharmaceutical companies also seek ethanol grades with verified traceability and documentation to ensure full compliance during global product registrations. The expansion of GMP-compliant production facilities in North America, Europe, and Asia strengthens the availability of high-grade ethanol, enabling robust supply stability. As quality assurance becomes increasingly central to drug manufacturing, demand for regulatory-aligned pharmaceutical ethanol continues to escalate.
Key Trends & Opportunities
Increasing Adoption of Bio-Based Ethanol to Support Sustainability Goals
Bio-based pharmaceutical ethanol presents a major opportunity as manufacturers and healthcare institutions prioritize sustainability, circular production models, and low-carbon raw materials. Bioethanol derived from sugarcane, corn, or cellulosic biomass offers reduced greenhouse gas emissions and aligns with corporate ESG strategies. As regulatory bodies encourage greener supply chains, several drug formulators explore bio-based ethanol for oral solutions, topical applications, and solvent-intensive manufacturing processes. The shift also creates opportunities for suppliers capable of delivering bioethanol that consistently meets USP or EP quality benchmarks. Technological advancements in biomass fermentation and purification techniques enhance yield and impurity control, making bio-based ethanol increasingly competitive with synthetic alternatives. As global pharmaceutical companies announce sustainability-linked procurement commitments, demand for certified renewable ethanol grades is expected to grow steadily, creating long-term opportunities for producers with advanced biorefinery capabilities.
- For instance, Raízen’s second-generation biorefinery at the Bonfim Bioenergy Park adds 82 million liters per year of cellulosic ethanol capacity, produced from sugarcane bagasse and capable of reducing lifecycle emissions by more than 80% compared to fossil-derived pathways.
Expansion of CDMO and CMO Partnerships Increasing Ethanol Consumption
Contract development and manufacturing organizations (CDMOs/CMOs) represent a growing opportunity for pharmaceutical ethanol suppliers. As drug developers outsource formulation, fill–finish, and large-scale blending activities, CDMOs require substantial volumes of high-purity ethanol to maintain continuous operations. This shift is accelerated by rising biologics production, increasing demand for flexible manufacturing capacity, and the need for rapid scalability during product launches. CDMOs prefer ethanol suppliers that offer uninterrupted delivery, validated purity documentation, and global regulatory support, creating opportunities for producers that can guarantee multi-region supply assurance. Growth in sterile manufacturing, aseptic processing, and clinical trial material production further amplifies ethanol demand across the outsourced manufacturing ecosystem. As biopharma pipelines expand, the CDMO sector becomes an increasingly important channel for long-term ethanol supply contracts.
- For instance, Thermo Fisher Scientific’s Patheon CDMO network operates over 40 global manufacturing and development sites, including major sterile fill–finish facilities that rely on validated USP-grade ethanol for formulation and cleaning workflows. Patheon’s aseptic suites can handle batch sizes up to 300,000 vials, which creates steady demand for high-purity ethanol in continuous biopharma production.
Key Challenges
Regulatory Complexity and Compliance Variability Across Regions
Compliance with pharmaceutical-grade ethanol regulations remains a significant challenge due to differing quality standards, impurity limits, and documentation requirements across global markets. Variations in USP, EP, JP, and country-specific guidelines complicate manufacturing, testing, and certification workflows, increasing operational burdens for suppliers. Ethanol producers must maintain validated analytical systems, strict contamination controls, and robust batch traceability to satisfy global audit expectations. Additionally, transportation and storage regulations for flammable solvents require adherence to hazardous material protocols, increasing logistical costs. Manufacturers operating across multiple countries face additional hurdles such as varying excise regulations, purity mandates, and export licensing rules. Failure to align with these complex regulatory frameworks can delay pharmaceutical production timelines, disrupt supply continuity, and reduce market accessibility for ethanol producers.
Supply Chain Volatility and Feedstock Price Fluctuations
Feedstock cost instability particularly for crops used in bioethanol production and petrochemical inputs for synthetic ethanol remains a major challenge affecting price predictability and supply reliability. Raw material shortages, weather disruptions, geopolitical tensions, and energy market fluctuations can significantly impact ethanol production economics. Pharmaceutical manufacturers require consistent quality and uninterrupted supply, but volatility in feedstock markets often creates procurement uncertainty. Additionally, transportation bottlenecks, ethanol storage constraints, and regional disparities in production capacity may lead to periodic shortages. Suppliers must invest in diversified sourcing strategies, advanced inventory systems, and regional production hubs to overcome these issues. For pharmaceutical companies, managing the cost and availability risks associated with ethanol supply remains a persistent operational concern.
Regional Analysis
North America
North America holds the largest share of the pharmaceutical ethanol market, accounting for around 34–36% due to its advanced pharmaceutical manufacturing base, stringent GMP compliance standards, and high adoption of ethanol-based antiseptic and solvent systems. The U.S. leads regional demand, supported by strong production of oral liquid formulations, dermatological solutions, and sterile manufacturing activities. Major CDMOs and multinational drug manufacturers rely on high-purity ethanol grades, strengthening import and domestic refining activities. Regulatory emphasis on purity validation, extensive clinical hygiene needs, and expanding OTC drug production continue to reinforce North America’s leadership position.
Europe
Europe represents approximately 28–30% of the market, driven by robust pharmaceutical exports, strong regulatory frameworks under EP standards, and widespread adoption of ethanol in topical, oral, and parenteral preparations. Germany, the U.K., France, and Italy contribute significantly through their established formulation, API, and contract manufacturing ecosystems. Growth is further supported by increasing demand for ethanol-based disinfectants across clinical facilities, along with rising preference for bio-based ethanol aligned with EU sustainability objectives. Stable supply chains, aggressive quality audits, and expansion of pharmaceutical production clusters ensure Europe maintains a substantial share of global consumption.
Asia-Pacific
Asia-Pacific is the fastest-growing regional market, holding around 22–24% share, supported by expanding pharmaceutical manufacturing in China, India, South Korea, and Japan. Rapid growth in generic drug production, large-scale oral liquid manufacturing, and increasing investments in sterile injectables drive ethanol consumption. Regional CDMOs increasingly utilize high-purity ethanol to meet global regulatory expectations, while rising healthcare expenditure boosts demand for antiseptics and clinical hygiene products. Favorable government policies supporting pharmaceutical exports and expanding biopharmaceutical production capacity strengthen the region’s upward momentum, positioning Asia-Pacific as a key long-term growth hub.
Latin America
Latin America accounts for approximately 6–7% of the pharmaceutical ethanol market, with Brazil and Mexico leading demand due to their developing pharmaceutical sectors and growing consumption of ethanol-based OTC formulations. The region benefits from increasing production of bio-based ethanol, particularly sugarcane-derived grades, which support both domestic use and export opportunities. Rising investments in local drug manufacturing, expanding distribution of antiseptic products, and improving healthcare infrastructure contribute to steady growth. However, regulatory variability and supply chain constraints continue to influence procurement strategies, resulting in moderate but stable market penetration.
Middle East & Africa (MEA)
The Middle East & Africa region holds around 4–5% share, driven primarily by the growth of hospital infrastructure, rising adoption of ethanol-based antiseptics, and increasing pharmaceutical manufacturing activity in GCC countries and South Africa. Demand is concentrated in topical disinfectants, oral solutions, and solvent applications for local formulation plants. Government-led healthcare modernization initiatives, coupled with increased importation of high-purity ethanol grades, support market expansion. Despite promising growth potential, the region faces challenges related to limited production capacity, high reliance on imports, and fluctuations in regulatory requirements across markets.
Market Segmentations:
By Source
- Synthetic Ethanol
- Bio-based Ethanol
By Application
- Oral Formulations
- Topical Formulations
- Parenteral Formulations
- Active Pharmaceutical Ingredients (APIs)
By Geography
- North America
- U.S.
- Canada
- Mexico
- Europe
- Germany
- France
- U.K.
- Italy
- Spain
- Rest of Europe
- Asia Pacific
- China
- Japan
- India
- South Korea
- South-east Asia
- Rest of Asia Pacific
- Latin America
- Brazil
- Argentina
- Rest of Latin America
- Middle East & Africa
- GCC Countries
- South Africa
- Rest of the Middle East and Africa
Competitive Landscape
The competitive landscape of the pharmaceutical ethanol market is characterized by a mix of global producers, regional distilleries, and specialized suppliers focused on high-purity, GMP-compliant grades. Leading companies compete on purification capability, solvent consistency, regulatory certifications, and secure global distribution networks. Players with advanced distillation technologies, validated impurity control systems, and strong documentation practices such as USP, EP, and JP compliance maintain a clear advantage in supplying ethanol for oral formulations, topical antiseptics, and sterile manufacturing. Strategic partnerships with CDMOs, pharmaceutical manufacturers, and hospital procurement channels further strengthen market positioning. Additionally, bio-based ethanol producers increasingly gain traction as sustainability commitments influence purchasing decisions across Europe and North America. Market dynamics also depend on pricing stability, supply chain reliability, and adherence to stringent hazardous material handling regulations. As the pharmaceutical sector expands worldwide, leading suppliers continue investing in capacity upgrades, automated quality testing, and regional distribution hubs to maintain competitiveness.
Key Player Analysis
- Raízen (Cosan S.A.)
- Greenfield Global Inc.
- Grain Processing Corporation
- Wilmar International Limited
- Cristal Union
- Univar Solutions Inc.
- Archer Daniels Midland Company
- MGP Ingredients, Inc.
- Cargill, Incorporated
- Roquette Frères
Recent Developments
- In September 2025, Greenfield Global Inc. launched a new distribution hub under Greenfield Global UK Limited establishing local inventory and delivery capabilities across the UK to supply 99.9% high-purity grain-derived alcohol, specialty alcohols and GMP-grade solvents to pharmaceutical, biotech and life-science companies.
- In May 2024 at the Vitafoods Europe trade fair, Roquette launched LYCAGEL® Flex, a new hydroxypropyl pea starch premix designed for nutraceutical and pharmaceutical soft capsules, offering plasticizer-free customization for improved quality, stability, and performance.
- In May 2024, Grain Processing Corporation received the 2023 Pinnacle Award, recognizing its performance as a key supplier of high-purity alcohols used in pharmaceuticals, nutraceuticals, and personal care applications, reinforcing its role as a reliable source of USP-grade ethyl alcohol.
Report Coverage
The research report offers an in-depth analysis based on Source, Application and Geography. It details leading market players, providing an overview of their business, product offerings, investments, revenue streams, and key applications. Additionally, the report includes insights into the competitive environment, SWOT analysis, current market trends, as well as the primary drivers and constraints. Furthermore, it discusses various factors that have driven market expansion in recent years. The report also explores market dynamics, regulatory scenarios, and technological advancements that are shaping the industry. It assesses the impact of external factors and global economic changes on market growth. Lastly, it provides strategic recommendations for new entrants and established companies to navigate the complexities of the market.
Future Outlook
- Demand for high-purity pharmaceutical ethanol will continue rising as manufacturers expand production of oral liquids, topical formulations, and sterile preparations.
- Adoption of bio-based ethanol will accelerate as pharmaceutical companies strengthen sustainability and low-carbon procurement strategies.
- CDMOs will increasingly drive ethanol consumption as outsourcing of formulation and fill–finish operations grows globally.
- Investments in advanced distillation and impurity-control technologies will improve quality consistency and regulatory compliance.
- Ethanol-based antiseptic and hygiene products will see sustained demand due to ongoing clinical infection-control priorities.
- Regional production hubs in Asia-Pacific will expand capacity to support growing generic and biologics manufacturing.
- Supply chain resilience measures will strengthen as companies diversify feedstock sources and storage infrastructure.
- Regulatory alignment across major markets will become more important, pushing suppliers to enhance documentation and quality management systems.
- Price stability will remain a strategic focus as feedstock volatility influences procurement decisions.
- Long-term contracts between ethanol producers and pharmaceutical manufacturers will become more common to secure uninterrupted high-purity supply.
Request a Free Sample
Fill in your details and we'll send you a free sample report.
- Sample data tables & charts
- Research methodology
Need a Custom Version of This Report?
Tailor the scope, geography, or segments to your exact requirements.
- Custom geography or segment scope
- Direct access to our analyst team
Frequently Asked Questions
What is the current market size for the Pharmaceutical Ethanol market, and what is its projected size in 2032?
At what Compound Annual Growth Rate is the Pharmaceutical Ethanol market projected to grow between 2024 and 2032?
Which Pharmaceutical Ethanol segment held the largest share in 2024?
What are the primary factors fueling the growth of the Pharmaceutical Ethanol market?
Who are the leading companies in the Pharmaceutical Ethanol market?
Which region commanded the largest share of the Pharmaceutical Ethanol market in 2024?
Table of Content
Chapter 1. Report Introduction
- 1.1 Report Description & Purpose
- 1.1.1 Report Title & Market Definition
- 1.1.2 Unique Selling Propositions (USP) & Key Differentiators
- 1.1.3 Value Proposition for Stakeholders
- 1.2 Research Objectives
- 1.2.1 Market Sizing Objectives (Volume & Revenue)
- 1.2.2 Segmentation Objectives
- 1.2.3 Competitive Intelligence Objectives
- 1.2.4 Forecast & Scenario Objectives
- 1.3 Report Scope
- 1.3.1 Pharmaceutical Ethanol Scope – Types & Subtypes Covered
- 1.3.2 Geographic Scope – Regions & Countries Covered
- 1.3.3 Historical Period, Base Year & Forecast Period (2024; forecast to 2032)
- 1.3.4 Inclusions & Exclusions
- 1.4 HS Code & Classification Framework
- 1.5 Currency, Units & Pricing Basis
- 1.6 Target Stakeholders
- 1.7 Limitations & Assumptions
Chapter 2. Executive Summary
- 2.1 Global Pharmaceutical Ethanol Market Snapshot
- 2.1.1 Market Size – Historical (2024) & Forecast (2024-2032) (2024: USD 1,897.5 million → 2032: USD 3,309.33 million)
- 2.1.2 Volume & Revenue – Global Totals
- 2.1.3 Key Market Highlights – Top Five Facts
- 2.2 Pharmaceutical Ethanol Market Segmentation Snapshot
- 2.2.1 Market Split by Region – 2024 vs. 2032
- 2.3 Competitive Snapshot
- 2.3.1 Top 10 Players by Revenue Share – 2024
- 2.3.2 Top 10 Players by Volume Share – 2024
- 2.3.3 Recent Strategic Developments (18-Month Summary)
- 2.4 Key Investment Highlights & Strategic Conclusions
Chapter 3. Pharmaceutical Ethanol Market Dynamics & Industry Analysis
- 3.1 Market Overview & Context
- 3.1.1 Pharmaceutical Ethanol Market Position in the Broader Automotive Value Chain
- 3.1.2 OEM vs. Replacement Market Dynamics
- 3.1.3 Market Maturity & Development Stage by Region
- 3.2 Pharmaceutical Ethanol Market Drivers
- 3.3 Pharmaceutical Ethanol Market Restraints & Challenges
- 3.4 Pharmaceutical Ethanol Market Opportunities
- 3.5 Porter's Five Forces Analysis
- 3.5.1 Threat of New Entrants
- 3.5.2 Bargaining Power of Suppliers
- 3.5.3 Bargaining Power of Buyers
- 3.5.4 Threat of Substitutes
- 3.5.5 Competitive Rivalry – Intensity Assessment
- 3.6 Pharmaceutical Ethanol Value Chain Analysis
- 3.6.1 Upstream – Raw Material/Input Suppliers
- 3.6.1.1 Raw Material/Input 1
- 3.6.1.2 Raw Material/Input 2
- 3.6.1.3 Raw Material/Input 3
- 3.6.2 Midstream – Production/Manufacturing/Service Delivery
- 3.6.2.1 Production/Process Overview
- 3.6.2.2 Key Facility Locations & Capacity by Manufacturer
- 3.6.3 Downstream – Distribution & End Consumer
- 3.6.3.1 Primary Channel – B2B/OEM
- 3.6.3.2 Secondary Channels – Dealer, Retail, Online, Direct
- 3.6.4 Value Chain Profitability Analysis
- 3.6.1 Upstream – Raw Material/Input Suppliers
- 3.7 PESTEL Analysis
- 3.7.1 Political Factors
- 3.7.2 Economic Factors
- 3.7.3 Social Factors
- 3.7.4 Technological Factors
- 3.7.5 Environmental Factors
- 3.7.6 Legal Factors
- 3.8 Pharmaceutical Ethanol Supply Chain Analysis
- 3.8.1 Raw Material/Input Supply Risk Assessment
- 3.8.2 Manufacturing Concentration Risk (Geographic Exposure)
- 3.8.3 Trade Disruption Impact Analysis
- 3.9 Regulatory & Policy Landscape
Note: The regulatory and policy landscape section covers regulations based on their applicability to the market, Pharmaceutical Ethanol category, geography, and scope of the study. Only regulatory frameworks with a material impact on operations, compliance, trade, sustainability, or market access are analyzed in detail.
Chapter 4. Key Investment Pockets & Opportunity Analysis
- 4.1 Pharmaceutical Ethanol Market Attractiveness Analysis
- 4.1.1 By Region – Investment Attractiveness Matrix (Volume × CAGR)
- 4.2 Absolute Revenue Growth Opportunity
- 4.2.1 By Region – Absolute USD Growth Through 2032
- 4.3 Incremental Volume Opportunity
- 4.3.1 By Region – Incremental Volume Through 2032
- 4.3.2 Segment – Incremental Volume
- 4.4 Emerging Submarket Opportunity Deep Dive (Subject to Applicability)
- 4.5 Emerging Market Opportunity Scorecards
- 4.5.1 United States
- 4.5.2 Europe
- 4.5.3 Asia
- 4.5.4 Middle East & Africa
Note: Emerging Market Opportunity Scorecards will be included based on relevance and strategic importance. Regions listed are indicative and may vary depending on data availability and market dynamics.
Chapter 5. Pharmaceutical Ethanol Import-Export Analysis & Trade Flows
- 5.1 Global Trade Overview
- 5.1.1 Global Export Value by Country (2024)
- 5.1.2 Global Export Volume by Country (2024)
- 5.1.3 Global Import Value by Country (2024)
- 5.1.4 Global Import Volume by Country (2024)
- 5.1.5 Net Trade Balance by Country (2024)
- 5.2 Export Analysis – Segment
- 5.2.1 Type 1 (HS Code)
- 5.2.2 Type 2 (HS Code)
- 5.2.3 Type 3 (HS Code)
- 5.2.4 Type 4 (HS Code)
- 5.2.5 Type 5 (HS Code)
- 5.3 Import Analysis – Segment
- 5.3.1 Type 1 (HS Code)
- 5.3.2 Type 2 (HS Code)
- 5.3.3 Type 3 (HS Code)
- 5.3.4 Type 4 (HS Code)
- 5.3.5 Type 5 (HS Code)
- 5.4 Average Unit Trade Prices
- 5.4.1 Average Export Price – Segment & Country
- 5.4.2 Average Import Price – Segment & Source Country
- 5.4.3 Price Trends (2024)
- 5.5 Key Trade Route Analysis
- 5.5.1 Trade Route 1
- 5.5.2 Trade Route 2
- 5.5.3 Trade Route 3
- 5.5.4 Trade Route 4
- 5.5.5 Trade Route 5
- 5.6 Trade Policy Impact Assessment
- 5.6.1 US Anti-Dumping & Section 301 Tariffs
- 5.6.2 EU Customs Union Impact
- 5.6.3 Major Free Trade Agreements
- 5.6.4 USMCA Rules of Origin
Note: Trade policy analysis will be included only where relevant to the Pharmaceutical Ethanol market.
Chapter 6. Competitive Landscape & Company Benchmarking
- 6.1 Pharmaceutical Ethanol Market Concentration & Structure
- 6.1.1 Herfindahl-Hirschman Index (HHI) – vs. 2024
- 6.1.2 Tier 1, Tier 2 & Tier 3 Market Structure
- 6.1.3 Global, Regional & Local Player Dynamics
- 6.2 Pharmaceutical Ethanol Market Share Analysis – 2024
- 6.2.1 Global Revenue Share by Company
- 6.2.2 Global Volume Share by Company
- 6.2.3 Regional Revenue Share
- 6.2.4 Market Share Evolution ( vs. 2024)
- 6.2.5 OEM Segment Share by Company
- 6.2.6 Replacement Segment Share by Company
- 6.3 Production/Delivery Capacity & Facility Analysis
- 6.3.1 Global Installed Capacity
- 6.3.2 Capacity Utilization Rates
- 6.3.3 Production/Output Volume
- 6.3.4 Facility Locations & Capacity Map
- 6.3.5 Planned Capacity Additions
- 6.4 Pharmaceutical Ethanol Competitive Benchmarking Matrix
- 6.4.1 Revenue, Volume, CAGR & Profitability Comparison
- 6.4.2 Channel Revenue Mix
- 6.4.3 Geographic Revenue Exposure
- 6.4.4 R&D Intensity
- 6.4.5 Sustainability Maturity
- 6.5 Strategic Developments in Pharmaceutical Ethanol (Last 24 Months)
- 6.5.1 Mergers, Acquisitions & Divestments
- 6.5.2 New Pharmaceutical Ethanol Launches
- 6.5.3 Facility Expansions
- 6.5.4 Strategic Alliances, Joint Ventures & Partnerships
- 6.5.5 Distribution Expansion & Market Entry
- 6.5.6 Sustainability & ESG Initiatives
- 6.6 Competitive Strategy Mapping
- 6.6.1 Leader, Challenger, Follower & Niche Classification
- 6.6.2 Pricing Strategy Comparison
- 6.6.3 Channel Strategy Matrix
Note: Strategic developments are included based on their materiality and the availability of reliable information.
Chapter 7. Global Pharmaceutical Ethanol Market – By Distribution Channel
- 7.1 Segment Overview
- 7.1.1 Volume & Revenue Split by Channel (2024 & 2032)
- 7.1.2 Channel Mix Evolution (2024-2032)
Chapter 8. Regional Market Analysis – Global Overview
- 8.1 Global Regional Overview
- 8.1.1 Regional Volume Share
- 8.1.2 Regional Revenue Share
- 8.1.3 Regional Volume by Region
- 8.1.4 Regional Revenue by Region
- 8.1.5 Regional Forecast Through 2032
- 8.2 Cross-Regional Segment Analysis
- 8.2.1 By Distribution Channel
- 8.2.2 By Brand/Price Tier
Chapter 9. North America Pharmaceutical Ethanol Market
- 9.1 United States
- 9.2 Canada
- 9.3 Mexico
Chapter 10. Europe Pharmaceutical Ethanol Market
- 10.1 Germany
- 10.2 France
- 10.3 Italy
- 10.4 United Kingdom
- 10.5 Spain
- 10.6 Poland
- 10.7 Russia
- 10.8 Netherlands
- 10.9 Belgium
- 10.10 Sweden
- 10.11 Denmark
- 10.12 Norway
- 10.13 Rest of Europe
Chapter 11. Asia Pacific Pharmaceutical Ethanol Market
- 11.1 China
- 11.2 India
- 11.3 Japan
- 11.4 South Korea
- 11.5 Thailand
- 11.6 Indonesia
- 11.7 Vietnam
- 11.8 Malaysia
- 11.9 Australia
- 11.10 Rest of Asia Pacific
Chapter 12. Latin America Pharmaceutical Ethanol Market
- 12.1 Brazil
- 12.2 Argentina
- 12.3 Colombia
- 12.4 Chile
- 12.5 Rest of Latin America
Chapter 13. Middle East Pharmaceutical Ethanol Market
- 13.1 Saudi Arabia
- 13.2 United Arab Emirates
- 13.3 Turkey
- 13.4 Israel
- 13.5 Iran
- 13.6 Rest of the Middle East
Chapter 14. Africa Pharmaceutical Ethanol Market
- 14.1 South Africa
- 14.2 Egypt
- 14.3 Nigeria
- 14.4 Morocco
- 14.5 Rest of Africa
Chapter 15. Pharmaceutical Ethanol Company Profiles
- 15.1 [Company 01]
- 15.1.1 Company Overview
- 15.1.2 Key Management Personnel
- 15.1.3 Products & Services Portfolio
- 15.1.4 Financial Performance
- 15.1.5 Key Market Focus & Geographic Presence
- 15.1.6 Recent Developments & Strategic Initiatives
Note: The company profile list is preliminary and may change based on research findings, market developments, data availability, and client requirements.
Chapter 16. Appendices
- Appendix A – List of Abbreviations & Acronyms
- Appendix B – Industry Classification Code Reference – Full Series
- Appendix C – Production & Capacity Data Tables
- Appendix D – End-Use & Demand Base Tables
- Appendix E – Consumption & Replacement Rate Assumptions
- Appendix F – ASP Reference Tables
- Appendix G – Manufacturing & Facility Database
- Appendix H – Import-Export Data Tables
- Appendix I – Regulatory Summary Tables
- Appendix J – Primary Research Participant List (Anonymized)
- Appendix K – Primary Research Questionnaire Framework
- Appendix L – Data Sources & Bibliography
- Appendix M – Market Size Divergence & Source Comparison
Chapter 17. Research Methodology
- 17.1 Research Framework & Philosophy
- 17.2 Secondary Research – Sources, Hierarchy & Data Extraction
- 17.3 Data Modeling – Bottom-Up & Top-Down Market Sizing
- 17.4 Primary Research – Stakeholder Framework, LOI & Sample Sizes
- 17.5 Forecast Methodology – Regression, Scenario & Sensitivity Analysis
- 17.6 Quality Control – Four-Layer Validation Framework
- 17.7 Limitations & Standard Assumptions
- 17.8 Disclaimer
