Market Overview
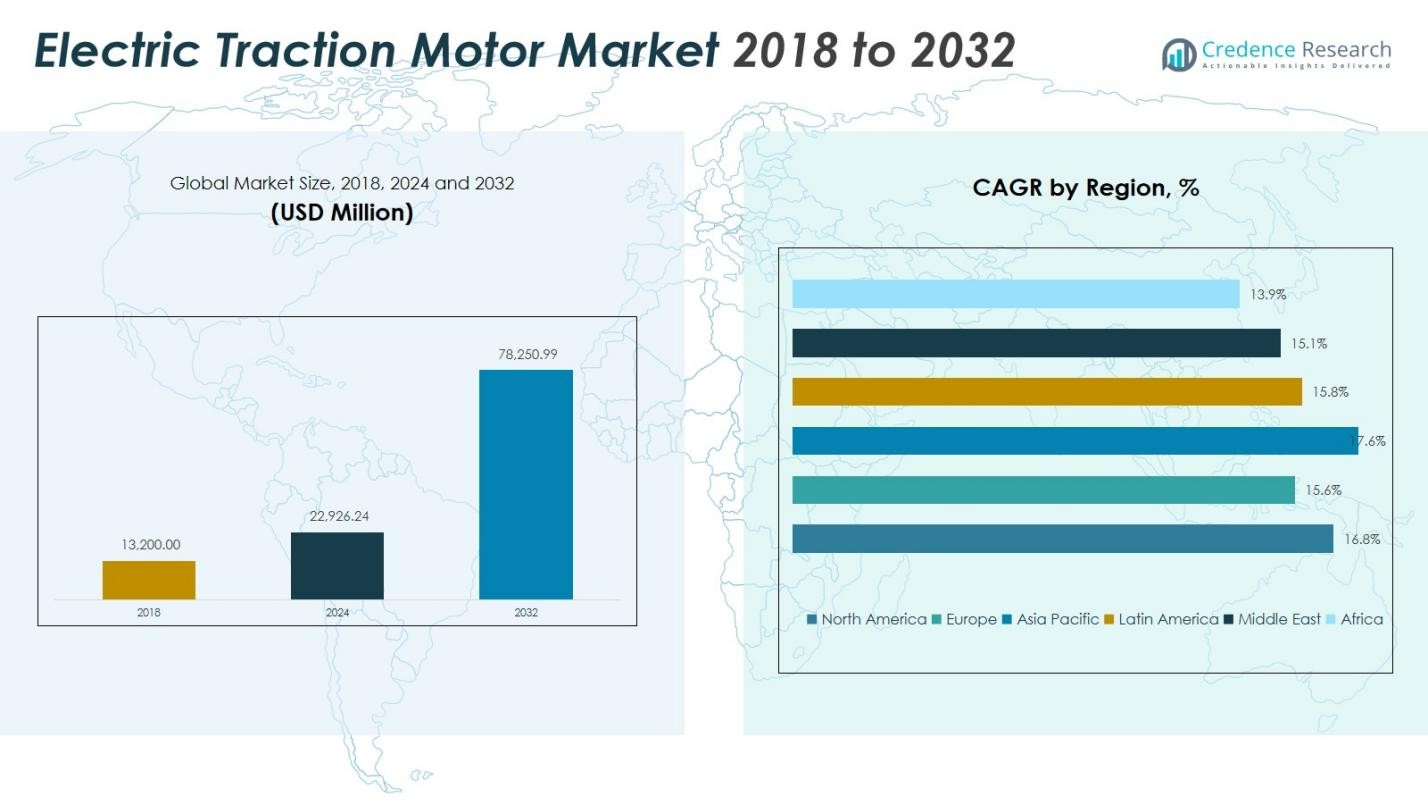
The Electric Vehicle Traction Motor Market size was valued at USD 13,200.00 million in 2018 and increased to USD 22,926.24 million in 2024. It is anticipated to reach USD 78,250.99 million by 2032, growing at a CAGR of 16.77% during the forecast period.
| REPORT ATTRIBUTE |
DETAILS |
| Historical Period |
2020-2023 |
| Base Year |
2024 |
| Forecast Period |
2025-2032 |
| Electric Vehicle Traction Motor Market Size 2024 |
USD 22,926.24 Million |
| Electric Vehicle Traction Motor Market, CAGR |
16.77% |
| Electric Vehicle Traction Motor Market Size 2032 |
USD 78,250.99 Million |
The Electric Vehicle Traction Motor Market is dominated by major players such as Siemens AG, ABB Ltd., Alstom SA, Toshiba Corporation, General Electric Co., Schneider Electric SE, Aisin Corporation, Curtiss-Wright Corporation, CG Power and Industrial Solutions Ltd., and Prodrive Technologies. These companies focus on technological innovation, strategic alliances, and regional expansion to strengthen their global presence. Advanced motor technologies, including permanent magnet synchronous and rare-earth-free motors, remain central to their product strategies. Regionally, Asia Pacific leads the market with an estimated 50% global share, driven by strong EV manufacturing in China, Japan, and South Korea, while North America and Europe collectively account for over 40% due to accelerating electrification and stringent emission regulations.
Access crucial information at unmatched prices!
Request your sample report today & start making informed decisions powered by Credence Research Inc.!
Download Sample
Market Insights
- The Electric Vehicle Traction Motor Market was valued at USD 22,926.24 million in 2024 and is projected to reach USD 78,250.99 million by 2032, growing at a CAGR of 16.77% during the forecast period.
- Rising adoption of electric and hybrid vehicles, coupled with government incentives and emission-reduction mandates, is driving market expansion globally.
- The market is witnessing technological trends such as rare-earth-free motor development, integration of high-efficiency AC traction systems, and compact high-power motor designs.
- Leading players like Siemens AG, ABB Ltd., and Toshiba Corporation dominate the competitive landscape through innovation, partnerships, and regional manufacturing strategies.
- Regionally, Asia Pacific holds around 50% of the market, followed by North America (22%) and Europe (18%), while the AC traction motor segment leads by type with a 65% market share, supported by its superior efficiency and reliability across EV applications.
Market Segmentation Analysis:
By Type
The AC traction motor segment dominates the Electric Vehicle Traction Motor Market, accounting for 65% of total revenue in 2024. Its leadership is driven by superior efficiency, durability, and low maintenance compared to DC counterparts. AC motors are preferred in electric vehicles and modern railway systems due to their ability to handle variable loads and regenerative braking. The DC traction motor segment, holding the remaining 35% share, continues to serve legacy rail systems and cost-sensitive applications but faces gradual replacement as industries transition to high-performance AC technology.
- For instance, the rear-wheel-drive (RWD) variant of Tesla’s Model 3 utilizes an AC permanent magnet synchronous motor (specifically, an Internal Permanent Magnet Synchronous Reluctance Motor, or IPM-SynRM) typically delivering up to 194 kW of power and 340 Nm of torque (figures may vary slightly by model year and market).
By Application
Among applications, the railways segment leads the market with a share of 50%, supported by large-scale railway electrification projects and replacement of diesel locomotives. The electric vehicle segment, capturing nearly 48% share, is expanding rapidly due to rising EV adoption, government incentives, and advances in high-efficiency motor designs. Smaller segments such as elevators, conveyors, and industrial machinery collectively contribute to the remainder of the market, driven by automation, high-rise infrastructure growth, and industrial modernization initiatives emphasizing energy-efficient electric drives.
- For example, BYD’s eBus models are powered by in-wheel traction motors rated at 180 kW, improving urban transport energy efficiency by more than 20 MWh annually per fleet.
By Vehicle Type
Within vehicle types, plug-in hybrid electric vehicles (PHEVs) represent the dominant category, accounting for 36% market share. Their growth is fueled by consumer preference for hybrid flexibility and manufacturer efforts to meet emission targets without full EV dependence. Mild hybrid vehicles (MHEVs) are gaining traction due to cost-effective 48V systems that enhance fuel efficiency, while full hybrid electric vehicles (FHEVs) maintain steady demand in markets with limited charging infrastructure. Collectively, these hybrid categories underscore the progressive shift toward electrified mobility worldwide.
Key Growth Drivers
Rising Adoption of Electric Vehicles (EVs)
The accelerating global shift toward electric mobility is a primary driver of the Electric Vehicle Traction Motor Market. Increasing government incentives, stricter emission norms, and expansion of charging infrastructure are spurring EV adoption across passenger and commercial segments. Automakers are integrating high-efficiency traction motors to enhance performance and driving range. The growing demand for battery electric and hybrid vehicles, particularly in markets like China, Europe, and the United States, continues to strengthen traction motor deployment in next-generation electric drivetrains.
- For instance, Magna International introduced a next-generation 800V eDrive traction motor system in 2024 that delivers 250 kW of power and 5,000 Nm of axle torque, achieving up to 93% efficiency during real-world driving conditions.
Technological Advancements in Motor Efficiency
Continuous advancements in motor design, materials, and control technologies are boosting the efficiency and reliability of traction motors. Innovations such as permanent magnet synchronous motors (PMSMs), silicon carbide inverters, and lightweight motor housings are enabling superior torque density and thermal management. These improvements not only extend vehicle range but also lower overall system weight and energy consumption. Manufacturers are increasingly adopting advanced simulation and AI-based design tools to optimize motor performance, fostering sustainable and cost-effective EV production.
- For instance, Toyota’s fifth-generation hybrid system in the Prius integrates a compact 83 kW PMSM motor with a redesigned stator, improving torque density by 20% while reducing rare earth use.
Expansion of Hybrid and Plug-in Hybrid Vehicle Segment
The growing popularity of hybrid and plug-in hybrid vehicles serves as a key growth catalyst for the traction motor market. These vehicles employ multiple motors to enhance fuel efficiency, regenerative braking, and acceleration response. Governments promoting transitional technologies between internal combustion and fully electric powertrains are supporting hybrid vehicle expansion. As automakers aim to balance environmental goals with consumer convenience, traction motor demand within hybrid architectures continues to rise, reinforcing market stability during the ongoing electrification transition.
Key Trends & Opportunities
Integration of Rare-Earth-Free Motor Technologies
A notable trend shaping the market is the shift toward rare-earth-free traction motors to mitigate material cost volatility and supply chain risks. Manufacturers are developing induction and switched reluctance motors as sustainable alternatives to permanent magnet systems. These technologies reduce dependence on rare-earth materials like neodymium and dysprosium, which face price fluctuations and geopolitical supply constraints. The push for rare-earth-free solutions presents a major opportunity for innovation, aligning with global sustainability initiatives and lowering production costs for automakers.
- For instance, Renault’s Mégane E-Tech Electric uses a wound rotor motor rated at 160 kW, eliminating the need for permanent magnets and reducing material costs by several hundred euros per unit.
Growth in High-Power and Compact Motor Solutions
The market is witnessing increasing demand for high-power, compact traction motors capable of delivering enhanced torque and efficiency within smaller footprints. Advances in thermal management, integrated motor-inverter systems, and additive manufacturing are enabling compact designs suitable for diverse EV platforms. This trend supports lightweight vehicle construction and improved energy utilization, directly contributing to extended driving ranges. As electric vehicle architectures evolve, compact high-power motors are becoming essential to meet performance expectations and design flexibility in modern EVs.
- For instance, Mercedes-Benz’s Vision EQXX concept incorporates a 150 kW electric motor with an integrated inverter weighing under 90 kg, enabling over 1,000 km range per charge through optimized energy efficiency.
Key Challenges
High Production and Material Costs
One of the major challenges in the Electric Vehicle Traction Motor Market is the high production cost driven by expensive raw materials and advanced manufacturing processes. The reliance on rare-earth magnets and precision-engineered components elevates material expenses, particularly for high-performance motors. Additionally, the need for specialized cooling systems and electronic controls increases overall system cost. These factors can limit affordability for end-users and restrict mass-market adoption, compelling manufacturers to invest in cost optimization and material innovation strategies.
Thermal Management and Efficiency Limitations
Effective thermal management remains a significant engineering challenge in traction motor design. High operating temperatures can reduce motor lifespan, affect efficiency, and lead to performance degradation under heavy load conditions. While liquid cooling and advanced insulation systems mitigate these issues, they add complexity and weight. Achieving optimal balance between cooling efficiency, system reliability, and compactness continues to be a key technical hurdle. Addressing these challenges is critical for maintaining long-term motor performance and ensuring sustainable EV deployment at scale.
Regional Analysis
North America
The North America Electric Vehicle Traction Motor Market was valued at USD 3,016.20 million in 2018 and grew to USD 5,137.63 million in 2024. It is projected to reach USD 17,497.06 million by 2032, expanding at a CAGR of 16.8%. The region holds a significant 22% market share globally, driven by strong EV adoption in the United States and Canada, coupled with government incentives and emission-reduction targets. Growing investments in EV infrastructure and leading OEM initiatives toward electrification continue to accelerate traction motor demand across passenger and commercial vehicle segments.
Europe
The Europe Electric Vehicle Traction Motor Market accounted for USD 2,435.40 million in 2018 and increased to USD 3,995.42 million in 2024, projected to reach USD 12,539.93 million by 2032 at a CAGR of 15.6%. With a global market share of 18%, Europe’s growth is driven by stringent emission regulations, rapid electrification in Germany, France, and the UK, and strong government-backed incentives for EV manufacturing. The presence of key automotive players and advancements in rare-earth-free motor technologies further bolster market expansion across passenger cars and public transportation systems.
Asia Pacific
Asia Pacific dominates the Electric Vehicle Traction Motor Market, holding 50% of global share. The market was valued at USD 6,138.00 million in 2018 and expanded to USD 10,909.36 million in 2024, projected to reach USD 39,305.54 million by 2032 at the highest CAGR of 17.6%. Rapid EV production growth in China, Japan, and South Korea, supported by large-scale investments in motor manufacturing and battery technology, drives this dominance. Government-led electrification programs, extensive charging infrastructure, and competitive pricing from regional suppliers continue to strengthen Asia Pacific’s leadership in the global traction motor landscape.
Latin America
The Latin America Electric Vehicle Traction Motor Market stood at USD 904.20 million in 2018 and reached USD 1,556.46 million in 2024, expected to achieve USD 4,958.76 million by 2032 at a CAGR of 15.8%. Holding 6% global share, the region is witnessing increasing EV penetration led by Brazil, Mexico, and Chile. Government incentives, coupled with private sector investments in e-mobility infrastructure, are propelling market development. Expansion of local manufacturing capabilities and growing demand for hybrid and plug-in vehicles are creating significant opportunities for traction motor suppliers in Latin America.
Middle East
The Middle East Electric Vehicle Traction Motor Market was valued at USD 455.40 million in 2018 and grew to USD 735.78 million in 2024. It is anticipated to reach USD 2,238.41 million by 2032, registering a CAGR of 15.1% and capturing 3.5% market share. Market growth is driven by rising EV adoption in Gulf Cooperation Council (GCC) countries, supported by green mobility initiatives and diversification efforts in line with national sustainability goals. Increasing infrastructure investments and partnerships with global EV manufacturers are expected to boost the region’s adoption of advanced traction motor systems.
Africa
The Africa Electric Vehicle Traction Motor Market was valued at USD 250.80 million in 2018, reaching USD 591.59 million in 2024, and is projected to grow to USD 1,711.29 million by 2032 at a CAGR of 13.9%. The region holds a modest 2.5% share of the global market but exhibits gradual growth driven by early EV adoption in South Africa, Egypt, and Morocco. Supportive government policies and increasing interest from international automakers in local assembly initiatives are fostering traction motor demand. Infrastructure limitations remain a challenge, but ongoing electrification efforts indicate long-term potential for market expansion.
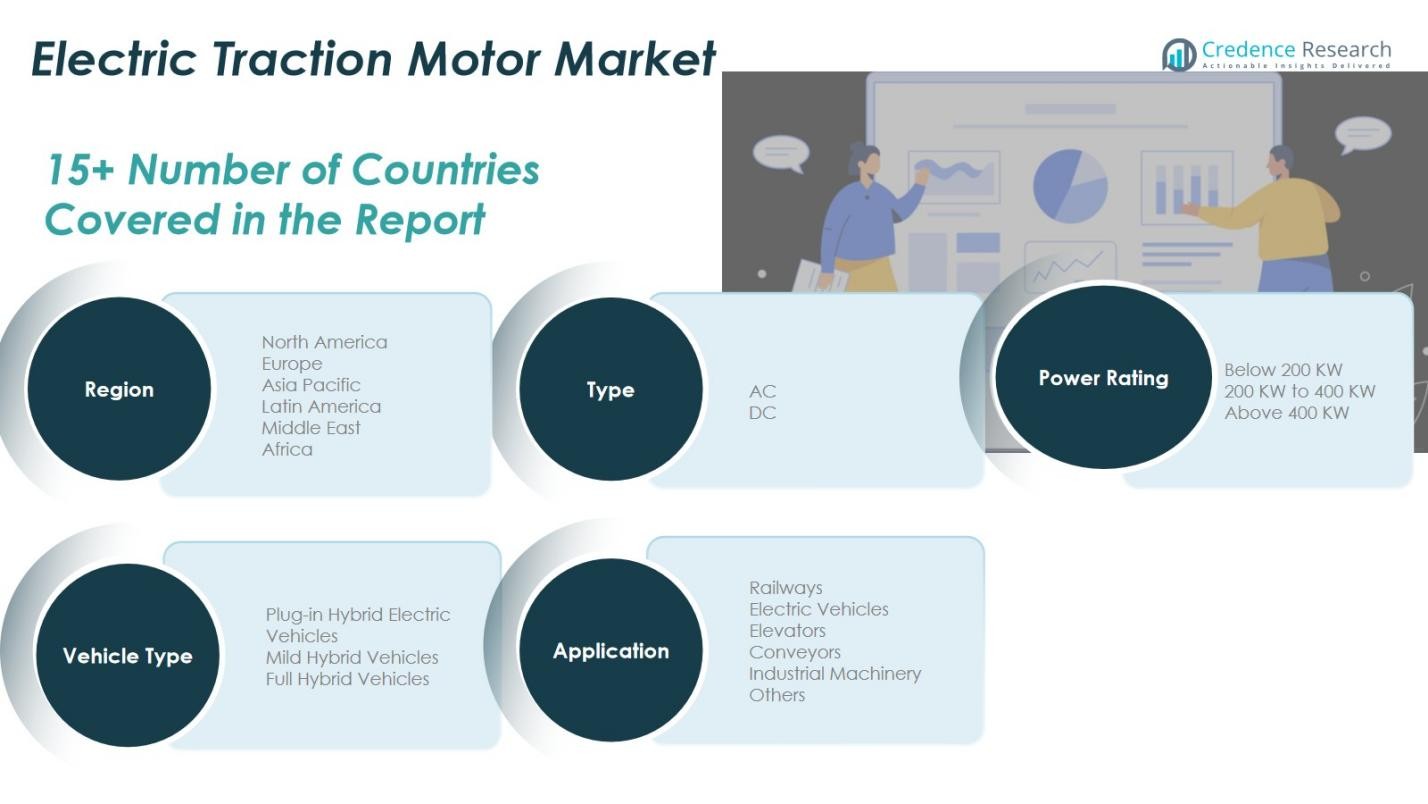
Market Segmentations:
By Type
- AC Traction Motors
- DC Traction Motors
By Application
- Railways
- Electric Vehicles
- Elevators
- Conveyors
- Industrial Machinery
- Others
By Vehicle Type
- Plug-in Hybrid Electric Vehicles (PHEV)
- Mild Hybrid Vehicles (MHEV)
- Full Hybrid Vehicles (FHEV)
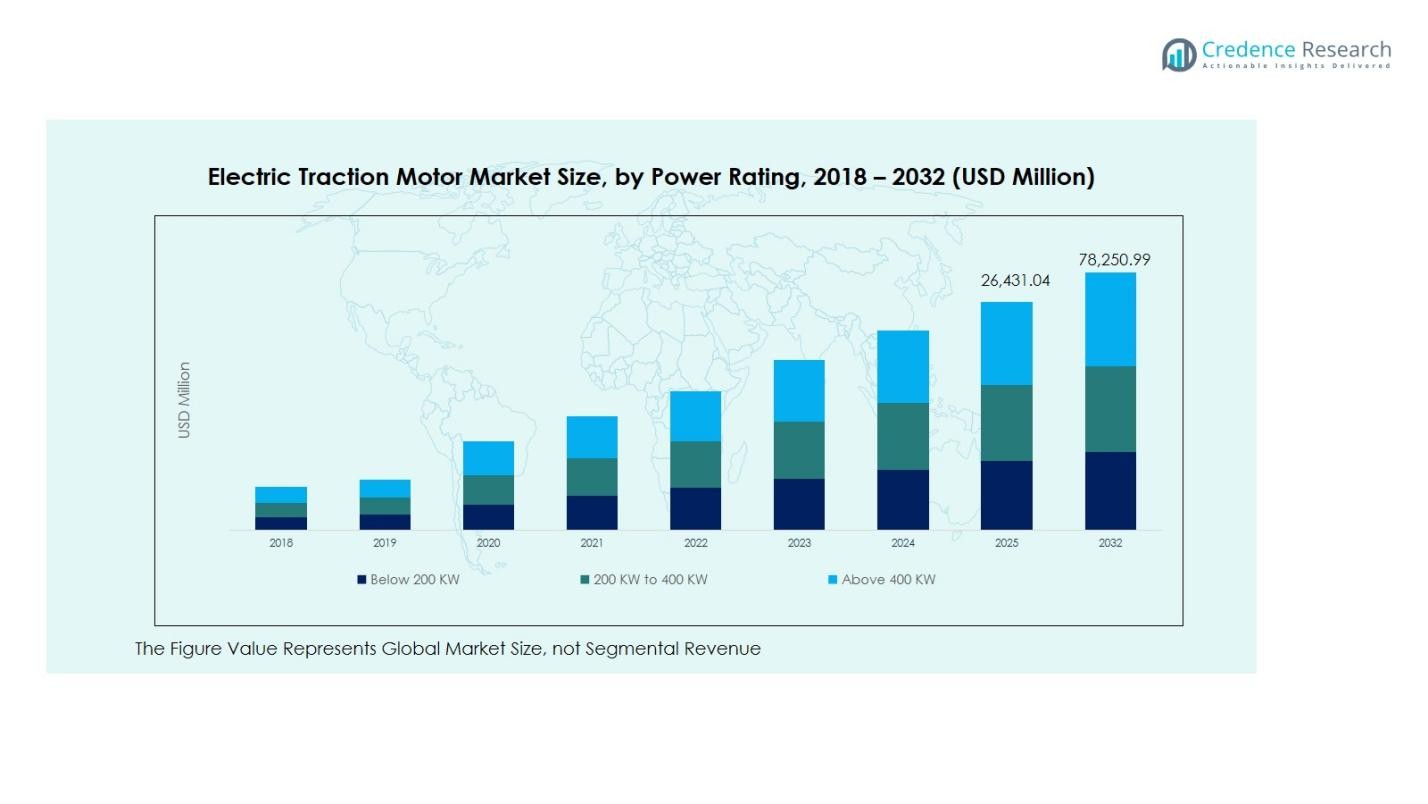
By Power Rating
- Below 200 KW
- 200 KW to 400 KW
- Above 400 KW
By Region
- North America
- Europe
- Germany
- France
- U.K.
- Italy
- Spain
- Rest of Europe
- Asia Pacific
- China
- Japan
- India
- South Korea
- South-east Asia
- Rest of Asia Pacific
- Latin America
- Brazil
- Argentina
- Rest of Latin America
- Middle East & Africa
- GCC Countries
- South Africa
- Rest of the Middle East and Africa
Competitive Landscape
The competitive landscape of the Electric Vehicle Traction Motor Market is characterized by the presence of leading global players such as Siemens AG, ABB Ltd., Alstom SA, Toshiba Corporation, General Electric Co., Schneider Electric SE, Aisin Corporation, Curtiss-Wright Corporation, CG Power and Industrial Solutions Ltd., and Prodrive Technologies. These companies compete through technological innovation, product diversification, and strategic partnerships with automakers to enhance performance and energy efficiency. The market is witnessing increased investment in permanent magnet synchronous motor (PMSM) technology, lightweight materials, and integrated motor–inverter systems. Major players are also expanding regional manufacturing footprints to reduce supply chain costs and meet growing EV demand across Asia Pacific and Europe. Additionally, the development of rare-earth-free motors and advanced cooling systems highlights the industry’s shift toward sustainability and cost efficiency. Continuous R&D and collaboration with OEMs remain critical strategies to strengthen competitive positioning and capture emerging opportunities in the rapidly evolving traction motor segment.
Shape Your Report to Specific Countries or Regions & Enjoy 30% Off!
Key Player Analysis
Recent Developments
- In May 2025, Nidec expanded its global footprint by launching a high-capacity auto-winding AC motor production line at its Mexico facility to enhance traction motor supply for electric vehicles.
- In August 2025, Uno Minda Limited announced plans to acquire the stake of Buehler Motor GmbH in their joint venture focused on developing traction motors for electric two- and three-wheelers in India.
- In July 2025, NXP Semiconductors and VEPCO Technologies Inc entered a strategic partnership to deliver the “EV Traction Inverter Gen 3” control reference design, accelerating development of high-performance motor control systems.
- In January 2025, Minda Corporation Ltd announced its plan to acquire 49 % of Flash Electronics Pvt Ltd for ₹1,372 crore cash, aiming to bolster its traction-motor and motor-controller portfolio in the EV ecosystem.
Report Coverage
The research report offers an in-depth analysis based on Type, Application, Vehicle Type, Power Rating and Region. It details leading market players, providing an overview of their business, product offerings, investments, revenue streams, and key applications. Additionally, the report includes insights into the competitive environment, SWOT analysis, current market trends, as well as the primary drivers and constraints. Furthermore, it discusses various factors that have driven market expansion in recent years. The report also explores market dynamics, regulatory scenarios, and technological advancements that are shaping the industry. It assesses the impact of external factors and global economic changes on market growth. Lastly, it provides strategic recommendations for new entrants and established companies to navigate the complexities of the market.
Future Outlook
- The market will witness robust growth driven by the accelerating global adoption of electric and hybrid vehicles.
- Advancements in motor efficiency and compact design will enhance vehicle performance and range.
- Permanent magnet and rare-earth-free motor technologies will gain wider adoption to reduce material dependency.
- Asia Pacific will continue to dominate production and consumption due to strong EV manufacturing ecosystems.
- Increasing government incentives and zero-emission policies will further boost traction motor demand.
- Integration of smart control systems and IoT-enabled monitoring will improve motor reliability and efficiency.
- Strategic collaborations between motor manufacturers and automotive OEMs will strengthen innovation pipelines.
- Expanding infrastructure for EV charging will indirectly accelerate traction motor installations across regions.
- Growing investments in localized manufacturing will reduce production costs and supply chain risks.
- Continuous R&D in lightweight materials and advanced cooling technologies will shape the next generation of traction motors.


