CHAPTER NO. 1 : GENESIS OF THE MARKET
1.1 Market Prelude – Introduction & Scope
1.2 The Big Picture – Objectives & Vision
1.3 Strategic Edge – Unique Value Proposition
1.4 Stakeholder Compass – Key Beneficiaries
CHAPTER NO. 2 : EXECUTIVE LENS
2.1 Pulse of the Industry – Market Snapshot
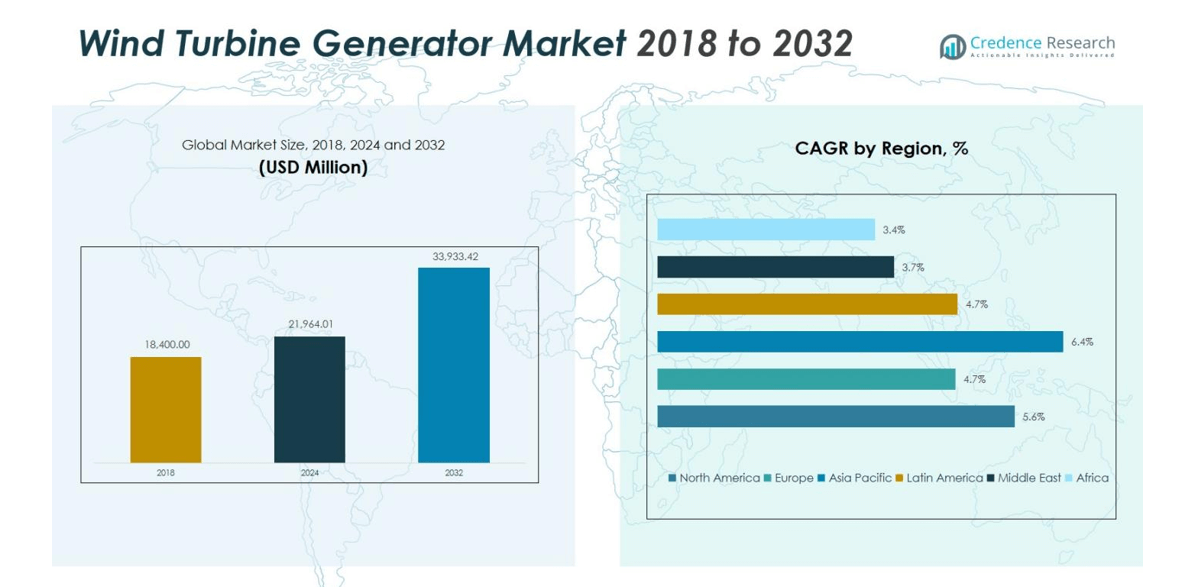
2.2 Growth Arc – Revenue Projections (USD Million)
2.3. Premium Insights – Based on Primary Interviews
CHAPTER NO. 3 : WIND TURBINE GENERATOR MARKET FORCES & INDUSTRY PULSE
3.1 Foundations of Change – Market Overview
3.2 Catalysts of Expansion – Key Market Drivers
3.2.1 Momentum Boosters – Growth Triggers
3.2.2 Innovation Fuel – Disruptive Technologies
3.3 Headwinds & Crosswinds – Market Restraints
3.3.1 Regulatory Tides – Compliance Challenges
3.3.2 Economic Frictions – Inflationary Pressures
3.4 Untapped Horizons – Growth Potential & Opportunities
3.5 Strategic Navigation – Industry Frameworks
3.5.1 Market Equilibrium – Porter’s Five Forces
3.5.2 Ecosystem Dynamics – Value Chain Analysis
3.5.3 Macro Forces – PESTEL Breakdown
3.6 Price Trend Analysis
3.6.1 Regional Price Trend
3.6.2 Price Trend by product
CHAPTER NO. 4 : KEY INVESTMENT EPICENTER
4.1 Regional Goldmines – High-Growth Geographies
4.2 Product Frontiers – Lucrative Product Categories
4.3 Capacity Sweet Spots – Emerging Demand Segments
CHAPTER NO. 5: REVENUE TRAJECTORY & WEALTH MAPPING
5.1 Momentum Metrics – Forecast & Growth Curves
5.2 Regional Revenue Footprint – Market Share Insights
5.3 Segmental Wealth Flow – Generator Type & Capacity Revenue
CHAPTER NO. 6 : TRADE & COMMERCE ANALYSIS
6.1. Import Analysis by Region
6.1.1. Global Wind Turbine Generator Market Import Revenue By Region
6.2. Export Analysis by Region
6.2.1. Global Wind Turbine Generator Market Export Revenue By Region
CHAPTER NO. 7 : COMPETITION ANALYSIS
7.1. Company Market Share Analysis
7.1.1. Global Wind Turbine Generator Market: Company Market Share
7.2. Global Wind Turbine Generator Market Company Revenue Market Share
7.3. Strategic Developments
7.3.1. Acquisitions & Mergers
7.3.2. New Product Launch
7.3.3. Regional Expansion
7.4. Competitive Dashboard
7.5. Company Assessment Metrics, 2024
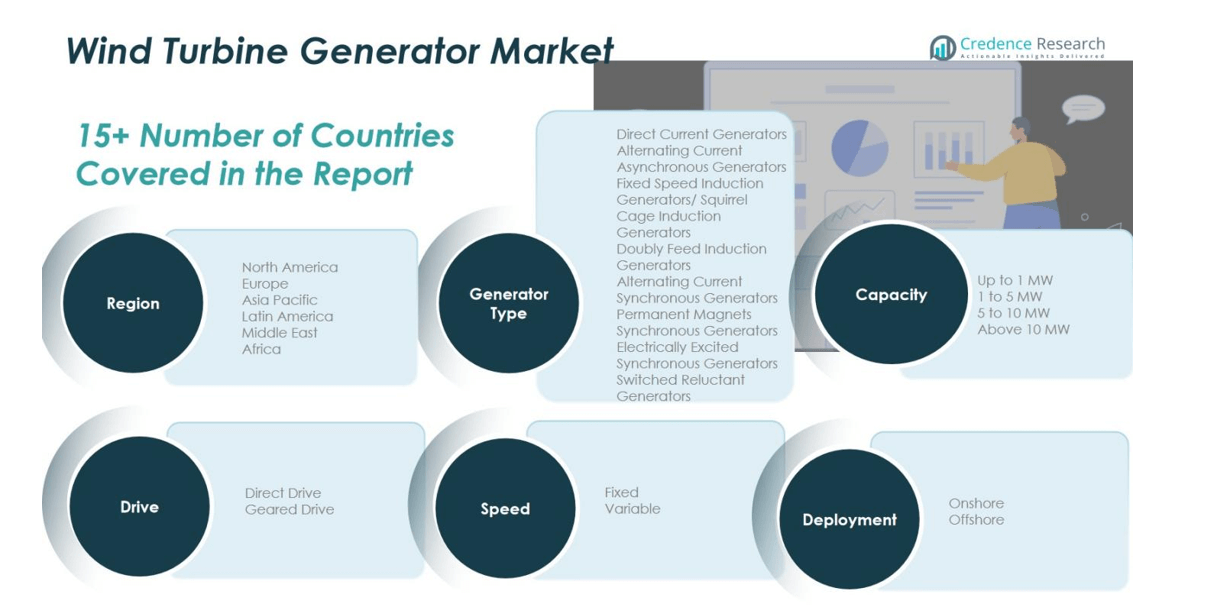
CHAPTER NO. 8 : WIND TURBINE GENERATOR MARKET – BY GENERATOR TYPE SEGMENT ANALYSIS
8.1. Wind Turbine Generator Market Overview by Generator Type Segment
8.1.1. Wind Turbine Generator Market Revenue Share By Generator Type
8.2. Direct Current Generators
8.3. Alternating Current Asynchronous Generators
8.3.1 Fixed Speed Induction Generators/ Squirrel Cage Induction Generators
8.3.2 Doubly Feed Induction Generators
8.4 Alternating Current Synchronous Generators
8.4.1 Permanent Magnets Synchronous Generators
8.4.2 Electrically Excited Synchronous Generators
8.5. Switched Reluctant Generators
CHAPTER NO. 9 : WIND TURBINE GENERATOR MARKET – BY CAPACITY SEGMENT ANALYSIS
9.1. Wind Turbine Generator Market Overview by Capacity Segment
9.1.1. Wind Turbine Generator Market Revenue Share By Capacity
9.2. Up to 1 MW
9.3. 1 to 5 MW
9.4. 5 to 10 MW
9.5. Above 10 MW
CHAPTER NO. 10 : WIND TURBINE GENERATOR MARKET – BY DRIVE SEGMENT ANALYSIS
10.1. Wind Turbine Generator Market Overview by Drive Segment
10.1.1. Wind Turbine Generator Market Revenue Share By Drive
10.2. Direct Drive
10.3. Geared Drive
CHAPTER NO. 11 : WIND TURBINE GENERATOR MARKET – BY SPEED SEGMENT ANALYSIS
11.1. Wind Turbine Generator Market Overview by Speed Segment
11.1.1. Wind Turbine Generator Market Revenue Share By Speed
11.2. Fixed
11.3. Variable
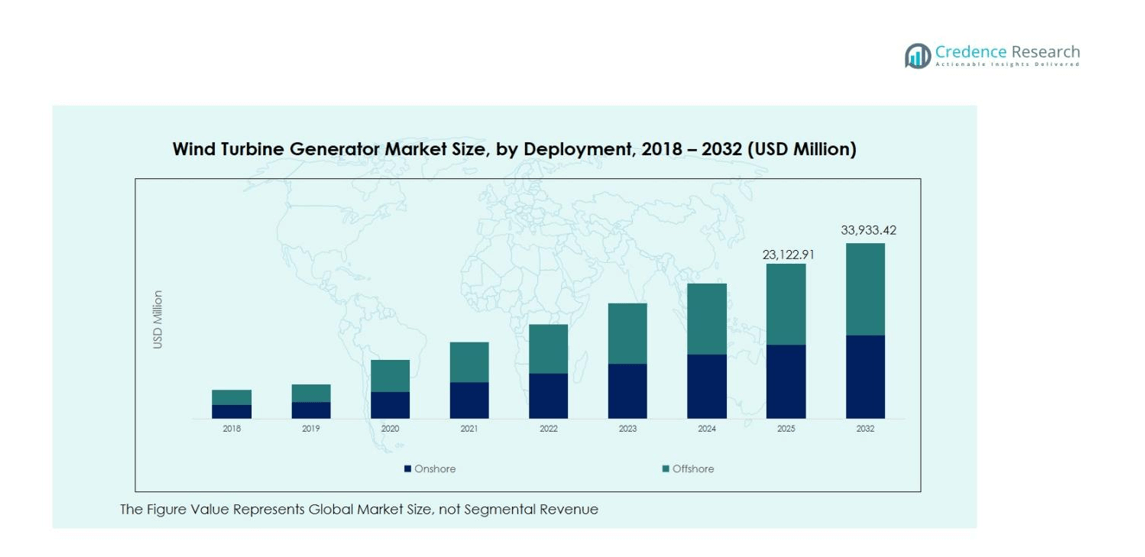
CHAPTER NO. 12 : WIND TURBINE GENERATOR MARKET – BY DEPLOYMENT SEGMENT ANALYSIS
12.1. Wind Turbine Generator Market Overview by Deployment Segment
12.1.1. Wind Turbine Generator Market Revenue Share By Deployment
12.2. Onshore
12.3. Offshore
CHAPTER NO. 13 : WIND TURBINE GENERATOR MARKET – REGIONAL ANALYSIS
13.1. Wind Turbine Generator Market Overview by Region Segment
13.1.1. Global Wind Turbine Generator Market Revenue Share By Region
13.1.2. Regions
13.1.3. Global Wind Turbine Generator Market Revenue By Region
13.1.4. Generator Type
13.1.5. Global Wind Turbine Generator Market Revenue By Generator Type
13.1.6. Capacity
13.1.7. Global Wind Turbine Generator Market Revenue By Capacity
13.1.8. Drive
13.1.9. Global Wind Turbine Generator Market Revenue By Drive
13.1.10. Speed
13.1.12. Global Wind Turbine Generator Market Revenue By Speed
13.1.13. Deployment
13.1.14. Global Wind Turbine Generator Market Revenue By Deployment
CHAPTER NO. 14 : NORTH AMERICA WIND TURBINE GENERATOR MARKET – COUNTRY ANALYSIS
14.1. North America Wind Turbine Generator Market Overview by Country Segment
14.1.1. North America Wind Turbine Generator Market Revenue Share By Region
14.2. North America
14.2.1. North America Wind Turbine Generator Market Revenue By Country
14.2.2. Generator Type
14.2.3. North America Wind Turbine Generator Market Revenue By Generator Type
14.2.4. Capacity
14.2.5. North America Wind Turbine Generator Market Revenue By Capacity
14.2.6. Drive
14.2.7. North America Wind Turbine Generator Market Revenue By Drive
14.2.8. Speed
14.2.9. North America Wind Turbine Generator Market Revenue By Speed
14.2.10. Deployment
14.2.11. North America Wind Turbine Generator Market Revenue By Deployment
14.3. U.S.
14.4. Canada
14.5. Mexico
CHAPTER NO. 15 : EUROPE WIND TURBINE GENERATOR MARKET – COUNTRY ANALYSIS
15.1. Europe Wind Turbine Generator Market Overview by Country Segment
15.1.1. Europe Wind Turbine Generator Market Revenue Share By Region
15.2. Europe
15.2.1. Europe Wind Turbine Generator Market Revenue By Country
15.2.2. Generator Type
15.2.3. Europe Wind Turbine Generator Market Revenue By Generator Type
15.2.4. Capacity
15.2.5. Europe Wind Turbine Generator Market Revenue By Capacity
15.2.6. Drive
15.2.7. Europe Wind Turbine Generator Market Revenue By Drive
15.2.8. Speed
15.2.9. Europe Wind Turbine Generator Market Revenue By Speed
15.2.10. Deployment
15.2.11. Europe Wind Turbine Generator Market Revenue By Deployment
15.3. UK
15.4. France
15.5. Germany
15.6. Italy
15.7. Spain
15.8. Russia
15.9. Rest of Europe
CHAPTER NO. 16 : ASIA PACIFIC WIND TURBINE GENERATOR MARKET – COUNTRY ANALYSIS
16.1. Asia Pacific Wind Turbine Generator Market Overview by Country Segment
16.1.1. Asia Pacific Wind Turbine Generator Market Revenue Share By Region
16.2. Asia Pacific
16.2.1. Asia Pacific Wind Turbine Generator Market Revenue By Country
16.2.2. Generator Type
16.2.3. Asia Pacific Wind Turbine Generator Market Revenue By Generator Type
16.2.4. Capacity
16.2.5. Asia Pacific Wind Turbine Generator Market Revenue By Capacity
16.2.6. Drive
16.2.7. Asia Pacific Wind Turbine Generator Market Revenue By Drive
16.2.8. Speed
16.2.9. Asia Pacific Wind Turbine Generator Market Revenue By Speed
16.2.10. Deployment
16.2.11. Asia Pacific Wind Turbine Generator Market Revenue By Deployment
16.3. China
16.4. Japan
16.5. South Korea
16.6. India
16.7. Australia
16.8. Southeast Asia
16.9. Rest of Asia Pacific
CHAPTER NO. 17 : LATIN AMERICA WIND TURBINE GENERATOR MARKET – COUNTRY ANALYSIS
17.1. Latin America Wind Turbine Generator Market Overview by Country Segment
17.1.1. Latin America Wind Turbine Generator Market Revenue Share By Region
17.2. Latin America
17.2.1. Latin America Wind Turbine Generator Market Revenue By Country
17.2.2. Generator Type
17.2.3. Latin America Wind Turbine Generator Market Revenue By Generator Type
17.2.4. Capacity
17.2.5. Latin America Wind Turbine Generator Market Revenue By Capacity
17.2.6. Drive
17.2.7. Latin America Wind Turbine Generator Market Revenue By Drive
17.2.8. Speed
17.2.9. Latin America Wind Turbine Generator Market Revenue By Speed
17.2.10. Deployment
17.2.11. Latin America Wind Turbine Generator Market Revenue By Deployment
17.3. Brazil
17.4. Argentina
17.5. Rest of Latin America
CHAPTER NO. 18 : MIDDLE EAST WIND TURBINE GENERATOR MARKET – COUNTRY ANALYSIS
18.1. Middle East Wind Turbine Generator Market Overview by Country Segment
18.1.1. Middle East Wind Turbine Generator Market Revenue Share By Region
18.2. Middle East
18.2.1. Middle East Wind Turbine Generator Market Revenue By Country
18.2.2. Generator Type
18.2.3. Middle East Wind Turbine Generator Market Revenue By Generator Type
18.2.4. Capacity
18.2.5. Middle East Wind Turbine Generator Market Revenue By Capacity
18.2.6. Drive
18.2.7. Middle East Wind Turbine Generator Market Revenue By Drive
18.2.8. Speed
18.2.9. Middle East Wind Turbine Generator Market Revenue By Speed
18.2.10. Deployment
18.2.11. Middle East Wind Turbine Generator Market Revenue By Deployment
18.3. GCC Countries
18.4. Israel
18.5. Turkey
18.6. Rest of Middle East
CHAPTER NO. 19 : AFRICA WIND TURBINE GENERATOR MARKET – COUNTRY ANALYSIS
19.1. Africa Wind Turbine Generator Market Overview by Country Segment
19.1.1. Africa Wind Turbine Generator Market Revenue Share By Region
19.2. Africa
19.2.1. Africa Wind Turbine Generator Market Revenue By Country
19.2.2. Generator Type
19.2.3. Africa Wind Turbine Generator Market Revenue By Generator Type
19.2.4. Capacity
19.2.5. Africa Wind Turbine Generator Market Revenue By Capacity
19.2.6. Drive
19.2.7. Africa Wind Turbine Generator Market Revenue By Drive
19.2.8. Speed
19.2.9. Africa Wind Turbine Generator Market Revenue By Speed
19.2.10. Deployment
19.2.11. Africa Wind Turbine Generator Market Revenue By Deployment
19.3. South Africa
19.4. Egypt
19.5. Rest of Africa
CHAPTER NO. 20 : COMPANY PROFILES
20.1. Siemens
20.1.1. Company Overview
20.1.2. Product Portfolio
20.1.3. Financial Overview
20.1.4. Recent Developments
20.1.5. Growth Strategy
20.1.6. SWOT Analysis
20.2. Vestas
20.3. Goldwind
20.4. Mitsubishi
20.5. Bergey Windpower Co.
20.6. CRRC Wind Power Co. Ltd.
20.7. Eocycle Technologies Inc.
20.8. General Electric
20.9. Hyundai Heavy Industries Co. Ltd.
20.10. Ming Yang Wind Power Group Limited.