Market Overview
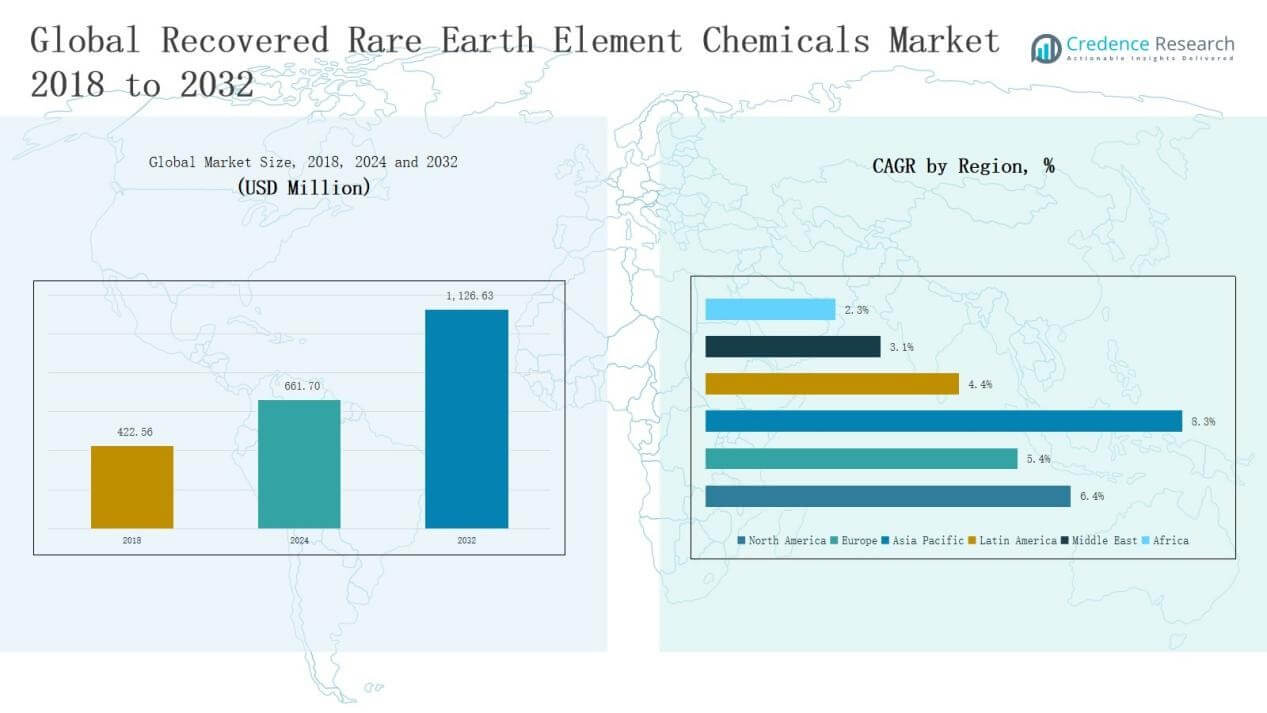
Recovered Rare Earth Element Chemicals Market size was valued at USD 422.56 million in 2018 to USD 661.70 million in 2024 and is anticipated to reach USD 1,126.63 million by 2032, at a CAGR of 6.40% during the forecast period.
| REPORT ATTRIBUTE |
DETAILS |
| Historical Period |
2020-2023 |
| Base Year |
2024 |
| Forecast Period |
2025-2032 |
| Recovered Rare Earth Element Chemicals Market Size 2024 |
USD 661.70 Million |
| Recovered Rare Earth Element Chemicals Market, CAGR |
6.40% |
| Recovered Rare Earth Element Chemicals Market Size 2032 |
USD 1,126.63 Million |
The Recovered Rare Earth Element Chemicals Market is shaped by leading companies including Lynas Rare Earths Ltd., China Northern Rare Earth Group High-Tech Co. Ltd., MP Materials Corp., Iluka Resources Limited, Arafura Rare Earths Ltd., Umicore, and Solvay SA. These players focus on advanced recycling technologies, strategic partnerships, and supply chain resilience to meet rising demand from clean energy, automotive, and electronics industries. Asia Pacific emerged as the dominant region, holding a 41.6% share in 2024, driven by China’s robust recycling infrastructure, strong electronics base, and large-scale renewable energy adoption, reinforcing its position as the global leader.
Market Insights
- The Recovered Rare Earth Element Chemicals Market grew from USD 422.56 million in 2018 to USD 661.70 million in 2024 and is projected at USD 1,126.63 million by 2032, advancing at 40% CAGR.
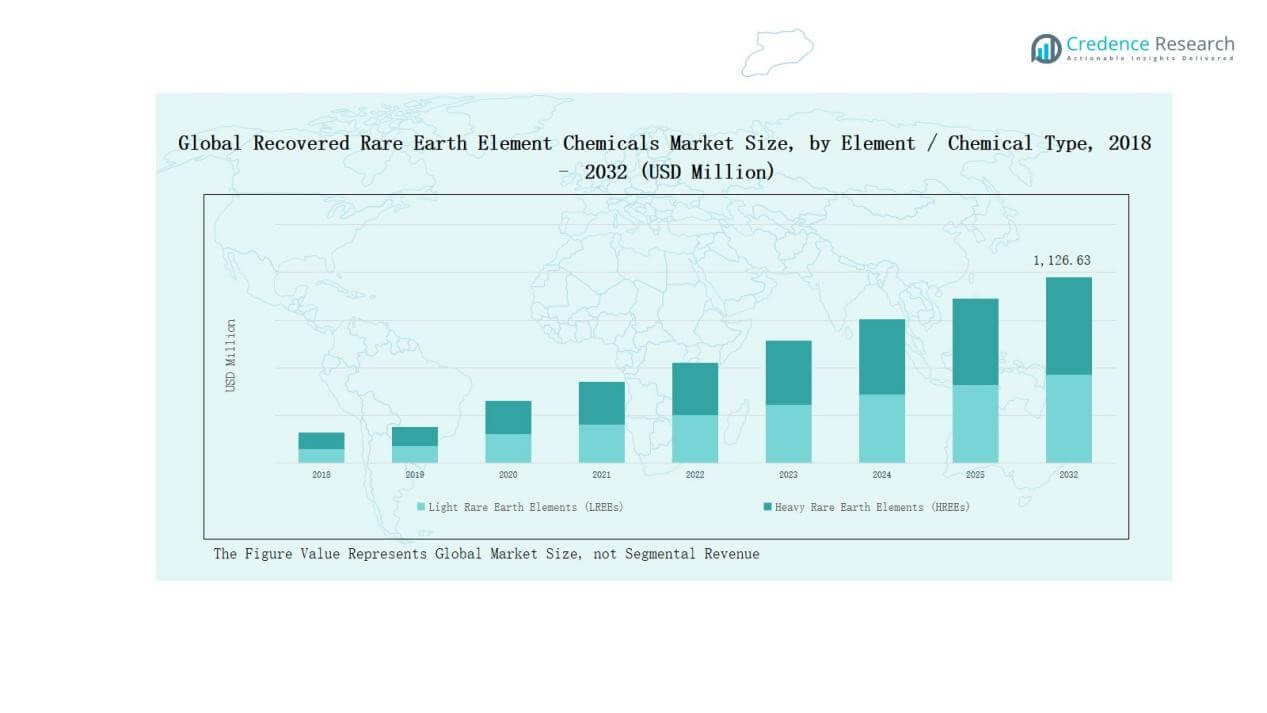
- Light rare earth elements (LREEs) dominated with a 62% share in 2024, led by Neodymium (Nd), widely used in permanent magnets for EV motors, wind turbines, and advanced electronics.
- End-of-life electronics (E-waste) accounted for the largest recovery source with a 38% share in 2024, supported by high REE content in smartphones, hard drives, and display panels.
- Permanent magnets led applications with a 46% share in 2024, driven by rising deployment in renewable energy, hybrid and electric vehicles, and next-generation consumer electronics.
- Asia Pacific held the highest 6% regional share in 2024, with China leading recovery and consumption, supported by robust recycling infrastructure and large-scale clean energy adoption.
Access crucial information at unmatched prices!
Request your sample report today & start making informed decisions powered by Credence Research Inc.!
Download Sample
Market Segment Insights
By Element / Chemical Type
Light rare earth elements (LREEs) dominate the market, accounting for 62% share in 2024. Within this group, Neodymium (Nd) stands out as the leading element due to its critical role in high-performance permanent magnets used in EV motors, wind turbines, and advanced electronics. Demand growth is fueled by rising adoption of clean energy systems and electrification trends, which require large volumes of Nd and Pr compounds. While heavy rare earth elements (HREEs) such as Dysprosium and Terbium are vital for heat-resistant magnets, their smaller volumes and higher costs limit their overall market share compared to LREEs.
For instance, Lynas Rare Earths is expanding its Mt Weld mine in Australia to supply feedstock for its processing facilities in Australia and Malaysia. The company has a target of achieving 10,500 tonnes per year of separated NdPr oxide. The rare earth materials, including NdPr, are used for applications like EV motors and wind turbines.
By Source of Recovery
End-of-life electronics (E-waste) emerged as the dominant recovery source with a 38% share in 2024. This leadership stems from the high concentration of cerium, neodymium, and other valuable rare earths found in discarded consumer electronics, including smartphones, hard drives, and display panels. Growing volumes of global e-waste, coupled with stricter recycling regulations and sustainability initiatives, drive the expansion of this segment. Magnets recovered from industrial applications such as NdFeB and SmCo also represent a strong growth area, as they offer high yield recovery of critical REEs needed for energy transition technologies.
For instance, Hitachi Metals announced advancements in its magnet-recycling technology, allowing the collection and reuse of neodymium and dysprosium from end-of-life hard disk drives.
By Application
Permanent magnets remain the leading application segment, capturing 46% share in 2024. Their dominance is driven by rising demand in wind power generation, hybrid and electric vehicles, and advanced electronic devices. Neodymium-iron-boron (NdFeB) magnets, in particular, account for the largest consumption of recovered rare earths due to their superior strength-to-weight ratio and efficiency. The accelerating shift toward renewable power and electrified mobility ensures consistent growth for this segment, while other applications such as catalysts, phosphors, and metallurgy continue to expand as supporting markets.
 Key Growth Drivers
Rising Demand for Clean Energy and EVs
The transition to clean energy and electric mobility is the primary driver of the recovered rare earth element chemicals market. Neodymium, praseodymium, and dysprosium are critical in manufacturing high-performance magnets for electric vehicle motors and wind turbines. The growing adoption of renewable power projects and the push for carbon-neutral economies are intensifying demand. Recovery and recycling of rare earths help secure supply, reduce environmental impact, and meet the surging needs of the global clean energy sector.
For instance, Noveon Magnetics ramped up its Texas facility towards a production target of 2,000 tons of rare earth permanent magnets annually by 2024 to target supply for electric vehicle and renewable energy applications.
Escalating Global E-Waste Generation
The growing volumes of end-of-life electronics are creating abundant recovery opportunities. Smartphones, laptops, displays, and hard drives contain significant concentrations of neodymium, cerium, and other rare earth elements. Governments are implementing strict regulations to manage e-waste sustainably, driving investments in recycling infrastructure. With global e-waste expected to exceed 70 million tons annually by 2030, recovery from electronics provides both economic and environmental benefits. This segment is projected to remain a critical supply channel for rare earth element recycling.
For instance, in 2023, Apple expanded its recycling program using advanced robot disassembly technology to recover rare earth elements efficiently from returned iPhones.
Supply Chain Security and Resource Independence
Rising concerns over rare earth supply security are pushing countries to strengthen domestic recovery systems. China currently dominates global rare earth production, raising risks of supply disruption and price volatility. Governments in the U.S., EU, Japan, and India are promoting recycling initiatives to reduce reliance on imports. Policies supporting circular economy models and resource efficiency are fostering investments in recovery technologies. Strengthening supply independence through recycling ensures a stable and resilient rare earth supply chain for critical industries.
 Key Trends & Opportunities
Advancements in Recycling Technologies
Innovation in hydrometallurgical and bioleaching processes is improving recovery efficiency from complex waste streams such as red mud, coal fly ash, and industrial by-products. These technologies enable higher yield extraction while lowering environmental impact compared to conventional mining. Companies are investing in scalable solutions to reduce costs and achieve commercial viability. As technology matures, opportunities emerge to expand recovered rare earth supply for industries like EVs, wind power, and electronics, creating strong market growth potential.
For instance, Geomega Resources announced progress on its rare earth recycling demonstration plant in Quebec, with technology focused on hydrometallurgical processes to extract neodymium and dysprosium from industrial waste magnets.
Integration with Circular Economy Models
The market is benefitting from the integration of recovered rare earths into broader circular economy frameworks. Manufacturers and governments are increasingly adopting closed-loop supply chains where rare earths are reused and recycled across multiple product lifecycles. Partnerships between recycling firms and downstream industries such as automotive and electronics are expanding. This shift not only reduces dependency on mining but also enhances sustainability credentials for corporations. The circular economy approach presents a long-term opportunity to stabilize supply and reduce costs.
For instance, BASF partnered with Heraeus in China to apply advanced pyrometallurgy for recovering precious metals, specifically platinum group metals (PGMs) like platinum, palladium, and rhodium, from spent automotive catalysts, thereby promoting circularity and resource efficiency in the automotive sector.
Key Challenges
High Recovery Costs and Complex Processes
Despite technological advances, the recovery of rare earths from secondary sources remains costly and technically complex. Processes such as solvent extraction and hydrometallurgy require high energy input and careful handling of hazardous materials. The variable composition of e-waste and industrial residues adds further complexity. These challenges often make recovery less economically attractive compared to primary mining, limiting large-scale adoption. Achieving cost-effective, scalable recovery remains a major obstacle to market expansion.
Limited Recycling Infrastructure
The market faces constraints due to underdeveloped recycling infrastructure in many regions. Developing countries, which generate a large share of global e-waste, lack adequate collection and processing facilities. Even in advanced economies, the infrastructure is fragmented and insufficient to meet the rising demand for recovered rare earths. This gap creates inefficiencies, reduces recovery rates, and hinders the ability to build resilient supply chains. Expanding global recycling networks is essential for sustainable growth.
Market Volatility and Policy Uncertainty
Price fluctuations in the global rare earth market and inconsistent regulatory frameworks pose risks to investors and recyclers. Policies on e-waste management, environmental compliance, and trade vary widely across regions, creating uncertainty for market participants. Dependence on subsidies or government incentives also makes the sector vulnerable to policy shifts. These factors complicate long-term planning and investment decisions, slowing the scale-up of recovery operations. Stability in regulation and pricing mechanisms is crucial for sustained industry growth.
Regional Analysis
North America
The North America recovered rare earth element chemicals market was valued at USD 120.53 million in 2018, reaching USD 185.74 million in 2024, and is projected to hit USD 317.59 million by 2032, growing at a CAGR of 6.5%. The region accounted for a 25.6% share in 2024. Growth is driven by rising demand for permanent magnets in electric vehicles, wind energy projects, and advanced electronics. Strong government support for recycling infrastructure and supply chain independence further accelerates adoption, with the U.S. leading regional consumption and recovery initiatives.
Europe
Europe’s market size stood at USD 78.27 million in 2018, expanded to USD 115.80 million in 2024, and is expected to reach USD 179.14 million by 2032, registering a CAGR of 5.1%. The region captured a 15.9% share in 2024. Growth is supported by stringent sustainability policies, e-waste recycling mandates, and circular economy initiatives across the EU. Countries like Germany and France are leading adoption due to strong automotive and electronics industries. Demand for rare earth recovery is reinforced by efforts to reduce reliance on imports and strengthen supply security.
Asia Pacific
Asia Pacific dominated the market, valued at USD 186.45 million in 2018, increasing to USD 302.64 million in 2024, and projected at USD 546.42 million by 2032, with a robust CAGR of 7.2%. The region accounted for the largest 41.6% share in 2024. China drives this leadership with advanced recycling infrastructure and high demand from electronics, EVs, and renewable power sectors. Japan, South Korea, and India are also investing in rare earth recovery to support domestic manufacturing. Expanding renewable energy projects and strong industrial bases make Asia Pacific the key growth engine.
Latin America
Latin America’s market was valued at USD 19.91 million in 2018, rose to USD 30.79 million in 2024, and is anticipated to reach USD 46.39 million by 2032, reflecting a CAGR of 4.8%. The region represented a 4.2% share in 2024. Growth is moderate, supported by increasing electronics consumption and gradual adoption of recycling initiatives in Brazil and Argentina. Opportunities lie in developing e-waste management infrastructure and partnerships with global technology firms. However, limited collection systems and policy gaps restrain large-scale recovery, leaving the market in early development compared to major regions.
Middle East
The Middle East market recorded USD 10.66 million in 2018, grew to USD 15.11 million in 2024, and is forecasted to reach USD 21.21 million by 2032, at a CAGR of 3.8%. It accounted for a 2.1% share in 2024. Growth is driven by increasing investments in high-tech industries, particularly in GCC countries, and expanding adoption of renewable energy projects. However, the region lacks a mature recycling infrastructure, with most demand met through imports. Strategic government initiatives could improve local recovery capabilities, positioning the Middle East as a potential emerging market.
Africa
Africa’s market was valued at USD 6.74 million in 2018, increased to USD 11.62 million in 2024, and is projected to reach USD 15.86 million by 2032, expanding at a CAGR of 3.5%. The region held a 1.6% share in 2024. Growth is limited by underdeveloped recycling infrastructure and weak policy enforcement. South Africa leads the market with its mining and industrial base, while other nations are gradually adopting e-waste management frameworks. Despite challenges, rising electronics consumption and international investments in recycling offer long-term opportunities for market expansion.
 Market Segmentations:
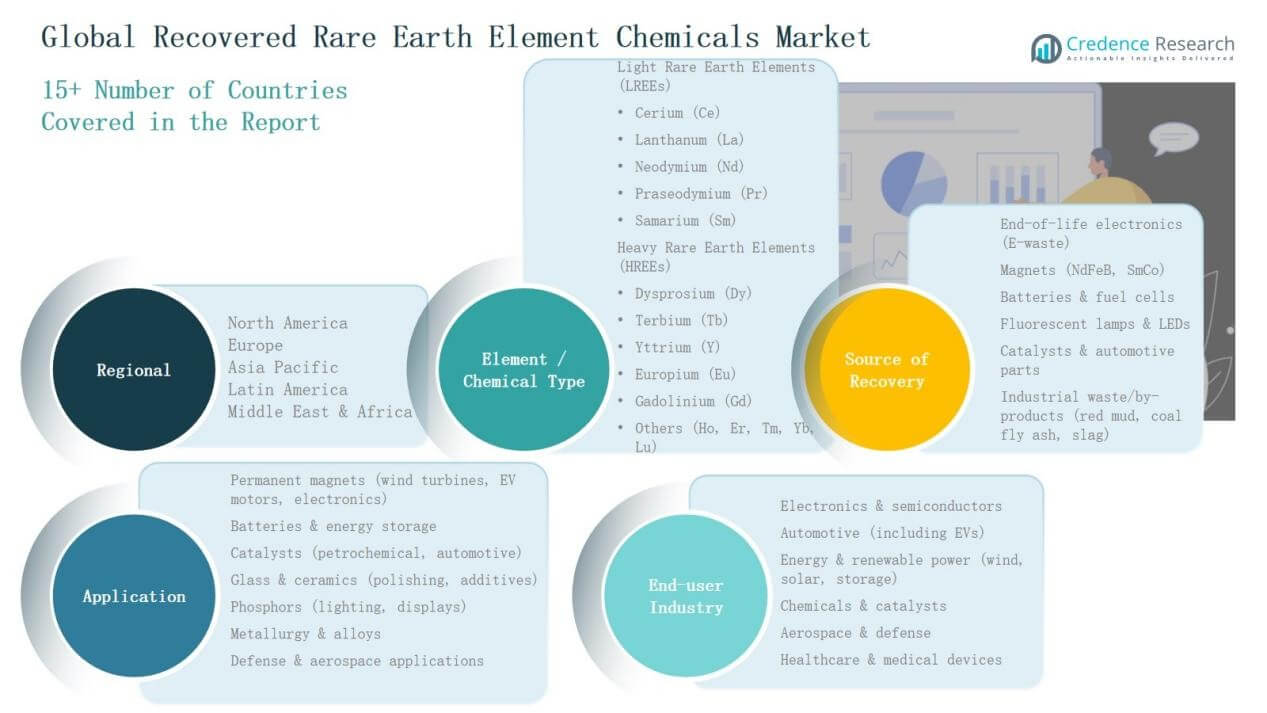
By Element / Chemical Type
Light Rare Earth Elements (LREEs):
- Cerium (Ce)
- Lanthanum (La)
- Neodymium (Nd)
- Praseodymium (Pr)
- Samarium (Sm)
Heavy Rare Earth Elements (HREEs):
- Dysprosium (Dy)
- Terbium (Tb)
- Yttrium (Y)
- Europium (Eu)
- Gadolinium (Gd)
- Others (Holmium, Erbium, Thulium, Ytterbium, Lutetium)
By Source of Recovery
- End-of-life electronics (E-waste)
- Magnets (NdFeB, SmCo)
- Batteries & fuel cells
- Fluorescent lamps & LEDs
- Catalysts & automotive parts
- Industrial waste/by-products (red mud, coal fly ash, slag)
By Application
- Permanent magnets (wind turbines, EV motors, electronics)
- Batteries & energy storage
- Catalysts (petrochemical, automotive)
- Glass & ceramics (polishing, additives)
- Phosphors (lighting, displays)
- Metallurgy & alloys
- Defense & aerospace applications
By End-User Industry
- Electronics & semiconductors
- Automotive (including EVs)
- Energy & renewable power (wind, solar, storage)
- Chemicals & catalysts
- Aerospace & defense
- Healthcare & medical devices
By Region
- North America
- Europe
- Germany
- France
- U.K.
- Italy
- Spain
- Rest of Europe
- Asia Pacific
- China
- Japan
- India
- South Korea
- South-east Asia
- Rest of Asia Pacific
- Latin America
- Brazil
- Argentina
- Rest of Latin America
- Middle East & Africa
- GCC Countries
- South Africa
- Rest of the Middle East and Africa
Competitive Landscape
The competitive landscape of the Recovered Rare Earth Element Chemicals Market is shaped by a mix of established rare earth producers, specialized recyclers, and integrated material companies. Key players such as Lynas Rare Earths Ltd., China Northern Rare Earth Group High-Tech Co. Ltd., MP Materials Corp., Iluka Resources Limited, Arafura Rare Earths Ltd., Umicore, and Solvay SA dominate the space with diversified portfolios and strong regional presence. Companies are focusing on developing advanced recycling technologies, such as hydrometallurgical and bioleaching processes, to improve recovery efficiency from e-waste, magnets, and industrial by-products. Strategic partnerships with automotive, electronics, and renewable energy industries are expanding growth opportunities, ensuring steady demand for recovered elements like neodymium, dysprosium, and terbium. The market remains moderately concentrated, with Chinese firms holding a significant edge in capacity and supply, while Western companies invest heavily in localized recovery to reduce import dependence. Innovation, sustainability commitments, and supply chain resilience continue to drive competition.
Shape Your Report to Specific Countries or Regions & Enjoy 30% Off!
Key Players
Recent Developments
- In August 2025, ReElement Technologies finalized a long-term supply agreement with Vulcan Elements to deliver high-purity rare earth oxides, including Nd, NdPr, and Dy, supporting U.S. magnet production.
- In August 2025, Virginia Tech partnered with Aclara under a memorandum of understanding to strengthen the supply chain for heavy rare earth elements used in permanent magnets.
- In August 2025, Hindustan Zinc Ltd announced efforts to seek global partners for AI and drone-based exploration and extraction of rare earth elements, signaling new technological approaches in the market.
- In August 2025, Principal Mineral Co. Inc. formed a strategic partnership with ReElement Technologies to create a vertically integrated facility for producing high purity rare earth products focusing on recycled and mined sources, boosting US supply chain resilience and defense readiness.
Report Coverage
The research report offers an in-depth analysis based on Element/ Chemical Type, Source of Recovery, Application, End User Industry and Region. It details leading market players, providing an overview of their business, product offerings, investments, revenue streams, and key applications. Additionally, the report includes insights into the competitive environment, SWOT analysis, current market trends, as well as the primary drivers and constraints. Furthermore, it discusses various factors that have driven market expansion in recent years. The report also explores market dynamics, regulatory scenarios, and technological advancements that are shaping the industry. It assesses the impact of external factors and global economic changes on market growth. Lastly, it provides strategic recommendations for new entrants and established companies to navigate the complexities of the market.
Future Outlook
- Demand for recovered rare earths will increase with the expansion of electric vehicles and wind energy.
- Recycling from e-waste will remain the leading recovery source due to growing global electronics consumption.
- Technological advancements in hydrometallurgy and bioleaching will improve recovery efficiency and cost-effectiveness.
- Governments will strengthen policies to reduce reliance on primary mining and promote circular economy models.
- Strategic collaborations between recyclers and automotive or electronics manufacturers will accelerate supply chain integration.
- Asia Pacific will continue to dominate consumption and recovery, led by China’s advanced infrastructure.
- North America and Europe will expand local recovery initiatives to ensure supply independence.
- Rare earth demand in defense and aerospace applications will create new opportunities for specialized recovery.
- Investment in recycling infrastructure across emerging economies will gradually expand regional market participation.
- Sustainability commitments from global corporations will drive adoption of recovered rare earths in manufacturing.


