
Quick answer
A TFT LCD module plant making about 10 million smartphone and notebook modules a year from bought-in cells needs total CapEx of roughly USD 40–70 million in an Asian industrial park, including land and working capital margin. Gross margin typically runs 10–15% of the module price, and payback falls in a 4–7 year band at 75–85% utilization. A full glass fab is a different project, costing billions of dollars.
Feasible as a module plant with an anchor device customer and a secured cell supply; a merchant plant without contracts or a new array fab faces overcapacity and thin returns.
TFT LCD plant: key highlights
| Parameter | Indicative value | Note |
|---|---|---|
| Plant capacity | 10 million modules per year | About 92% smartphone size, 8% notebook size, from bought-in cells |
| Total CapEx | USD 40–70 million | Asian industrial park; land, clean rooms, bonding and test lines, working capital margin |
| Raw material share of operating cost | 84–90% | Open cells, driver chips, backlights, polarizers, flexible circuits |
| Gross margin | 10–15% | On module price; assumed blended price of USD 12 per module |
| Payback period | 4–7 years | At 75–85% utilization, including a ramp-up of about one year |
| IRR | Available in report | Post-tax, 10-year model |
| Break-even | Available in report | Capacity utilization basis |
Ranges assume a 10 million modules a year plant using bought-in open cells, not an array fab, on about 4 hectares in an Asian industrial park, 2026 prices, 75–85% utilization, an assumed blended price of USD 12 per module and 90 rupees to the dollar (assumed) for the benchmark. U.S. or EU sites cost more. The full report can be customized to any country.
What is TFT LCD?
A thin-film-transistor liquid crystal display, or TFT LCD, is a flat panel in which a grid of tiny transistors on glass switches each pixel on or off, while a layer of liquid crystal controls how much backlight passes through a color filter. The finished product sold to device makers is normally a module, which joins the glass cell to driver chips, flexible circuits, polarizers and a backlight.
The main backplane types are amorphous silicon for TVs and low-cost phones, low-temperature polysilicon for sharper phone and automotive screens, and oxide for notebooks and tablets. Panels are also grouped by liquid crystal mode, such as IPS or VA, which set viewing angle and contrast.
Under the international Harmonized System, modules fall in heading 8524. Liquid crystal modules without drivers or control circuits take HS code 852411, and liquid crystal modules with them take 852491. Finished screens are classified elsewhere. Buyers are makers of TVs, monitors, notebooks, tablets, phones, car cockpits and industrial controls.
TFT LCD market overview and global demand
Credence Research values the global display panel market, which covers OLED and other technologies as well as LCD, at USD 136.64 billion in 2024 and projects USD 274.11 billion by 2032, an 8.47% CAGR. That implies about USD 148.2 billion in 2025, derived from the 2024 figure and the CAGR. No separate figure for TFT LCD alone is used here.
Unit demand remains large even as OLED gains share. A forecast published by I-Connect007 in August 2026 puts 2026 smartphone panel shipments at about 2.25 billion, down 2.5%, with LCD at about 1.33 billion, roughly 59%, and AMOLED at about 920 million. Repair and secondary markets are propping up LCD volume, which suits small module plants but does not promise growth.
Trade is highly concentrated. Trade statistics for heading 8524 show world exports above USD 54 billion in 2023, led by China at 71%, Hong Kong at 18.6%, Japan at 3.3% and Germany at about 3%. The heading includes OLED modules, so the figures overstate LCD alone.
Capacity keeps shifting to large, newer lines. The same publication reported in March 2026 that Gen 8.6 fabs would hold about 26% of global LCD capacity in 2026, while Gen 5 and older lines would fall to about 4.7%. Older plants in Japan and Taiwan are closing, and brands are moving final module work to Vietnam, India and Mexico to manage tariffs and local-content rules. Industrial display demand and car screens are the steadier niches, because qualification cycles are long and buyers change suppliers less often.
TFT LCD manufacturing process
Making a TFT LCD has two very different stages. The front end builds the glass cell in an array fab: thin films are deposited on large mother glass, patterned by photolithography and etched to form transistors; a second sheet receives the color filter; the two are aligned, filled with liquid crystal, sealed and cut. This stage needs class-controlled clean rooms, specialty gases and large volumes of ultrapure water. It belongs to fab owners with billions of dollars in capital.
The back end turns cells into working modules, and this is the stage modeled here. It is cleaner, smaller and far quicker to build, which explains why new regional entrants begin with it.
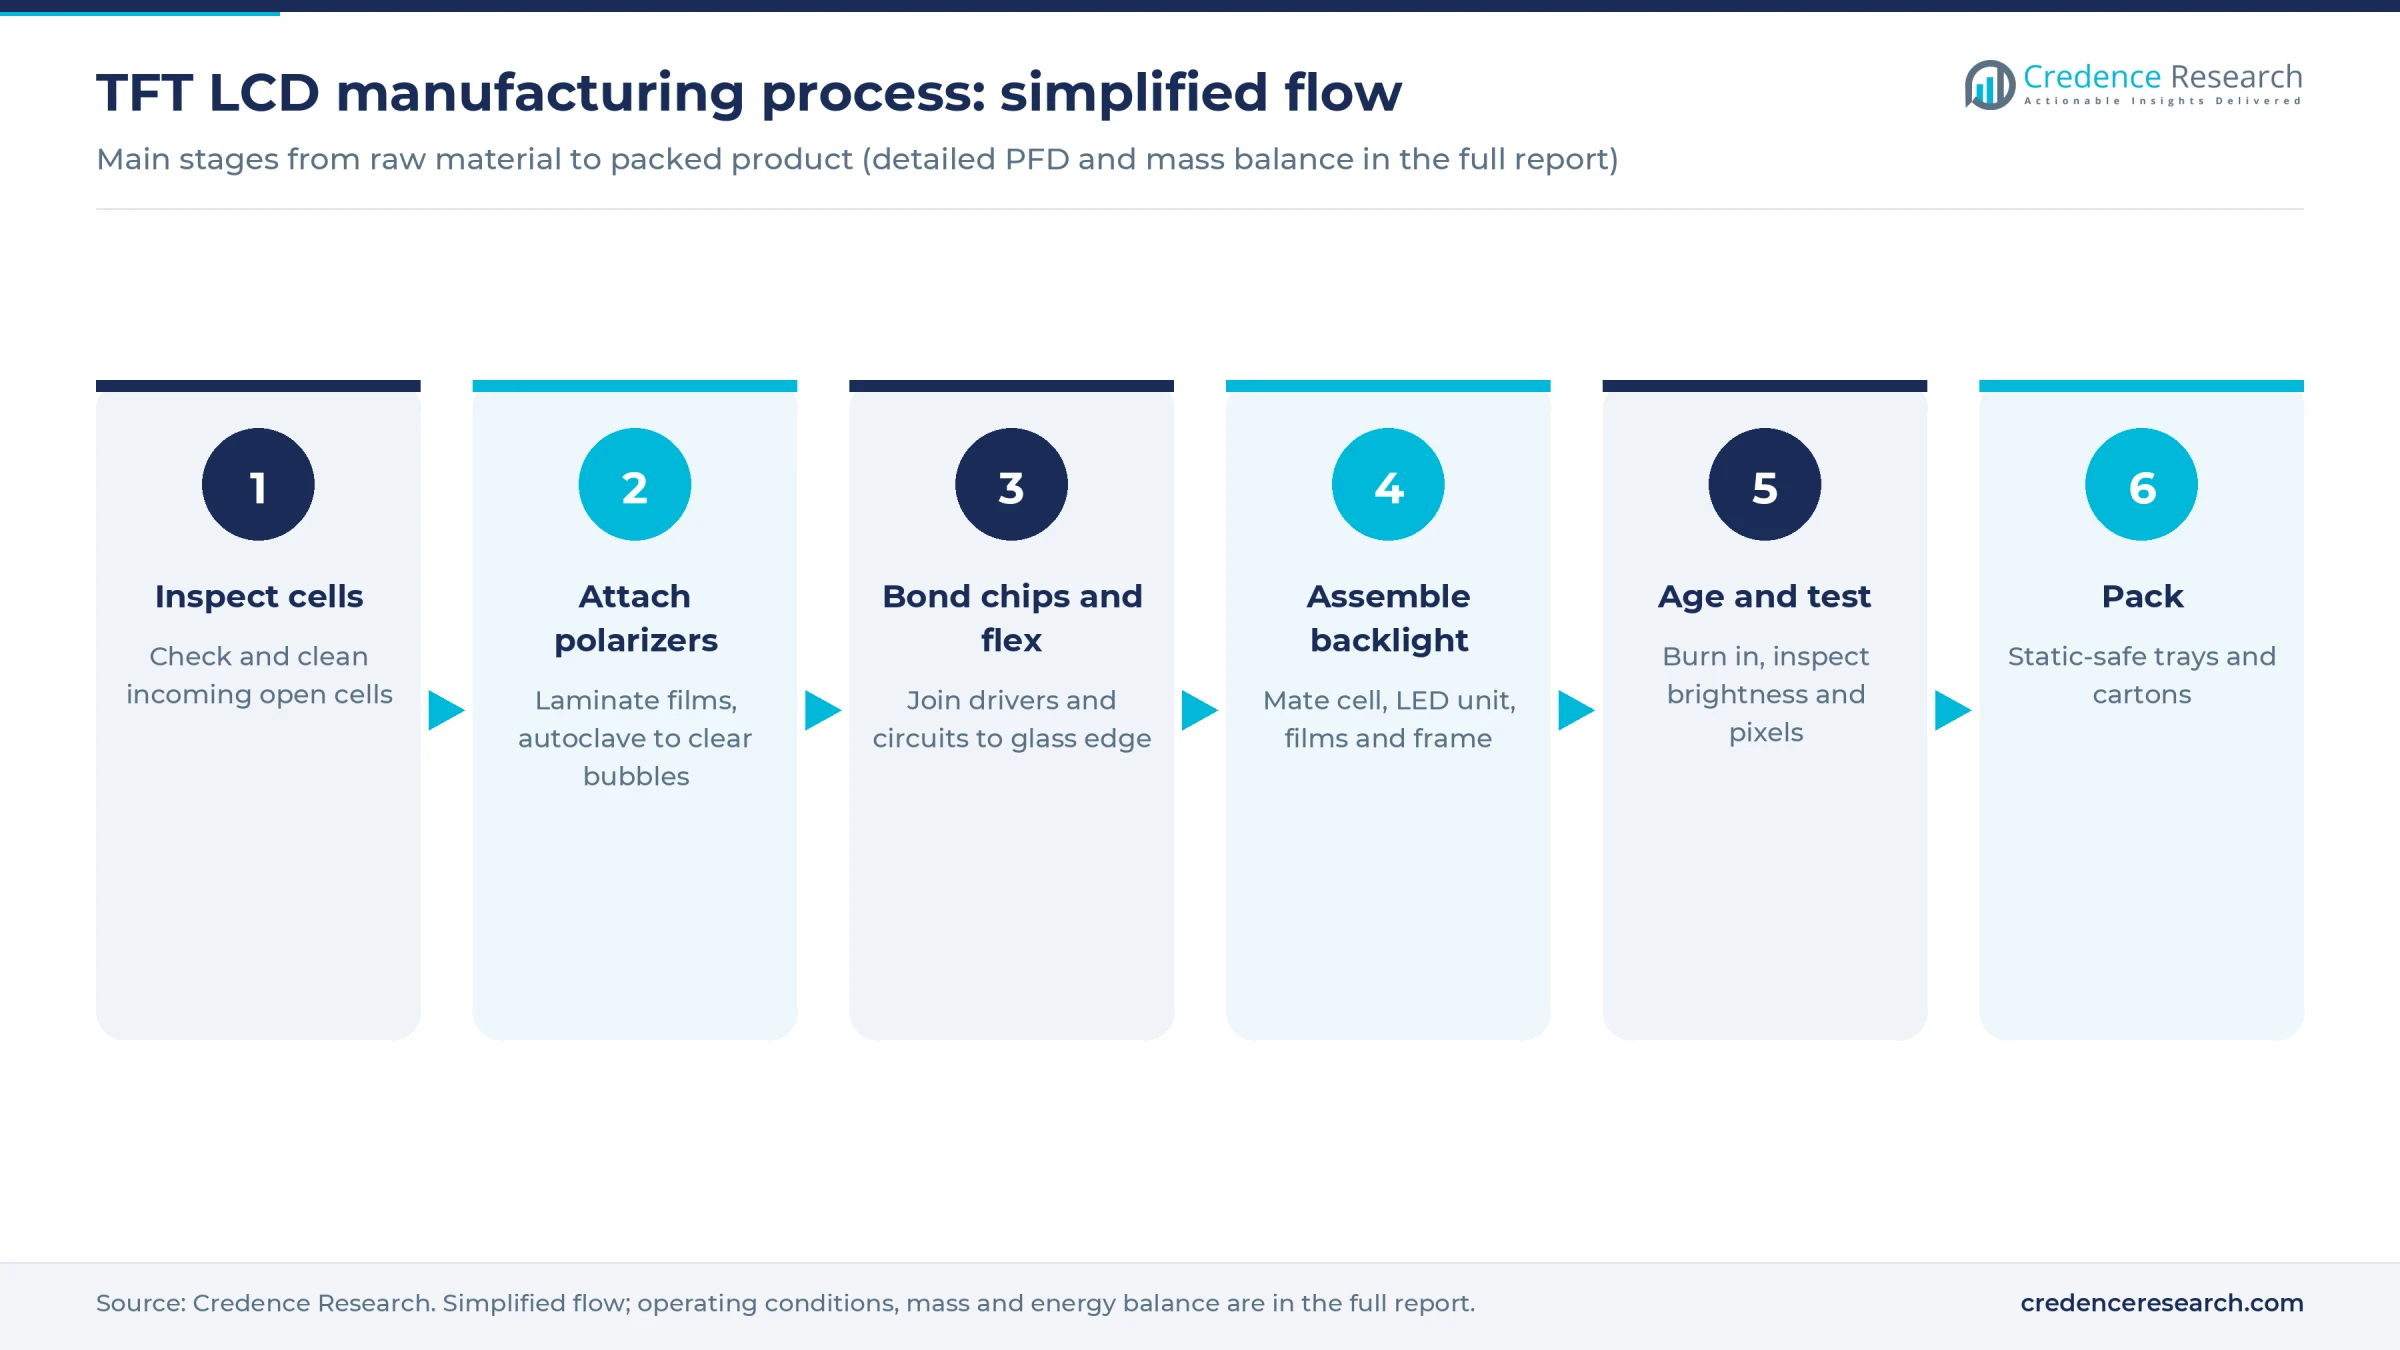
- Incoming inspection and cleaning. Cells are checked for scratches, line defects and particles, because one bad cell scrapped late wastes all the parts added to it.
- Polarizer attachment. Films are laminated to both sides of the glass, then autoclaved to remove trapped air bubbles.
- Chip and flex bonding. Driver chips are bonded to the glass edge with anisotropic conductive film under heat and pressure, then the flexible circuit is bonded the same way. Alignment tolerance here largely sets line yield.
- Backlight and frame assembly. The cell is mated to an LED backlight unit, optical films and a frame in a dust-controlled room. Touch sensors or cover glass can be laminated at this step.
- Aging and optical test. Modules run at raised temperature, then automatic optical inspection checks brightness, color uniformity and dead pixels.
- Packing and dispatch. Static-safe trays and cartons protect the glass in shipment to device assembly lines.
Yield is the core quality metric. Because the open cell carries most of the value in each module, a small rise in scrap can erase the whole conversion margin, so plants invest early in inspection and operator training.
TFT LCD plant setup cost
For a plant rated at 10 million modules a year, about 33,000 a day over 300 working days, total project cost is roughly USD 40–70 million in an Asian industrial park, the cost region used for this range. The basis is a real project: Dixon Technologies and HKC's joint venture in India was reported at about USD 120–135 million, at an assumed 90 rupees per dollar, for 26 million modules in its first phase and about 55 million after scale-up. Scaling that down with an assumed 0.7 capacity exponent gives this range. U.S. or EU sites could cost 1.3–1.6 times as much (assumed), and the full report can be customized to any country.
A full array fab is a separate class of investment. Tianma's Gen 8.6 line announced in 2022 carried a planned CNY 33 billion, about USD 4.6 billion at an assumed 7.2 yuan per dollar.
Land shows how the build works. A plant of this size needs about 40,000 sq m for the building, utilities, stores and truck access. At an assumed USD 40–100 per sq m for a serviced estate, land costs about USD 1.6–4.0 million. Leased plots avoid that outlay and add annual rent instead.
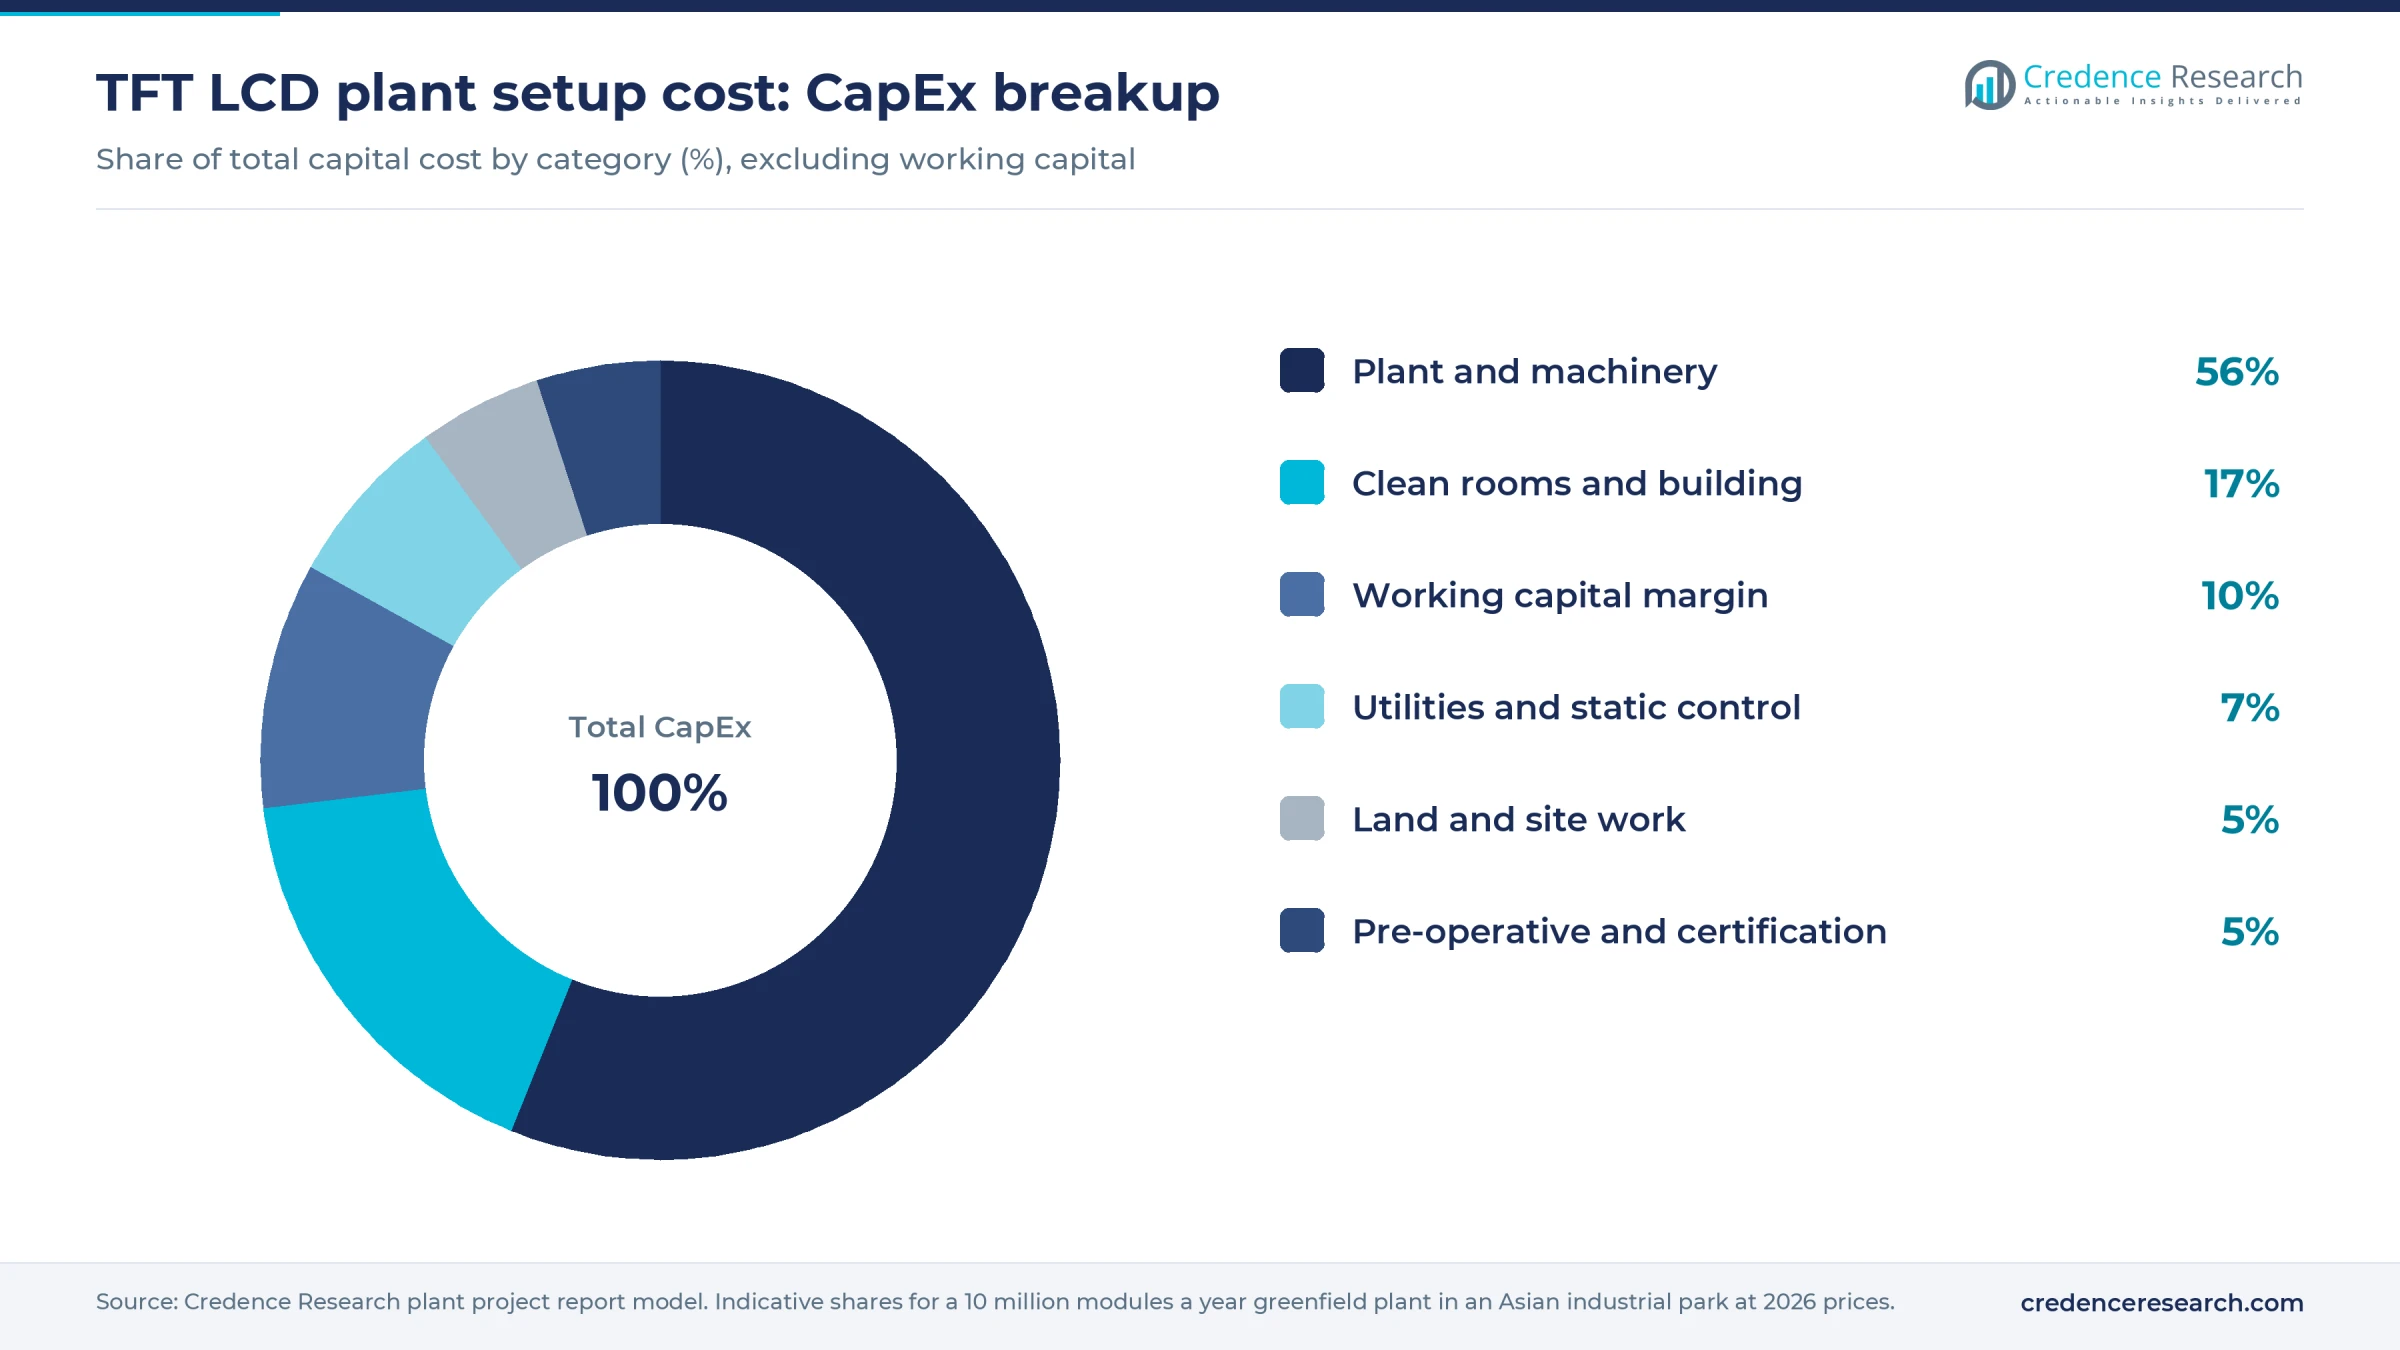
Machinery dominates the spending, because bonding, lamination and optical inspection lines are specialized and often imported, so the mix of new against refurbished tools is the main swing factor. Clean rooms with static-safe floors are the next largest item. Working capital deserves more attention than its share suggests, since cells and driver chips are costly and customers often pay in 60–90 days (assumed).
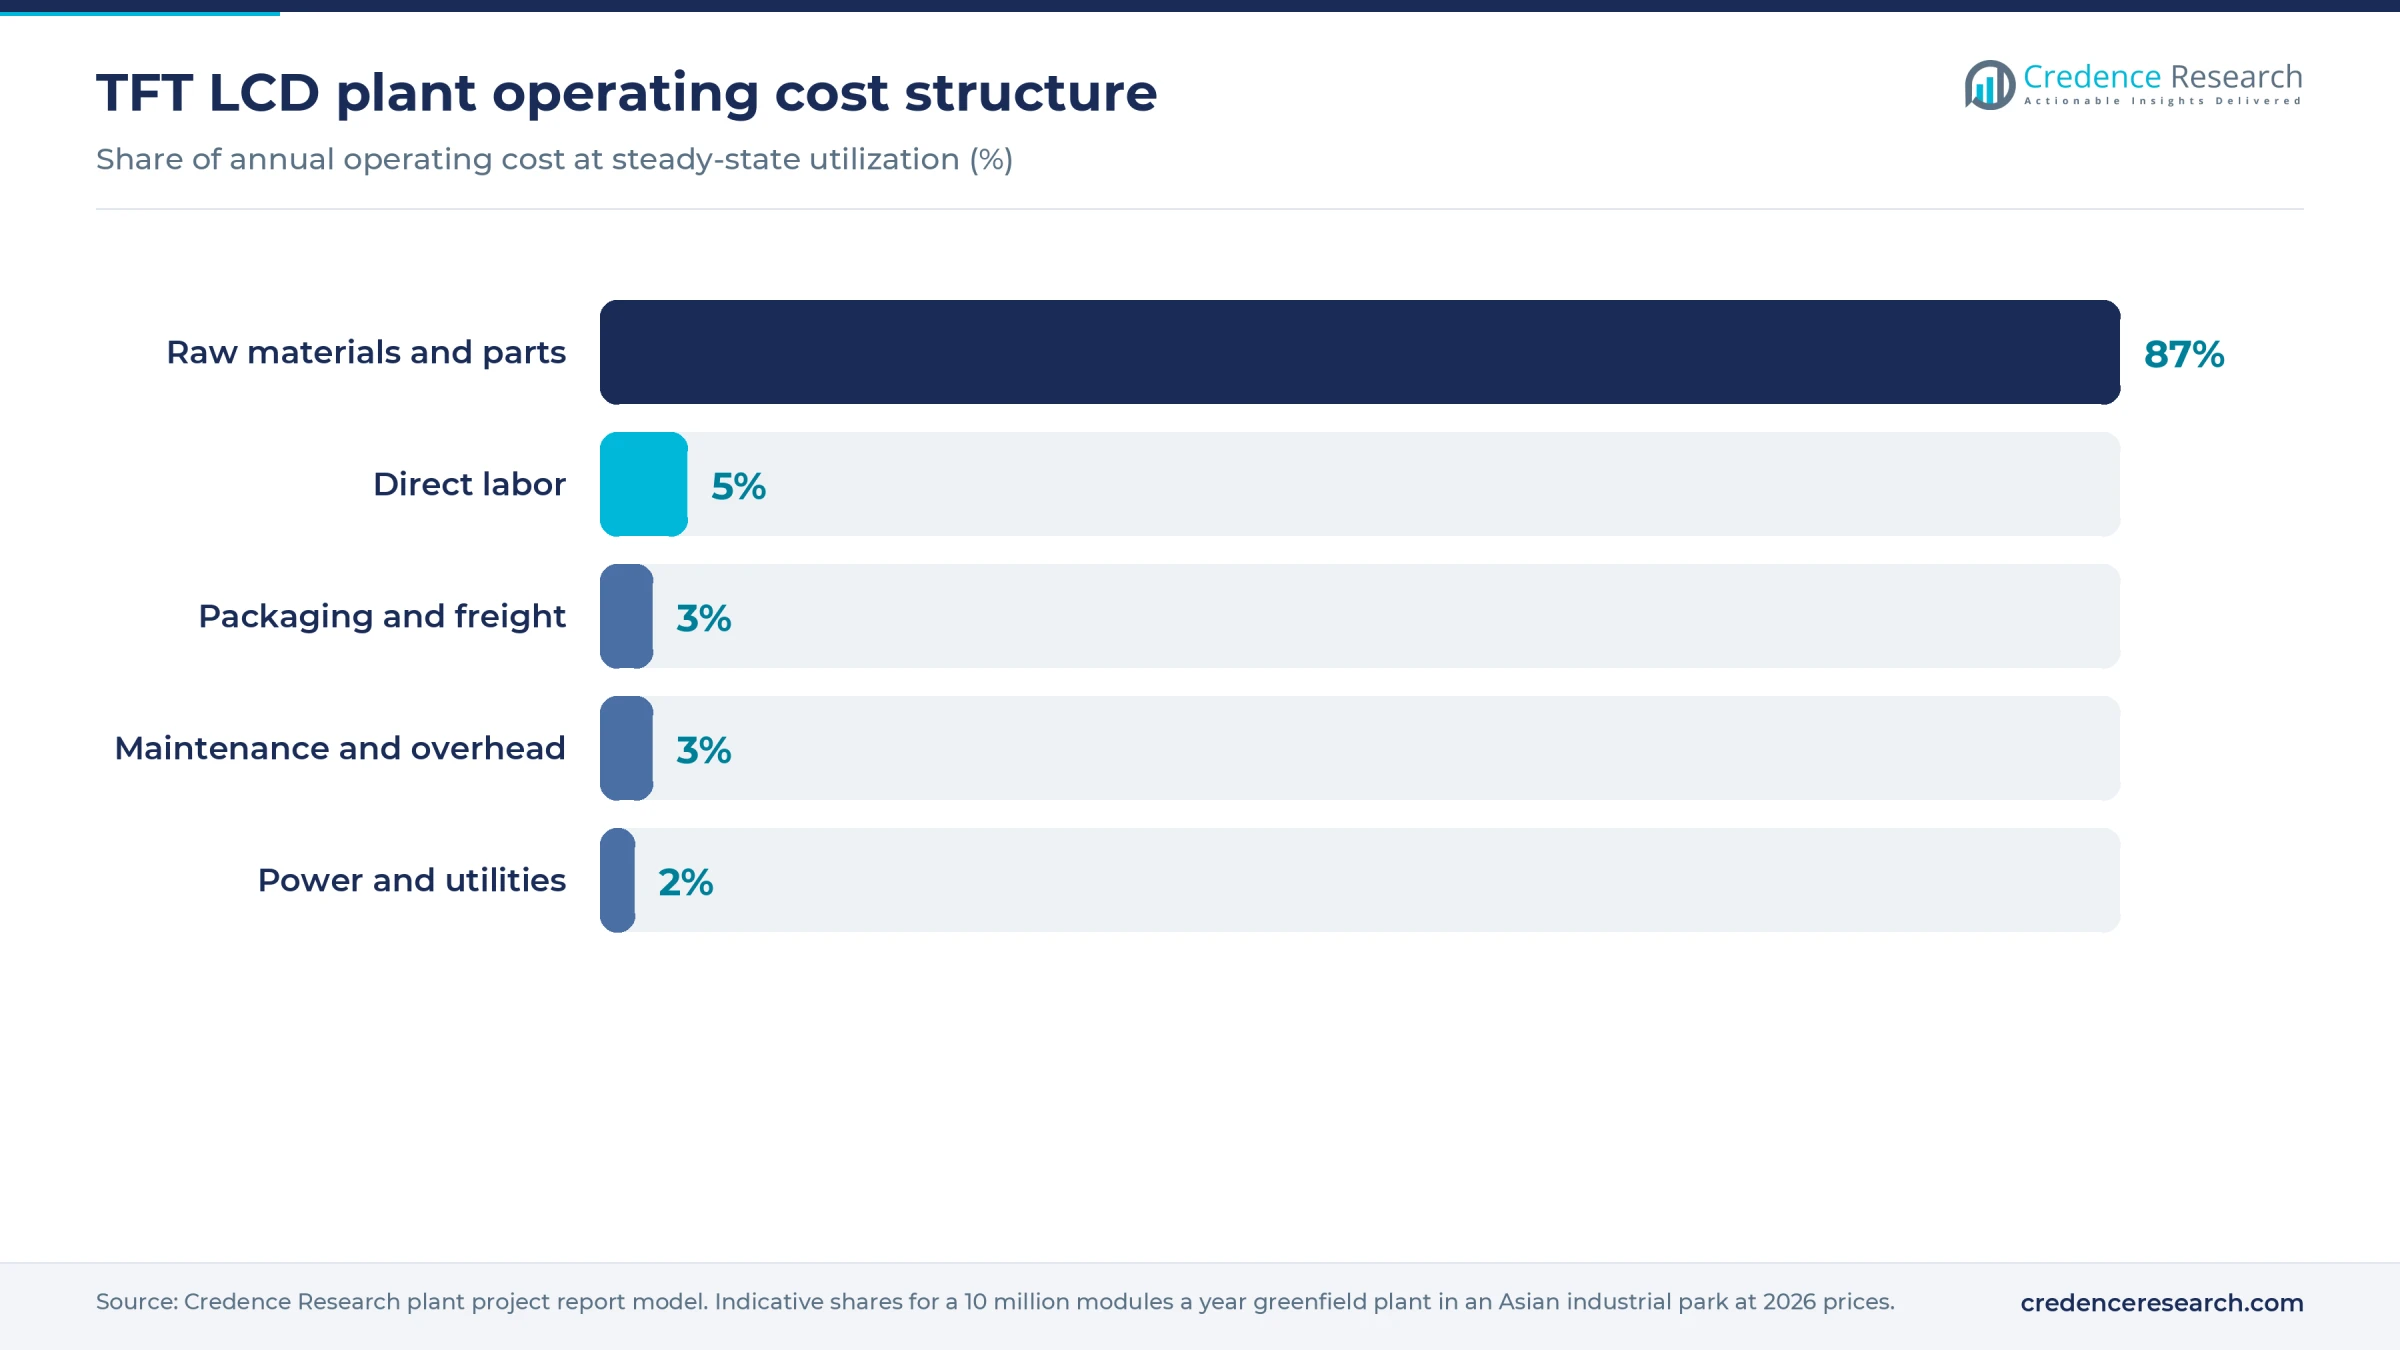
Operating cost is mostly purchased parts. Open cells, driver chips and backlights carry most of a module's value, so conversion costs such as labor and power are small. Purchasing terms and yield decide profit more than wages. If cells are 60–70% of module price (assumed), a 1% rise in cell cost without pass-through cuts gross margin by more than half a point, so contracts with price-linked clauses matter.
Machinery and raw materials for a TFT LCD plant
Core equipment for a module line includes:
- Cell cleaners and automatic visual inspection systems
- Polarizer attachment machines and autoclaves
- Chip-on-glass and film-on-glass bonders, with anisotropic conductive film applicators
- Backlight assembly and optical lamination stations
- Aging ovens, optical test benches and reliability chambers
- Clean room air handling, static control, compressed dry air and chillers
Bonders and test systems come largely from Japan, South Korea, Taiwan and China. Chinese tools usually cost less, while long-established suppliers may offer better uptime on fine-pitch work. Machine costs and specifications are available in the report.
Raw materials carry global sourcing risk, because few regions make them:
- Open cells: mainland China, with Taiwan and South Korea, and smaller volume from Japan
- Driver chips: designed mainly in Taiwan, South Korea and China, and exposed to foundry cycles
- Polarizers and optical films: China, Japan, South Korea and Taiwan
- LED backlights and flexible circuits: China, Taiwan, South Korea and Japan
Upstream, display glass and liquid crystal related materials matter mainly to fab owners. A module plant depends on one or two cell sources, so a cell maker's own capacity or export decisions can stop a line. A second qualified supplier is worth paying for.
TFT LCD business profit margin and ROI
A module plant with sound yields can expect gross margin of about 10–15% of module price. Two checks frame that range. AUO reported a 13.0% gross margin for the second quarter of 2026 and Innolux 14.6%, both as integrated panel makers. Commentary in Business Standard in March 2026 described display module assembly as earning double-digit margins on a small share of device cost.
Pricing is the weak point in any forecast. Panel prices reported for August 2026 stood near USD 35 for a 32-inch TV panel and USD 123 for a 55-inch one, both slightly lower month on month, and module prices tend to follow cell prices downward. The USD 12 blended price used here for phone and notebook modules is assumed.
At 8 million modules sold, revenue would be about USD 96 million. After overhead, tax and an add-back of depreciation, cash profit is about USD 10–14 million a year, which gives a payback band of 4–7 years including ramp-up across most of the CapEx range, with the costliest build at the lowest cash profit nearer 8 years. Sensitivity runs mainly through yield and cell cost: both move returns far more than power or wages.
| Metric | Value |
|---|---|
| IRR | Available in report |
| NPV | Available in report |
| ROI | Available in report |
| DSCR | Available in report |
How to start a TFT LCD business, licenses and approvals
A new plant needs business and tax registration, land use and building permits, an environmental permit or consent, occupational safety registration, and import-export registration for parts. A module line is cleaner than an array fab, yet solvents, adhesives and electronic scrap still need controls. Foreign investment screening can apply as well, so ownership should be reviewed before land is committed. Module makers rarely hold product-safety marks for the module alone, because those usually attach to the finished device, but customers still ask for restricted-substance declarations and test reports.
Examples by market
| Market | Plant permits | Product and chemical rules |
|---|---|---|
| United States | State air permit under the Clean Air Act, or a Title V operating permit above major-source thresholds; hazardous waste rules under RCRA; OSHA workplace standards | EPA TSCA rules for chemicals; FCC Part 15 limits and UL 62368-1 listing usually apply to the finished device |
| European Union | National environmental permit, under the Industrial Emissions Directive 2010/75/EU where solvent or activity thresholds are met | RoHS 2011/65/EU and REACH; WEEE 2012/19/EU and CE marking fall on finished equipment |
| India | State Pollution Control Board consent to establish and consent to operate; Factories Act license; DGFT importer-exporter code; Press Note 3 clearance for investors from land-border countries | BIS Compulsory Registration for finished TVs and video monitors, which does not list modules separately; E-Waste Rules 2022 producer registration with CPCB |
Rules vary by state and model, so applicants should confirm requirements with the regulator before fixing a design or a site.
Key TFT LCD manufacturers and recent developments
BOE, TCL CSOT, HKC, Tianma and Innolux, along with AUO in Taiwan, lead global TFT LCD output. Samsung Display and LG Display have largely moved to OLED. Sharp and Japan Display remain in smaller or specialty volume. Regional module and electronic display makers are growing in India and Southeast Asia, often with a cell supplier as a partner.
Recent developments show both the retreat of older fabs and the spread of module work:
- February 2026: Sharp said it would stop LCD panel production at Kameyama No. 2 in August after a planned sale to Foxconn fell through, and it sought voluntary retirees among 1,170 employees.
- March 2026: India's electronics ministry approved Dixon Technologies' joint venture with HKC, 74% and 26% owned, to make LCD and TFT-LCD modules.
- August 2026: TCL told Vietnam's government it would raise its investment there from USD 310 million to USD 590 million by 2027, adding to plants that make LCD panels and display modules.
For an entrant, the lesson is that capacity is moving closer to device assembly, while fab ownership keeps consolidating among fewer groups.
What's inside the TFT LCD project report PDF
The report runs to 21 chapters. Open a chapter to see its sections.
1. Preface
2. Scope and Methodology
- 2.1 Objectives of the Study
- 2.2 Stakeholders
- 2.3 Research Methodology
- 2.4 Data Sources and Key Assumptions
3. Executive Summary
- 3.1 Market Snapshot
- 3.2 Project at a Glance (Capacity, CapEx, OpEx)
- 3.3 Key Financial Indicators (IRR, NPV, Payback, Break-even)
- 3.4 Feasibility Verdict
4. Product Overview
- 4.1 TFT LCD Definition and Properties
- 4.2 Grades and Specifications (BIS / ISO / ASTM)
- 4.3 HS Code and Classification
- 4.4 Key Applications
- 4.5 Substitutes
5. Global TFT LCD Market
- 5.1 Market Overview
- 5.2 Historical and Current Market Performance (Volume and Value)
- 5.3 Market Breakup by Grade / Type
- 5.4 Market Breakup by End-Use Industry
- 5.5 Market Breakup by Region
- 5.6 Market Drivers, Restraints and Trends
- 5.7 Value Chain Analysis
- 5.8 Market Forecast
6. Target Country TFT LCD Market Analysis
- 6.1 Demand and Supply Analysis
- 6.2 Installed Capacity vs Demand Gap
- 6.3 Import Dependence
- 6.4 Demand Forecast by End-Use
7. Trade Analysis
- 7.1 Imports by Volume, Value and Country
- 7.2 Exports by Volume, Value and Country
- 7.3 Trade Balance and Opportunities
8. Price Analysis
- 8.1 Historical TFT LCD Price Trends by Region
- 8.2 Raw Material / Feedstock Price Trends and Linkage
- 8.3 Price Forecast
- 8.4 Margins Across the Value Chain
9. Competitive Landscape
- 9.1 Market Structure
- 9.2 Key Players and Installed Capacities
- 9.3 Profiles of Key Players
- 9.4 Recent Developments (Expansions, M&A, New Plants)
10. Manufacturing Process and Technology
- 10.1 Comparison of Technology Routes
- 10.2 Selected Route and Process Flow Diagram
- 10.3 Unit Operations Involved
- 10.4 Chemical Reactions Involved
- 10.5 Mass Balance and Raw Material Requirements
- 10.6 Energy Balance
- 10.7 Quality Assurance Criteria and Technical Tests
- 10.8 By-products and Waste Handling
- 10.9 Technology Licensors / Providers
11. Project Details, Requirements and Costs
- 11.1 Land, Location and Site Development
- 11.1.1 Site Selection Criteria
- 11.1.2 Location Analysis
- 11.1.3 Land Requirement and Costs
- 11.1.4 Site Development Costs
- 11.2 Plant Layout
- 11.2.1 Layout Principles
- 11.2.2 Proposed Layout
- 11.2.3 Factors Influencing Layout
- 11.3 Civil Works and Buildings
- 11.4 Plant Machinery
- 11.4.1 Machinery Requirements and Specifications
- 11.4.2 Machinery Costs
- 11.4.3 Machinery Suppliers
- 11.5 Raw Materials
- 11.5.1 Requirements per Tonne of Output
- 11.5.2 Procurement and Sourcing
- 11.5.3 Costs
- 11.5.4 Suppliers
- 11.6 Packaging
- 11.6.1 Packaging Requirements
- 11.6.2 Packaging Costs
- 11.6.3 Packaging Suppliers
- 11.7 Storage and Material Handling
- 11.8 Transportation Requirements and Costs
- 11.9 Utilities
- 11.9.1 Power Requirements and Costs
- 11.9.2 Water Requirements and Costs
- 11.9.3 Steam, Fuel and Other Utilities
- 11.10 Manpower Requirements and Wages
12. Environment, Health, Safety and Sustainability
- 12.1 Effluent and Emissions Management
- 12.2 Hazard Classification and Safety Measures
- 12.3 Carbon Footprint
- 12.4 Green / Low-Carbon Process Options
13. Regulatory Procedures, Approvals and Certifications
- 13.1 Licences and Registrations
- 13.2 Environmental Clearances
- 13.3 Product Certifications (BIS, REACH, etc.)
- 13.4 Approval Timeline
14. Project Implementation Schedule
15. Project Economics
- 15.1 Capital Cost of the Project
- 15.2 Techno-Economic Parameters
- 15.3 Capacity Utilization and Ramp-up
- 15.4 Product Pricing and Margins
- 15.5 Income Projections
- 15.6 Expenditure Projections
- 15.7 Working Capital Requirement
- 15.8 Taxation
- 15.9 Depreciation
16. Financial Analysis
- 16.1 Projected Profit and Loss Account
- 16.2 Projected Cash Flow Statement
- 16.3 Projected Balance Sheet
- 16.4 Liquidity Analysis
- 16.5 Profitability Analysis (Payback, NPV, IRR, ROI)
- 16.6 Break-even Analysis
- 16.7 Debt Service Coverage Ratio (DSCR)
- 16.8 Sensitivity Analysis
- 16.9 Scenario and Uncertainty Analysis
17. Funding and Incentives
- 17.1 Means of Finance and Debt-Equity Structure
- 17.2 Loans and Financial Assistance
- 17.3 Government Schemes and Subsidies (PLI, State Policies)
18. Risk Assessment
- 18.1 Key Success Factors
- 18.2 Key Risk Factors
- 18.3 Risk Mitigation
19. Strategic Recommendations
20. Case Study of a Successful Venture
21. Appendix
- 21.1 Detailed Assumptions
- 21.2 Abbreviations
- 21.3 List of Tables and Figures
- 21.4 Sources
This page vs. the full report
| Data point | On this page (free) | In the full report |
|---|---|---|
| Total CapEx | One rounded range at one capacity | Exact figure at three capacities with a line-item breakup |
| CapEx breakup | Category shares (%) only | Cost, quantity and supplier for every machine |
| Operating cost | Share of raw materials, utilities and labor | Per-unit cost sheet with each input price and consumption |
| Profitability | Gross margin range and payback band | Exact IRR, NPV, ROI, break-even and DSCR |
| Financial statements | List of what is included | 10-year P&L, cash flow, balance sheet and Excel model |
| Sensitivity | One directional line | Full sensitivity and scenario tables |
| Process | Simplified flow diagram | Detailed process flow, mass and energy balance, operating conditions |
| Machinery | Names of the main machines | Specifications, capacity, cost and supplier list |
| Market | Headline size, growth and India demand trend | Segment, region, trade and price forecast tables |
| Suppliers and buyers | Supplier types and sourcing hubs | Named suppliers and buyers |
TFT LCD project report: FAQs
How much does a TFT LCD plant cost?
Why does this estimate exclude an array fab?
What is the profit margin in a TFT LCD business?
What is the payback period for a TFT LCD plant?
What is the HS code for TFT LCD modules?
What raw materials does a TFT LCD module plant need?
Which approvals does a TFT LCD factory need?

About the analyst
Amit Jain, Senior Consultant – ICT & Emerging Technologies
Strategic market intelligence and consulting leader at Credence Research Inc with 20+ years across the global ICT sector, specializing in quantitative market sizing, technology lifecycle forecasting, competitive intelligence and commercial due diligence for enterprise clients worldwide.
Related market research
- Display Panel Market Size, Growth, Share and Forecast 2032
- Industrial Display Market Size, Share, Growth and Forecast, 2025-2035
- Electronic Display Market Size, Growth, Share and Forecast 2032
- Smartphone Display Market Share, Growth and Forecast 2032
- Liquid Crystal Polymer Market Size, Growth and Forecast 2032
- Micro LED Display Market Size, Share, Growth and Forecast, 2025-2035
More plant project reports
- LED Light Manufacturing Plant Project Report (DPR) 2026
- Vinegar Manufacturing Plant Project Report (DPR) 2026
- Onion Powder Manufacturing Plant Project Report (DPR) 2026
- Palm Oil Processing Plant Project Report (DPR) 2026
- Tea Processing Plant Project Report (DPR) 2026
- Perfume Manufacturing Plant Project Report (DPR) 2026