Market Overview
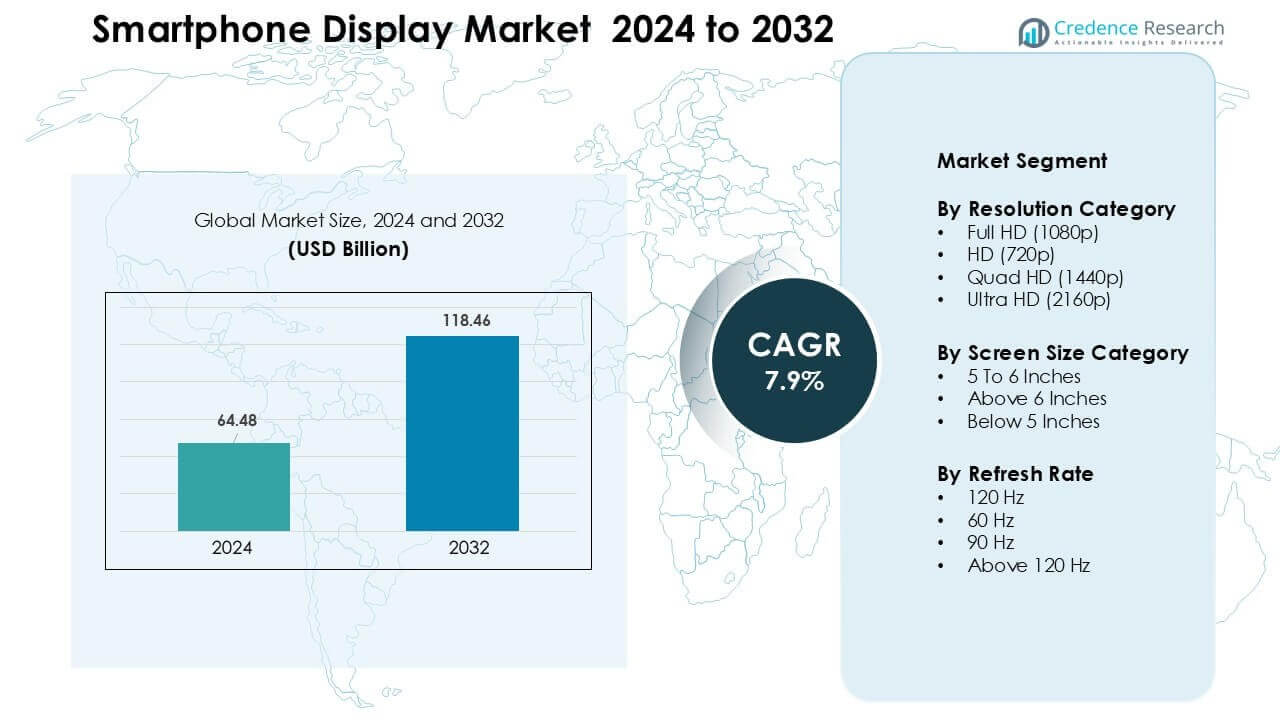
Smartphone Display Market was valued at USD 64.48 billion in 2024 and is anticipated to reach USD 118.46 billion by 2032, growing at a CAGR of 7.9% during the forecast period.
| REPORT ATTRIBUTE |
DETAILS |
| Historical Period |
2020-2023 |
| Base Year |
2024 |
| Forecast Period |
2025-2032 |
| Smartphone Display Market Size 2024 |
USD 64.48 Billion |
| Smartphone Display Market, CAGR |
7.9% |
| Smartphone Display Market Size 2032 |
USD 118.46 Billion |
The smartphone display market is shaped by major players such as Visionox Technology Inc., Sharp Corporation, Innolux Corporation, BOE Technology Group Co., Ltd., E Ink Holdings Inc., Tianma Microelectronics Co., Ltd., Samsung Display Co., Ltd., AU Optronics Corp., Japan Display Inc., and LG Display Co., Ltd. These companies compete through advancements in OLED, AMOLED, LTPO, flexible, and high-refresh-rate panels that support premium and mid-range smartphones. Strong investment in production capacity and material innovation helps them secure supply contracts with global handset brands. Asia Pacific led the market in 2024 with nearly 44% share, driven by large-scale manufacturing, rapid 5G rollout, and strong consumer demand for high-spec displays.
Access crucial information at unmatched prices!
Request your sample report today & start making informed decisions powered by Credence Research Inc.!
Download Sample
Market Insights
- The smartphone display market was valued at USD 48 billion in 2024 value and is projected to reach USD 118.46 billion by 2032, growing at a CAGR of 7.9%.
- Growth is driven by rising adoption of OLED, high-refresh-rate panels, and larger screens, with the above-6-inch segment holding nearly 71% share in 2024.
- Key trends include wider availability of 120 Hz displays, expanding foldable-screen production, and rapid advancement in under-display sensors supporting full-screen designs.
- Competition remains strong as major players invest in OLED capacity, LTPO efficiency, flexible modules, and improved durability while mid-range expansion intensifies price pressure.
- Asia Pacific led the market with about 44% share in 2024, followed by North America at 28%, while Full HD resolution held the dominant position with nearly 52% segment share globally.
Market Segmentation Analysis:
By Resolution Category
Full HD led the resolution category in 2024 with about 52% share. Phone brands preferred Full HD because the format balances clarity, battery use, and production cost. Mid-range and upper-mid devices used this resolution to offer sharp visuals without raising price. Quad HD held a niche share in premium phones, while Ultra HD stayed limited due to high power draw. HD screens declined as buyers shifted toward sharper displays. Growth in gaming and social video also pushed brands to retain Full HD as the most practical mass-market choice.
- For instance, Xiaomi shipped models such as Xiaomi 13 featuring a 6.36-inch display at 2400×1080 pixels (Full HD+), enabling smooth 120 Hz refresh while keeping battery consumption modest compared to higher-resolution panels.
By Screen Size Category
Above 6 inches dominated this segment in 2024 with nearly 71% share. Consumers favored large displays for streaming, gaming, and multitasking. Phone brands adopted this size to support bigger batteries and slimmer bezels. The 5 to 6-inch range kept a moderate base among budget buyers who preferred compact handling. Below 5 inches continued to shrink as app layouts and media habits demanded larger viewing space. Rising demand for immersive content and better screen-to-body ratios helped the above-6-inch category stay ahead across regions.
- For instance, the mid-range trend shifted toward 6.5-inch displays as “standard” by 2024, in part because such screen sizes allowed manufacturers to offer around 5000 mAh battery capacities alongside improved display area.
By Refresh Rate
120 Hz held the top position in 2024 with around 46% share. High-refresh panels improved gaming, browsing, and scrolling, making them a key feature in mid-range and premium phones. Brands used 120 Hz to stand out in competitive price bands as component costs fell. The 90 Hz category grew in the lower-mid range, while 60 Hz stayed common in entry-level models. Panels above 120 Hz remained in niche gaming phones. Demand for smoother UI performance and better motion clarity supported the rise of 120 Hz across global markets.
Key Growth Drivers
Rising Demand for High-Refresh-Rate Displays
Demand for high-refresh-rate panels continues to rise as consumers expect smoother navigation, better motion clarity, and enhanced gaming performance. Phone makers now offer 90 Hz and 120 Hz screens even in mid-range models, helping these displays become standard features. A higher refresh rate supports fluid scrolling and reduces visual strain during long social media use. Gaming-centric phones also push adoption because fast-response displays improve user experience in competitive play. Lower component costs allow brands to scale these panels across broader price segments. Strong growth in mobile gaming, short-video content, and e-sports engagement keeps this driver strong across global markets.
- For instance, Samsung Galaxy F15 5G launched in 2024 with a 6.5-inch Super AMOLED display at 1080×2340 pixels supporting 90 Hz refresh rate a mid-range device bringing smoother UI and video playback to non-flagship users.
Expansion of OLED Adoption Across Price Segments
OLED technology remains a major driver as brands shift from LCD to more vibrant and energy-efficient panels. Thinner design, deeper blacks, and improved contrast help OLED displays gain wider acceptance among buyers. Manufacturers use OLED screens to enhance premium appeal while keeping power use low due to pixel-level illumination control. The cost of flexible and rigid OLED modules continues to drop, making them suitable for mid-range phones. The trend boosts ecosystem growth for features such as always-on displays and in-screen fingerprint sensors. Rising production output in Korea and China also supports supply stability and market expansion.
- For instance, Samsung’s 2024 mid-range model Samsung Galaxy A55 5G uses a 6.6-inch OLED display showing how OLED is no longer restricted to premium flagships.
Growth in Large-Screen Smartphone Preferences
The steady shift toward larger displays fuels strong growth as customers rely on smartphones for video streaming, gaming, reading, and online shopping. Above-6-inch phones dominate because they offer better viewing comfort and support higher battery capacity. Slimmer bezels and advanced aspect ratios allow brands to deliver large screens without compromising handling. Demand for immersive content also drives wider adoption of vibrant multitouch panels. Manufacturers use large displays to differentiate mid-range and premium models and support productivity uses such as split-screen tasks. Popularity of OTT platforms and mobile entertainment strengthens this driver across regions.
Key Trend & Opportunity
Rapid Shift Toward Foldable and Flexible Displays
Foldable phones open new opportunities as brands develop displays that combine portability with expanded screen space. Flexible OLED enables tablets and phone hybrids that suit entertainment, gaming, and productivity tasks. Falling hinge failure rates and stronger ultra-thin glass make foldables more durable than earlier generations. Companies explore new form factors such as clamshells and tri-fold devices to reach more users. Premium buyers show strong interest due to improved usability and unique aesthetics. Expanding production capacity in Korea and China will reduce prices over time, helping foldables move beyond premium niches and accelerate market growth.
- For instance, Samsung Galaxy Z Fold 5 (2023) features a 7.6‑inch internal AMOLED display and a 6.2‑inch external screen, providing tablet-like space in a pocketable form factor.
Advancements in Under-Display Technologies
Under-display cameras, sensors, and fingerprint modules create opportunities for cleaner, uninterrupted screen designs. Brands work to improve light transmission and pixel density above camera modules to reduce visual distortion. These advancements help deliver full-screen experiences without notches or punch holes. Growing investment in transparent OLED layers and optimized algorithms improves image capture quality under the screen. Manufacturers also integrate biometric security into larger touch-sensitive zones for better accuracy. As production techniques mature, under-display components will support differentiation across premium and mid-range devices, helping brands offer more immersive and seamless user experiences.
- For instance, ZTE Axon 40 Ultra (2022) features a 6.8‑inch AMOLED display with a 16 MP under-display front camera, enabling a full-screen experience without a notch or punch-hole.
Key Challenge
Rising Panel Production Costs and Supply Instability
Volatile raw-material prices and fluctuating demand cycles make display production vulnerable. OLED modules require advanced equipment, clean-room facilities, and high-precision manufacturing, increasing the overall cost structure. Disruptions in glass substrates, driver ICs, and polarizer supply also impact availability. Market leaders face pressure to balance premium features with affordable pricing, especially in mid-range categories. Regional production gaps deepen risk during peak demand seasons. Brands must diversify suppliers, secure long-term contracts, and manage inventory to stabilize costs. These challenges continue to affect the speed at which advanced display technologies scale globally.
High Power Consumption in Advanced Display Panels
High-resolution and high-refresh-rate displays create power-management challenges, particularly in mid-range devices with smaller batteries. OLED panels consume less power than LCDs, yet brighter screens and always-on features increase demand on battery performance. Gamers and heavy video users experience faster drain, forcing brands to invest in adaptive refresh systems and optimized display drivers. Manufacturers aim to reduce energy use by improving material efficiency and pixel-switching technologies. Until these enhancements mature, higher power needs limit mass adoption of certain advanced displays, especially in budget segments where battery capacity and optimization matter most to consumers.
Regional Analysis
North America
North America held nearly 28% share in 2024, driven by strong demand for premium smartphones with OLED and high-refresh-rate panels. Consumers preferred large screens, advanced touch features, and higher brightness levels for gaming and streaming. Brands focused on integrating 120 Hz and LTPO technology across mid-premium devices. Carrier-backed upgrade programs also pushed faster display replacement cycles. Growth in 5G adoption supported higher-quality displays to enhance app performance and video clarity. The market remained concentrated around flagship launches, with a steady shift toward eco-efficient and durable screen materials.
Europe
Europe captured about 23% share in 2024, supported by higher adoption of AMOLED screens across mid-range and flagship models. Buyers prioritized display quality, color accuracy, and energy efficiency. The region also showed strong acceptance of 6-inch-plus phones due to media use and productivity needs. European brands emphasized sustainability, promoting low-power panels and recycled components. Replacement demand remained stable as consumers upgraded for better refresh rates and HDR support. Expansion of foldable devices further strengthened premium display adoption across major markets such as Germany, France, and the U.K.
Asia Pacific
Asia Pacific dominated the global market with nearly 44% share in 2024, backed by high smartphone production and strong consumer demand. China, South Korea, and India led adoption of OLED, LTPS LCD, and high-refresh-rate panels across all price segments. Large-screen phones remained the most preferred due to gaming, OTT streaming, and social media use. Regional manufacturers expanded production of flexible OLED and under-display modules, lowering overall costs. Growing 5G rollout and rising mid-range smartphone penetration accelerated demand for advanced display features across emerging economies.
Latin America
Latin America accounted for around 3% share in 2024, with steady growth in mid-range devices featuring Full HD and AMOLED screens. Consumers preferred durable displays with better sunlight visibility due to higher outdoor usage. Brands focused on 90 Hz and 120 Hz panels in competitive price bands to meet rising gaming needs. Economic constraints shaped buyer choices, leading to strong adoption of value-driven models. Expanding online retail and telecom financing programs improved access to larger-screen smartphones across countries such as Brazil, Mexico, and Colombia.
Middle East & Africa
The Middle East & Africa region held about 2% share in 2024, supported by rising demand for feature-rich mid-range and premium smartphones. High-brightness AMOLED and large-screen formats gained popularity among young users who consumed heavy video and gaming content. Gulf countries showed faster uptake of flagship models with 120 Hz and OLED panels, while African markets leaned toward Full HD LCD displays due to affordability. Growing 4G and 5G penetration and wider retail distribution networks boosted sales. Expanding digital lifestyles and youth-centric demand supported gradual market growth across the region.
By Resolution Category
- Full HD (1080p)
- HD (720p)
- Quad HD (1440p)
- Ultra HD (2160p)
By Screen Size Category
- 5 To 6 Inches
- Above 6 Inches
- Below 5 Inches
By Refresh Rate
- 120 Hz
- 60 Hz
- 90 Hz
- Above 120 Hz
By Geography
- North America
- Europe
- Germany
- France
- U.K.
- Italy
- Spain
- Rest of Europe
- Asia Pacific
- China
- Japan
- India
- South Korea
- South-east Asia
- Rest of Asia Pacific
- Latin America
- Brazil
- Argentina
- Rest of Latin America
- Middle East & Africa
- GCC Countries
- South Africa
- Rest of the Middle East and Africa
Competitive Landscape
The smartphone display market features strong competition led by major panel manufacturers such as Visionox Technology Inc., Sharp Corporation, Innolux Corporation, BOE Technology Group Co., Ltd., and E Ink Holdings Inc. These companies focus on expanding OLED, AMOLED, LTPO, and flexible display portfolios to meet rising performance needs across premium and mid-range smartphones. Producers invest heavily in R&D to improve brightness, refresh rates, power efficiency, and durability while reducing manufacturing costs through advanced substrate and driver technologies. Capacity expansion in Korea, China, and Taiwan strengthens supply stability and supports large-scale rollout of high-end panels. Partnerships with global smartphone brands help suppliers secure long-term contracts and accelerate the adoption of foldable and under-display modules. Competition intensifies as firms pursue innovations in micro-OLED, transparent displays, and energy-saving architecture, allowing each brand to strengthen its position while meeting changing consumer expectations across regions.
Shape Your Report to Specific Countries or Regions & Enjoy 30% Off!
Key Player Analysis
- Visionox Technology Inc.
- Sharp Corporation
- Innolux Corporation
- BOE Technology Group Co., Ltd.
- E Ink Holdings Inc.
- Tianma Microelectronics Co., Ltd.
- Samsung Display Co., Ltd.
- AU Optronics Corp.
- Japan Display Inc.
- LG Display Co., Ltd.
Recent Developments
- In October 2025, Japan Display Inc. (JDI): Implemented a new organizational structure (effective Oct 1, 2025) to accelerate BEYOND DISPLAY investments and focus away from low-margin LCD smartphone panels.
- In September 2025, AU Optronics Corp. (AUO): Industry trackers note AUO supplied microLED to wearable devices (example: first microLED smartwatch product launches citing AUO production), and AUO continued to push microLED and automotive/mobile display projects.
- In August 2025, Samsung Display Co., Ltd: Unveiled MONT FLEX™, a new foldable display brand to further differentiate its foldable OLED lineup (shown at K-Display 2025).
Report Coverage
The research report offers an in-depth analysis based on Resolution Category, Screen Size Category, Refresh Rate and Geography. It details leading market players, providing an overview of their business, product offerings, investments, revenue streams, and key applications. Additionally, the report includes insights into the competitive environment, SWOT analysis, current market trends, as well as the primary drivers and constraints. Furthermore, it discusses various factors that have driven market expansion in recent years. The report also explores market dynamics, regulatory scenarios, and technological advancements that are shaping the industry. It assesses the impact of external factors and global economic changes on market growth. Lastly, it provides strategic recommendations for new entrants and established companies to navigate the complexities of the market.
Future Outlook
- OLED and AMOLED panels will expand across mid-range and premium smartphones.
- High-refresh-rate displays will become standard, even in budget models.
- Foldable and rollable screens will gain wider adoption as durability improves.
- Under-display cameras and sensors will support cleaner full-screen designs.
- LTPO technology will grow due to its power-saving and adaptive refresh features.
- Larger screen sizes will dominate as users demand better media and gaming experiences.
- Micro-OLED and micro-LED innovations will enhance brightness and energy efficiency.
- Manufacturers will increase investment in flexible substrates and ultra-thin glass.
- Regional production capacity in Asia Pacific will continue to strengthen global supply.
- Sustainability-focused displays will rise, with lower energy use and recycled materials.


