
Micro LED Display Market: USD 550.6 million in 2025, Moving From Showroom Walls to Wrists and Glasses
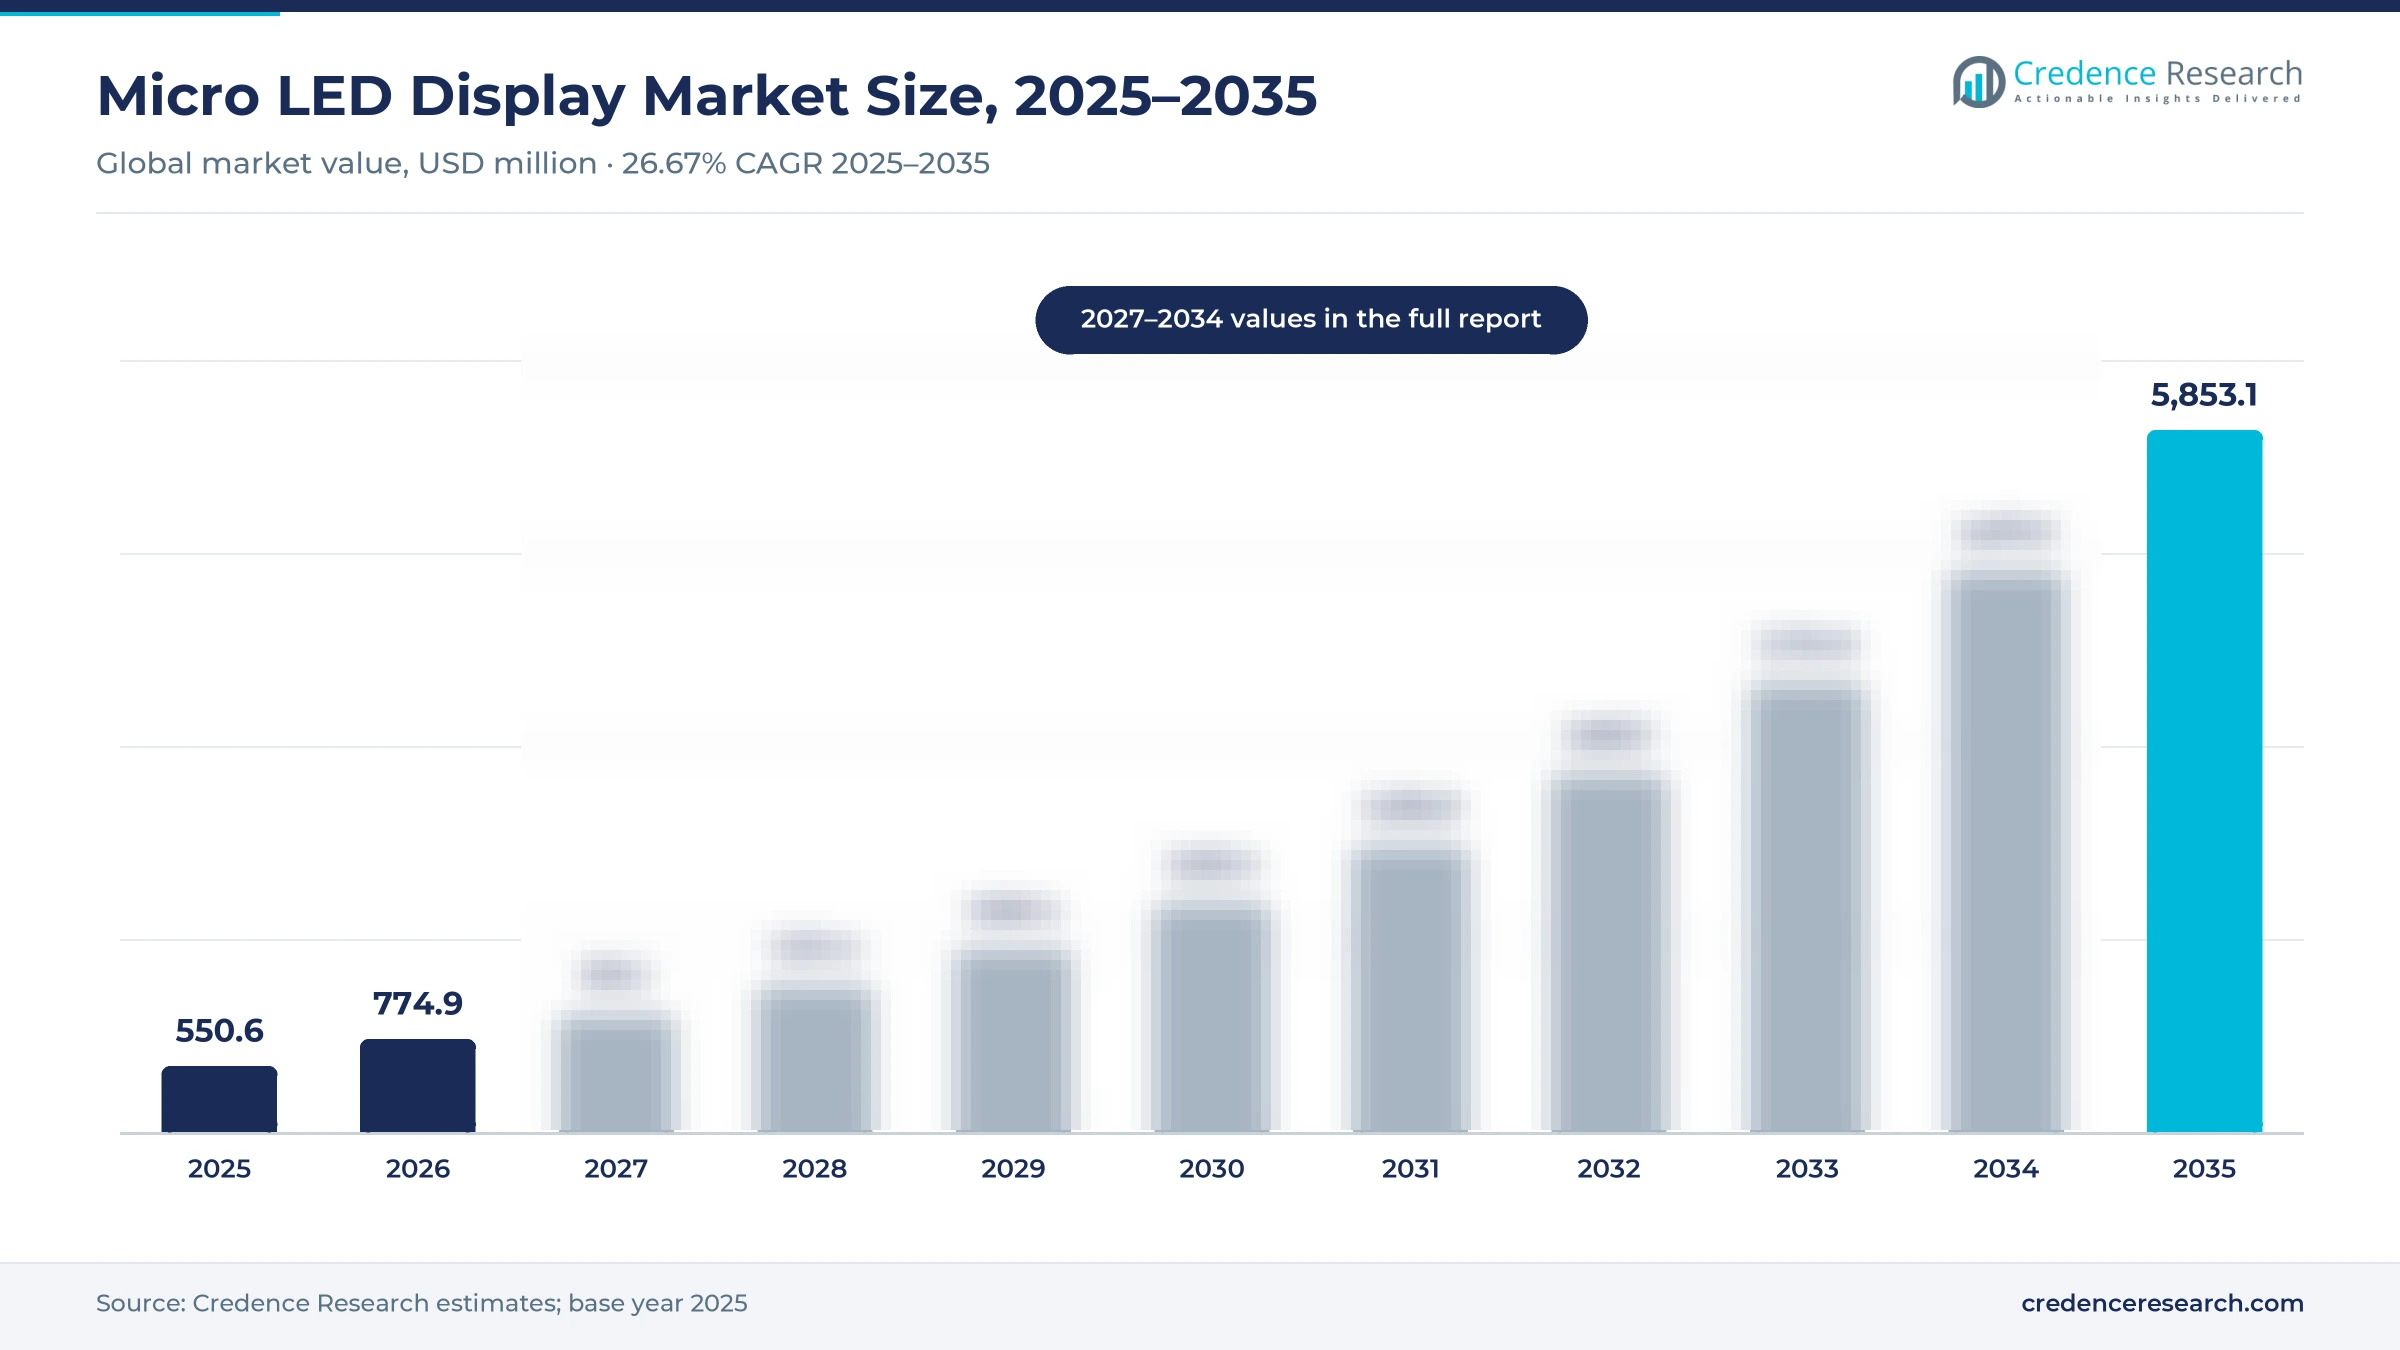
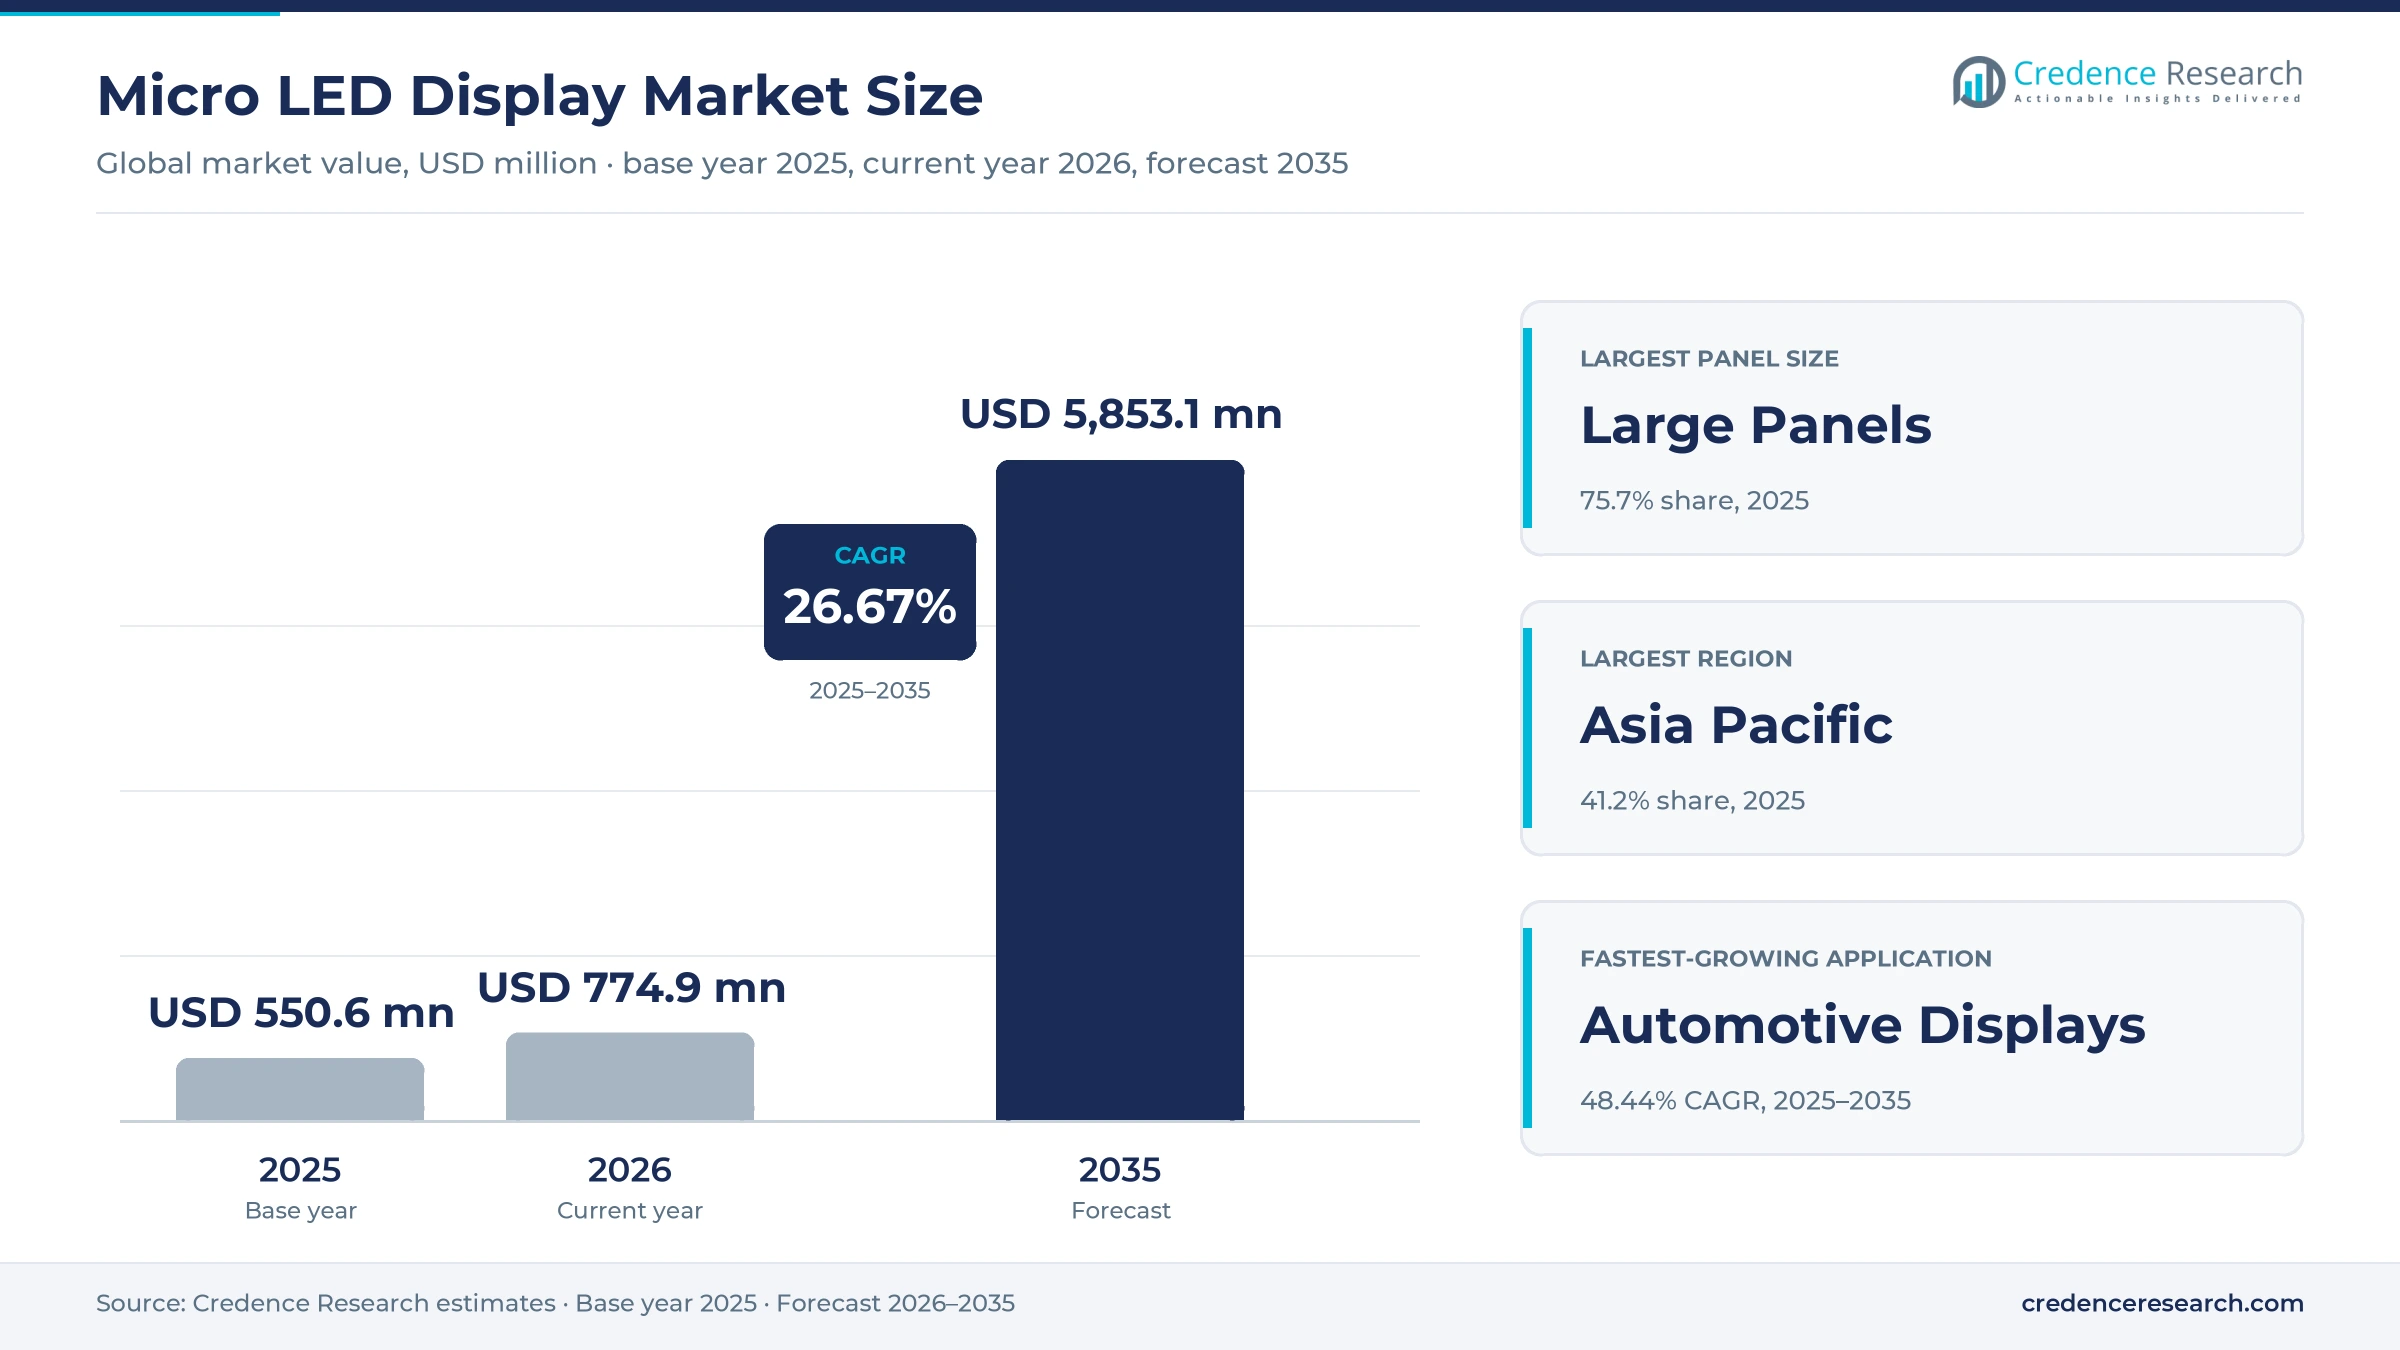
Micro LED displays, counted as finished panels and modules, formed a market worth USD 550.6 million in 2025; we forecast USD 5,853.1 million by 2035, a CAGR of 26.67% over 2025–2035. Garmin's first micro LED watch and a wave of AR glasses lift our estimate for 2026, the current year, to USD 774.9 million.
These are our own estimates. We built them application by application from company launch disclosures and supplier announcements, then tested them against what the leading panel makers say about their production status. None of the numbers is borrowed from a third-party market study.
Our central view: micro LED stopped being a showroom technology in 2025. For seven years, the format lived almost entirely in large modular walls such as Samsung's The Wall. Then Garmin put an AUO micro LED panel on a wrist, and AR glasses makers began shipping micro LED projectors in volume. Large panels still hold a 75.7% share of value, but the growth now comes from small screens.
What do we count as a micro LED display?
We count finished displays and display modules whose pixels are self-emissive inorganic LEDs below roughly 100 μm, valued at the price the panel or module maker realises. The sizing covers six applications and three panel-size classes.
The market includes:
- Large-format micro LED walls and televisions, such as Samsung The Wall, Sony Crystal LED and LG MAGNIT, sold as complete display systems.
- Small and medium panels on glass or LTPS backplanes for smartwatches, automotive head-up displays, clusters and transparent signage.
- Micro LED microdisplays and projector modules on silicon backplanes for AR glasses and other near-eye devices.
We leave out:
- Micro LED chips, epiwafers, mass-transfer services and driver ICs, which belong to our micro LED chips and components outlook. We count their value only once, inside the finished display, which also carries backplane, transfer, repair and assembly value; that is why our display market sits well above the chip-level market.
- LCD televisions that use mini LED or micro-sized RGB LEDs as a backlight, such as Samsung's Micro RGB range; the image there is still formed by liquid crystal.
- Conventional SMD and COB direct-view walls built with larger chips, which sit in the fine-pitch LED display category.
Why is the base still small?
Cost has kept micro LED in niches. Every pixel needs three separately grown, tested and placed LED chips, and a 4K screen carries tens of millions of them. Yield losses at transfer and repair stages push the cost per square metre far above OLED or LCD. That is why the 2025 market sits at a few hundred million dollars, while the panel industry around it is worth far more.
The cost curve is now bending. PlayNitride, which received Taiwan's National Industrial Innovation Award, reports chip yield of 99.9% and says it built the world's first micro LED production line in Zhunan in 2019, according to the Ministry of Economic Affairs. JBD said in May 2026 that wafer-reconstitution yield on its new 12-inch platform had passed 98%. Higher yields at those stages feed straight into panel cost.
Report Attributes
| Attribute | Details |
|---|---|
| Market size (2025) | USD 550.6 million |
| Market size (2026) | USD 774.9 million |
| Market size (2035) | USD 5,853.1 million |
| CAGR (2025–2035) | 26.67% |
| Base year | 2025 |
| Forecast period | 2026–2035 |
| Largest panel size | Large Panels (75.7%) |
| Fastest-growing panel size | Micro-displays (38.96% CAGR) |
| Largest application | Commercial Video Walls & Signage (60.1%) |
| Fastest-growing application | Automotive Displays (HUDs & Dashboards) (48.44% CAGR) |
| Largest region | Asia Pacific (41.2%) |
| Fastest-growing region | Asia Pacific (28.36% CAGR) |
| Segments covered | Panel Size, Application, Region |
How did we size the market?
We used two lenses and kept the estimate only where they agreed:
- Application build. For each application we estimated shipments of finished displays or modules and an average selling price at the panel or module maker, then added up the values.
- Supplier check. We tested the build against the production status, product launches and customer lists that Samsung, Sony, LG, AUO, PlayNitride, JBD and Garmin have disclosed, and against the chip-level estimate on our sibling page.
The full report sets out the shipments, prices and values behind each segment, region and year.
Micro LED Display Market Insights
- The micro LED display market was worth USD 550.6 million in 2025 and we forecast USD 5,853.1 million by 2035, a 26.67% CAGR.
- We estimate the market at USD 774.9 million in 2026, the current year.
- Large panels hold a 75.7% share in 2025; micro-displays are the fastest-growing panel class at 38.96% a year.
- Commercial video walls and signage lead applications with a 60.1% share; automotive displays grow fastest at 48.44%.
- Asia Pacific is the largest and fastest-growing region, with a 41.2% share and a 28.36% CAGR.
- Garmin's fēnix 8 Pro MicroLED, built on an AUO panel, put micro LED on a mass-market wrist in September 2025.
Three Panel Classes, Six Applications, Very Different Growth Rates
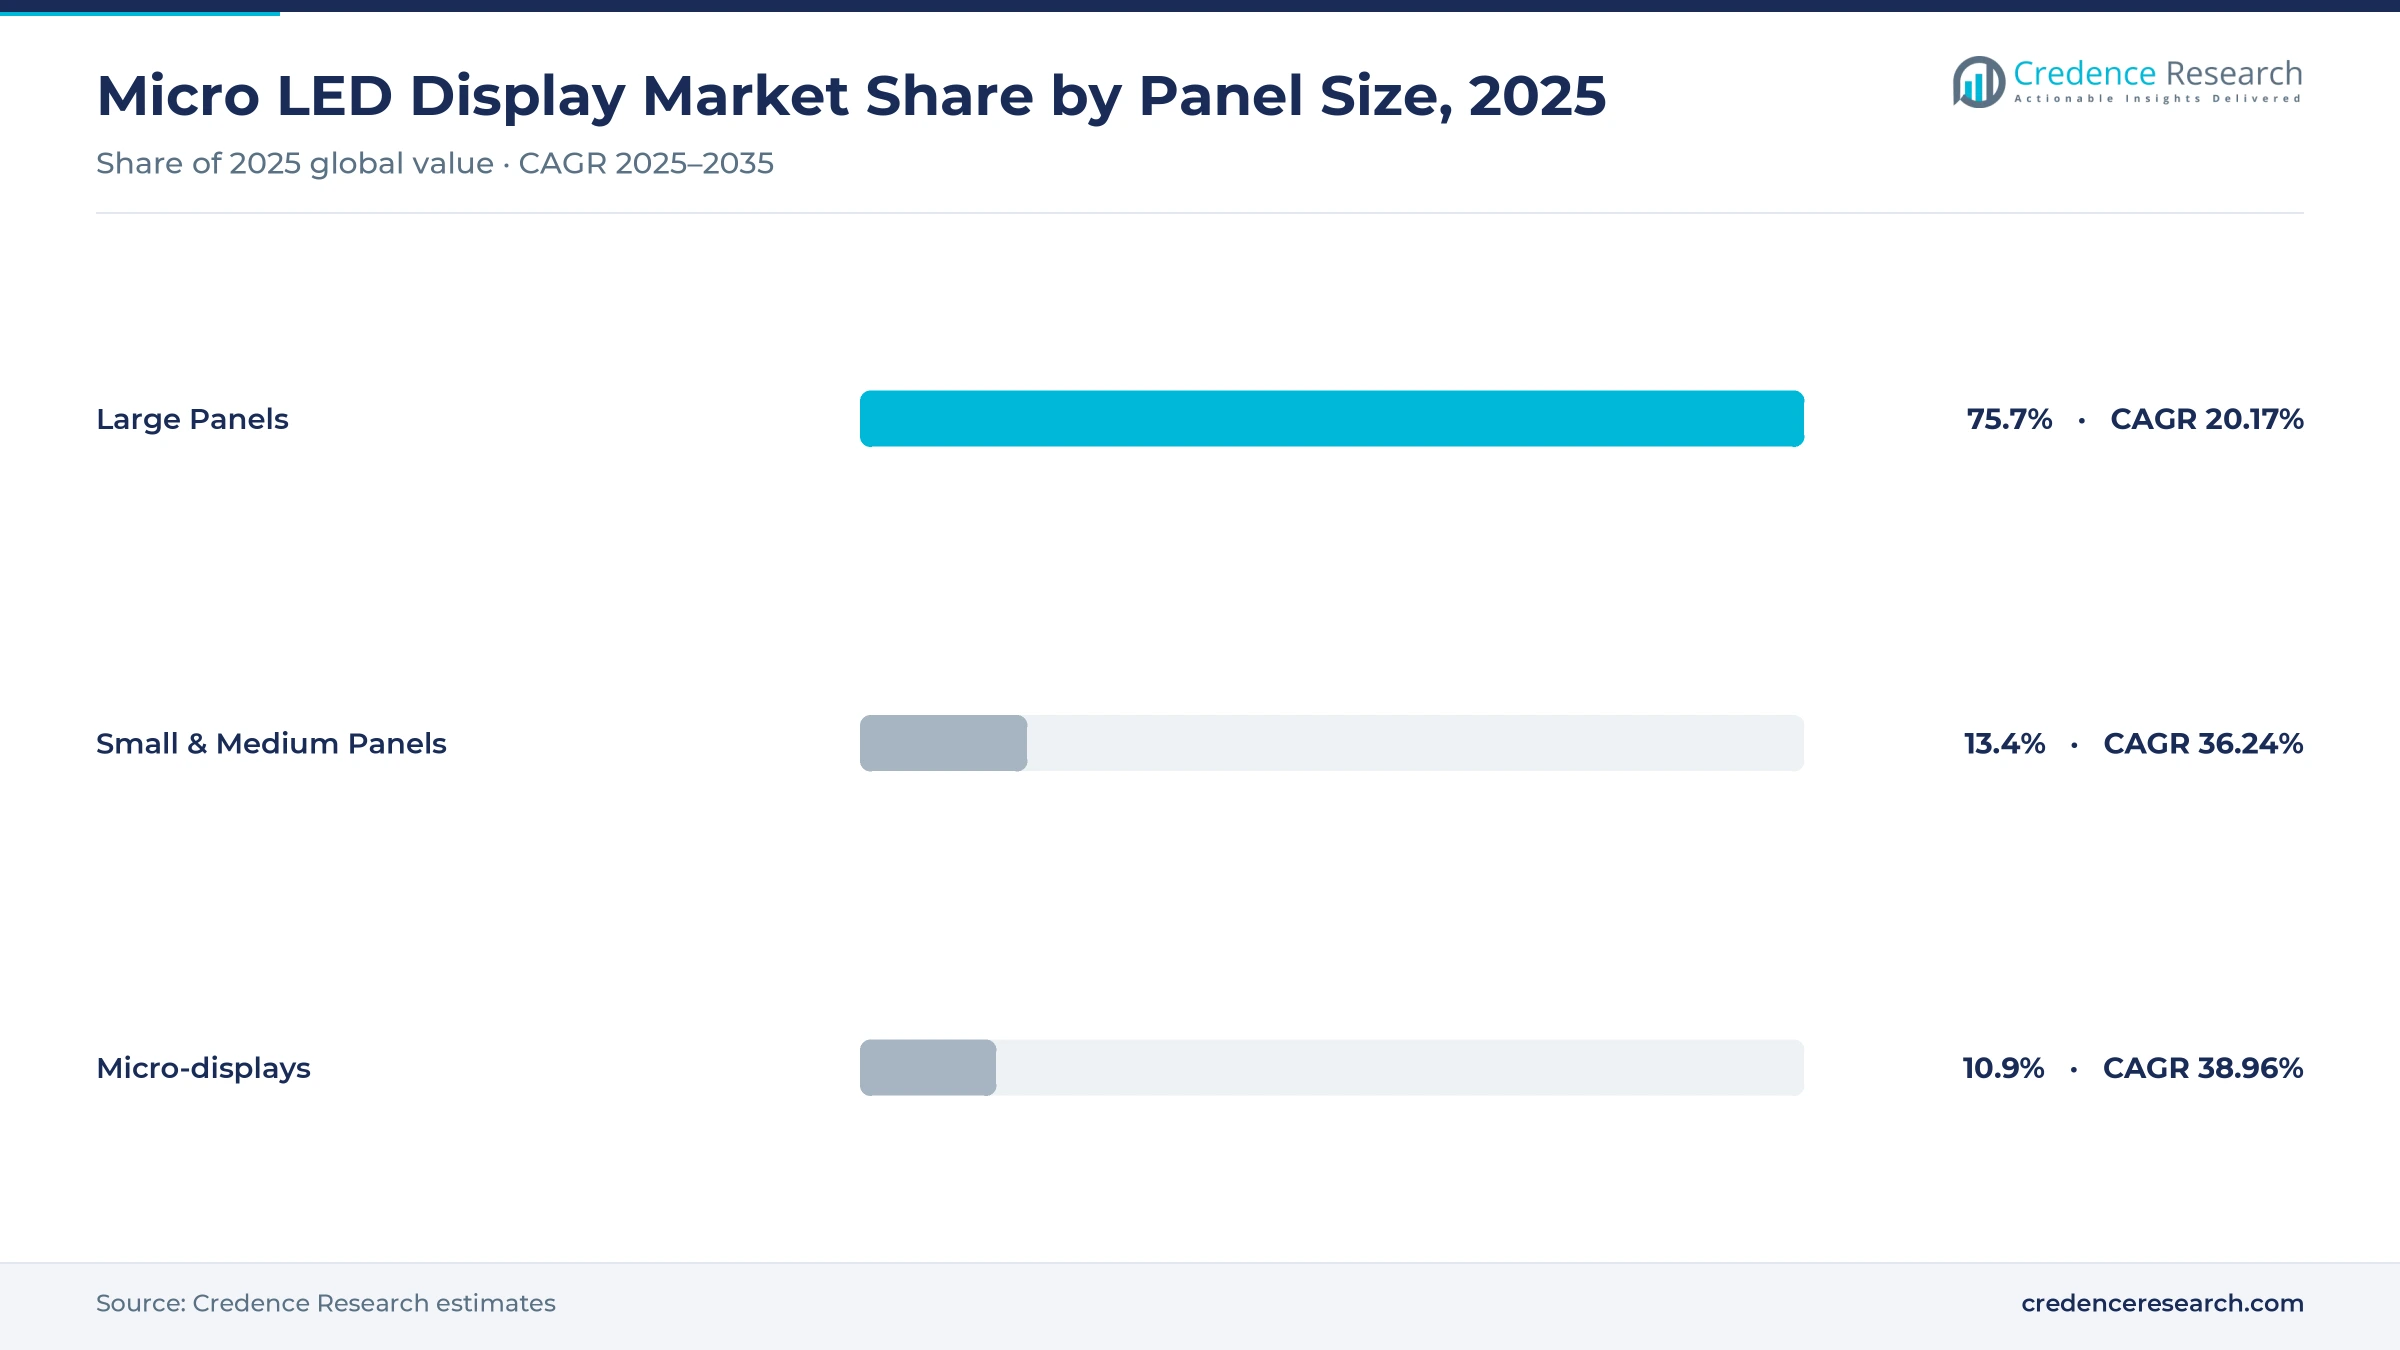
Large panels dominate value today, with a 75.7% share in 2025. Micro-displays grow fastest, at 38.96% a year, followed by small and medium panels at 36.24%.
| Panel Size | Share 2025 | CAGR 2025–2035 |
|---|---|---|
| Large Panels | 75.7% | 20.17% |
| Small & Medium Panels | 13.4% | 36.24% |
| Micro-displays | 10.9% | 38.96% |
Why do large panels lead?
Large panels hold a 75.7% share because a single wall or home cinema screen carries a very high price. Samsung's The Wall, Sony's Crystal LED and LG's MAGNIT anchor the class, joined by BOE's glass-based micro LED walls in China. Growth runs at 20.17% a year, the slowest of the three classes, as the price per square metre falls.
What sits in small and medium panels?
Small and medium panels hold a 13.4% share and grow at 36.24% a year. Watches, head-up displays, clusters and transparent signage modules fall here. AUO's LTPS-based watch panel is the volume product today, with automotive panels next in line.
How fast are micro-displays growing?
Micro-displays hold a 10.9% share and grow at 38.96% a year, the fastest rate of any panel class. Almost all of the value comes from AR glasses, where micro LED on silicon competes with LCoS and OLED-on-silicon. JBD supplies the largest part of the class.
Which applications buy the most?
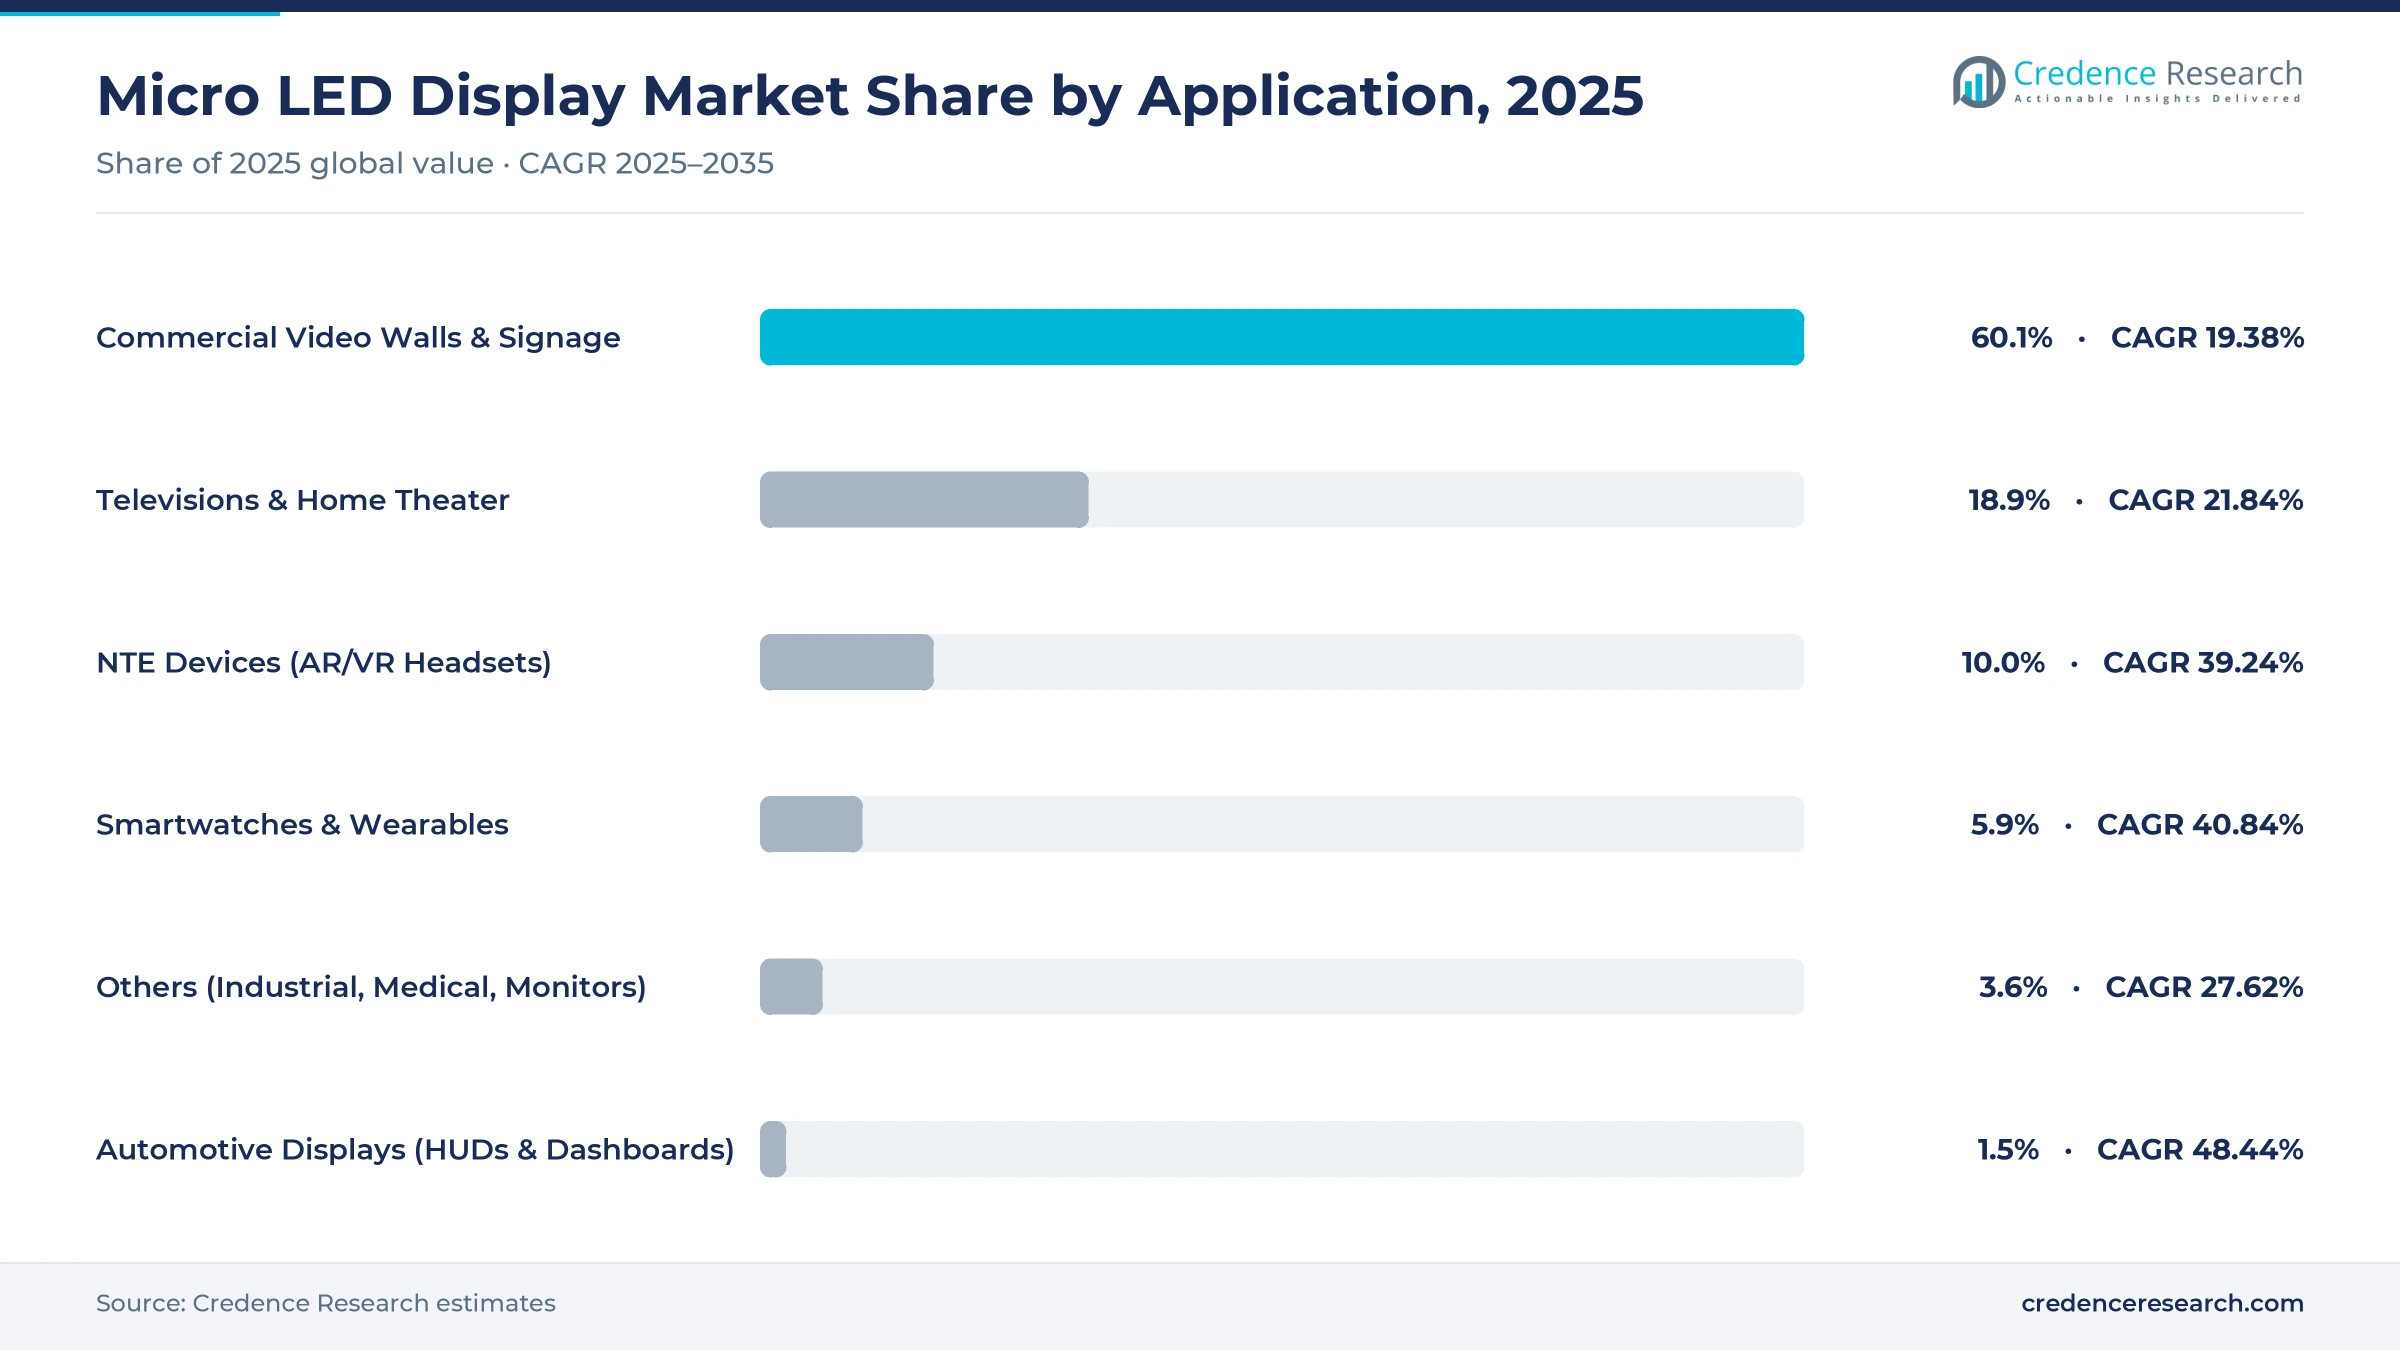
Commercial video walls and signage are the largest application at 60.1% of 2025 value, followed by televisions and home theater at 18.9%. Automotive displays grow fastest at 48.44% a year, from the smallest base.
| Application | Share 2025 | CAGR 2025–2035 |
|---|---|---|
| Commercial Video Walls & Signage | 60.1% | 19.38% |
| Televisions & Home Theater | 18.9% | 21.84% |
| NTE Devices (AR/VR Headsets) | 10.0% | 39.24% |
| Smartwatches & Wearables | 5.9% | 40.84% |
| Others (Industrial, Medical, Monitors) | 3.6% | 27.62% |
| Automotive Displays (HUDs & Dashboards) | 1.5% | 48.44% |
Commercial video walls and signage
The segment holds a 60.1% share and grows at 19.38% a year. Buyers include broadcasters, control rooms, corporate headquarters, museums and flagship stores.
Televisions and home theater
Home screens hold an 18.9% share. Growth of 21.84% a year reflects falling prices and new active-matrix models, held back by competition from cheaper RGB-backlit LCDs.
NTE devices (AR/VR headsets)
Near-eye devices hold a 10.0% share and grow at 39.24% a year, as AR glasses with display engines move from early adopters to a wider audience.
Smartwatches and wearables
Wearables hold a 5.9% share. The segment grows at 40.84% a year as micro LED moves from one premium outdoor watch to more models and brands.
Automotive displays
Automotive holds a 1.5% share and is the fastest-growing application at 48.44% a year, led by head-up displays and transparent or shaped dashboard panels.
Others
Industrial, medical, avionics and monitor uses hold a 3.6% share and grow at 27.62% a year.
Request a Free Sample
Fill in your details and we'll send you a free sample report.
- Sample data tables & charts
- Research methodology
Market Dynamics
Five Shifts Redrawing Where the Panels Go
Trend 1: micro LED moves to LCD-style glass lines
The clearest trend is a move from PCB-based tiles to glass and LTPS backplanes. AUO's watch panel is built on LTPS, and PlayNitride splits its output between LTPS panels for cars, CMOS microdisplays and PCB tiles for large screens. BOE and TCL CSOT both own idle or ageing glass capacity, and micro LED gives them a reason to reuse it.
Trend 2: transparent and dual-sided displays enter transport and retail
AUO used Touch Taiwan 2026 to show a five-metre-tall stage of transparent micro LED modules built from P1.25 panels, and a 16.1-inch dual-sided transparent display designed for metro train doors. At SID 2025, AUO had already shown a 17.3-inch dual-sided transparent micro LED display. Transparent panels show information without blocking the view, a use case where LCD cannot compete.
Trend 3: microdisplays shift to 12-inch silicon
JBD said on 15 May 2026 that it had moved its microdisplay production from 4-inch wafers to a 12-inch reconstructed wafer platform, skipping 8-inch altogether. A 12-inch backplane matches the wafers that logic foundries already run, which brings foundry-scale cost into AR. Micro-displays hold a 10.9% share and are the fastest-growing panel class at 38.96% a year.
Trend 4: premium brands push down-market
Sony widened its Crystal LED family on 22 January 2026 with the mid-market S Series, two models at 1.25 mm and 1.56 mm pitch for offices, schools and commercial sites, available from late spring 2026, according to Sony. The step shows the premium direct-view brands chasing volume rather than only flagship projects. We expect the price gap between micro LED and fine-pitch LED to narrow through the decade.
Trend 5: shape-free and rollable panels for vehicles
Micro LED panels can be cut to shape, as Garmin's circular watch face shows, and AUO now shows a fully rollable micro LED display that stows in a tight space. Carmakers want screens that follow the curve of a dashboard or disappear into a roof lining. Automotive displays are the fastest-growing application at 48.44% a year, from a 1.5% share.
Barriers and Risks: Transfer Yield, Repair Cost and Competing Backlights
The challenges are cost, competition and supply risk, in that order. We rank transfer yield as the biggest barrier, because it sets the price gap with OLED and LCD in every application.
Is mass transfer still the bottleneck?
Yes. A watch needs a few hundred thousand chips placed correctly; a 4K television needs tens of millions. Even a 99.9% chip yield leaves thousands of dead sub-pixels on a large panel, and each has to be found and repaired. Repair time, not chip cost alone, still sets the price of large micro LED screens.
How hard is the competition from OLED and RGB backlights?
OLED keeps improving in brightness and lifetime, and it is already in mass production at a scale micro LED will not match this decade. A newer threat comes from LCDs lit by micro-sized RGB LEDs, such as Samsung's Micro RGB televisions. Shoppers see "micro" on both labels, and the backlit version costs far less. In our view, that blurs the premium story for home televisions, which is why we hold the TV segment to a 21.84% CAGR.
Do energy rules add pressure on very large screens?
They add disclosure, and with it scrutiny. The EU energy-label rules for electronic displays, Delegated Regulation (EU) 2019/2013, list MicroLED among the panel technologies a seller must declare on the product information sheet. A bright 136-inch or larger micro LED television therefore faces the same energy comparison as LCD and OLED sets, a real challenge for power-hungry walls sold into homes.
Does red emission still lag?
Red micro LEDs lose efficiency faster than blue and green as they shrink, which matters most for AR microdisplays below a few microns. Many AR glasses therefore still ship with monochrome green engines. Full-colour microdisplays at volume remain a work in progress.
Is the supply base too concentrated?
A handful of firms control the key steps: chip growth, transfer and microdisplay bonding. JBD leads near-eye micro LED supply, and AUO and PlayNitride lead small panels. A single process problem at one supplier can delay a whole product class, which keeps device makers cautious about committing flagship lines.
Where the Next Panels Come From
Can cars become the second volume market after watches?
We think so. AUO launched a 13-inch micro LED head-up display at SID 2025 and keeps adding vehicle-shaped panels. The head-up display is a natural fit because it needs high brightness in a small space. Automotive design cycles are long, so the volume arrives after 2028.
Is there room in industrial, medical and aviation screens?
These buyers value lifetime and sunlight readability more than price. The others segment holds a 3.6% share and grows at 27.62% a year, with avionics, rugged handhelds and surgical displays among the first targets.
Will luxury homes keep buying very large screens?
Yes, at the top end. LG's MAGNIT, Samsung's The Wall and Sony's Crystal LED all sell into custom home cinemas where a 136-inch or larger screen is the point of the purchase. That niche is small but steady, and it carries the highest price per square metre in the market.
Why Self-Emissive Pixels Are Winning New Screens: Brightness, Lifetime and Form Factor
How much does brightness matter outdoors?
Brightness is the reason micro LED reached the wrist first. Garmin describes the fēnix 8 Pro MicroLED as the brightest smartwatch it has made, at up to 4,500 nits, in its launch announcement of 3 September 2025. AUO supplies the 1.4-inch panel on an LTPS active-matrix backplane at 326 PPI, the same density as Garmin's other premium watches.
For an outdoor watch, readability in direct sun is the selling point, and OLED struggles to match it without burning power or ageing faster. We see that same logic in cars, cockpits and retail windows. Smartwatches and wearables hold a 5.9% share today and grow at 40.84% a year, the second-fastest rate among applications, as the format spreads from one flagship into the wider smartwatch range.
Why do AR glasses need micro LED?
Waveguide glasses lose most of their light between the projector and the eye. A see-through display that has to compete with daylight therefore needs a source far brighter than an OLED microdisplay can deliver, in a package the size of a pea. Micro LED on silicon is the only option that meets both tests today.
JBD says its Hummingbird microdisplays are in nearly 50 AR glasses models, including Rokid Glasses, Alibaba's Quark Glasses, RayNeo X3 Pro and INMO GO2. In October 2025 it launched the Roadrunner platform with a 2.5-μm pixel pitch and 10,160 PPI, aimed at a phased rollout in the second half of 2026. Near-eye devices hold a 10.0% share and grow at 39.24% a year, carried by the AR glasses build-out.
What does an active-matrix backplane change?
Early large micro LED walls used passive drive, which limits brightness uniformity and drives up power. LG's 136-inch MAGNIT, announced on 9 December 2025 for a US launch at CES 2026, uses an active-matrix design in which each pixel is individually controlled, according to LG. Moving to active matrix on glass lets panel makers reuse LCD-era thin-film transistor lines, which lowers the cost of every square metre.
Why do commercial buyers keep paying a premium?
Corporate lobbies, broadcast studios, control rooms and luxury retail buy on image quality, lifetime and the absence of seams. Micro LED walls deliver true blacks, very wide viewing angles and no burn-in, and they can be built to almost any size or shape. Commercial walls and signage hold a 60.1% share in 2025, the largest of any application, and grow at 19.38% a year.
How are governments helping?
Public money targets the hardest steps. The EU's EIC Accelerator funds the iSMILE project, which develops microLED modules for AR glasses and optical links from September 2024 to January 2027. In our view, such programmes shorten the path from lab yield to factory yield.
Asia Builds the Panels and Buys the Glasses; North America Buys the Walls
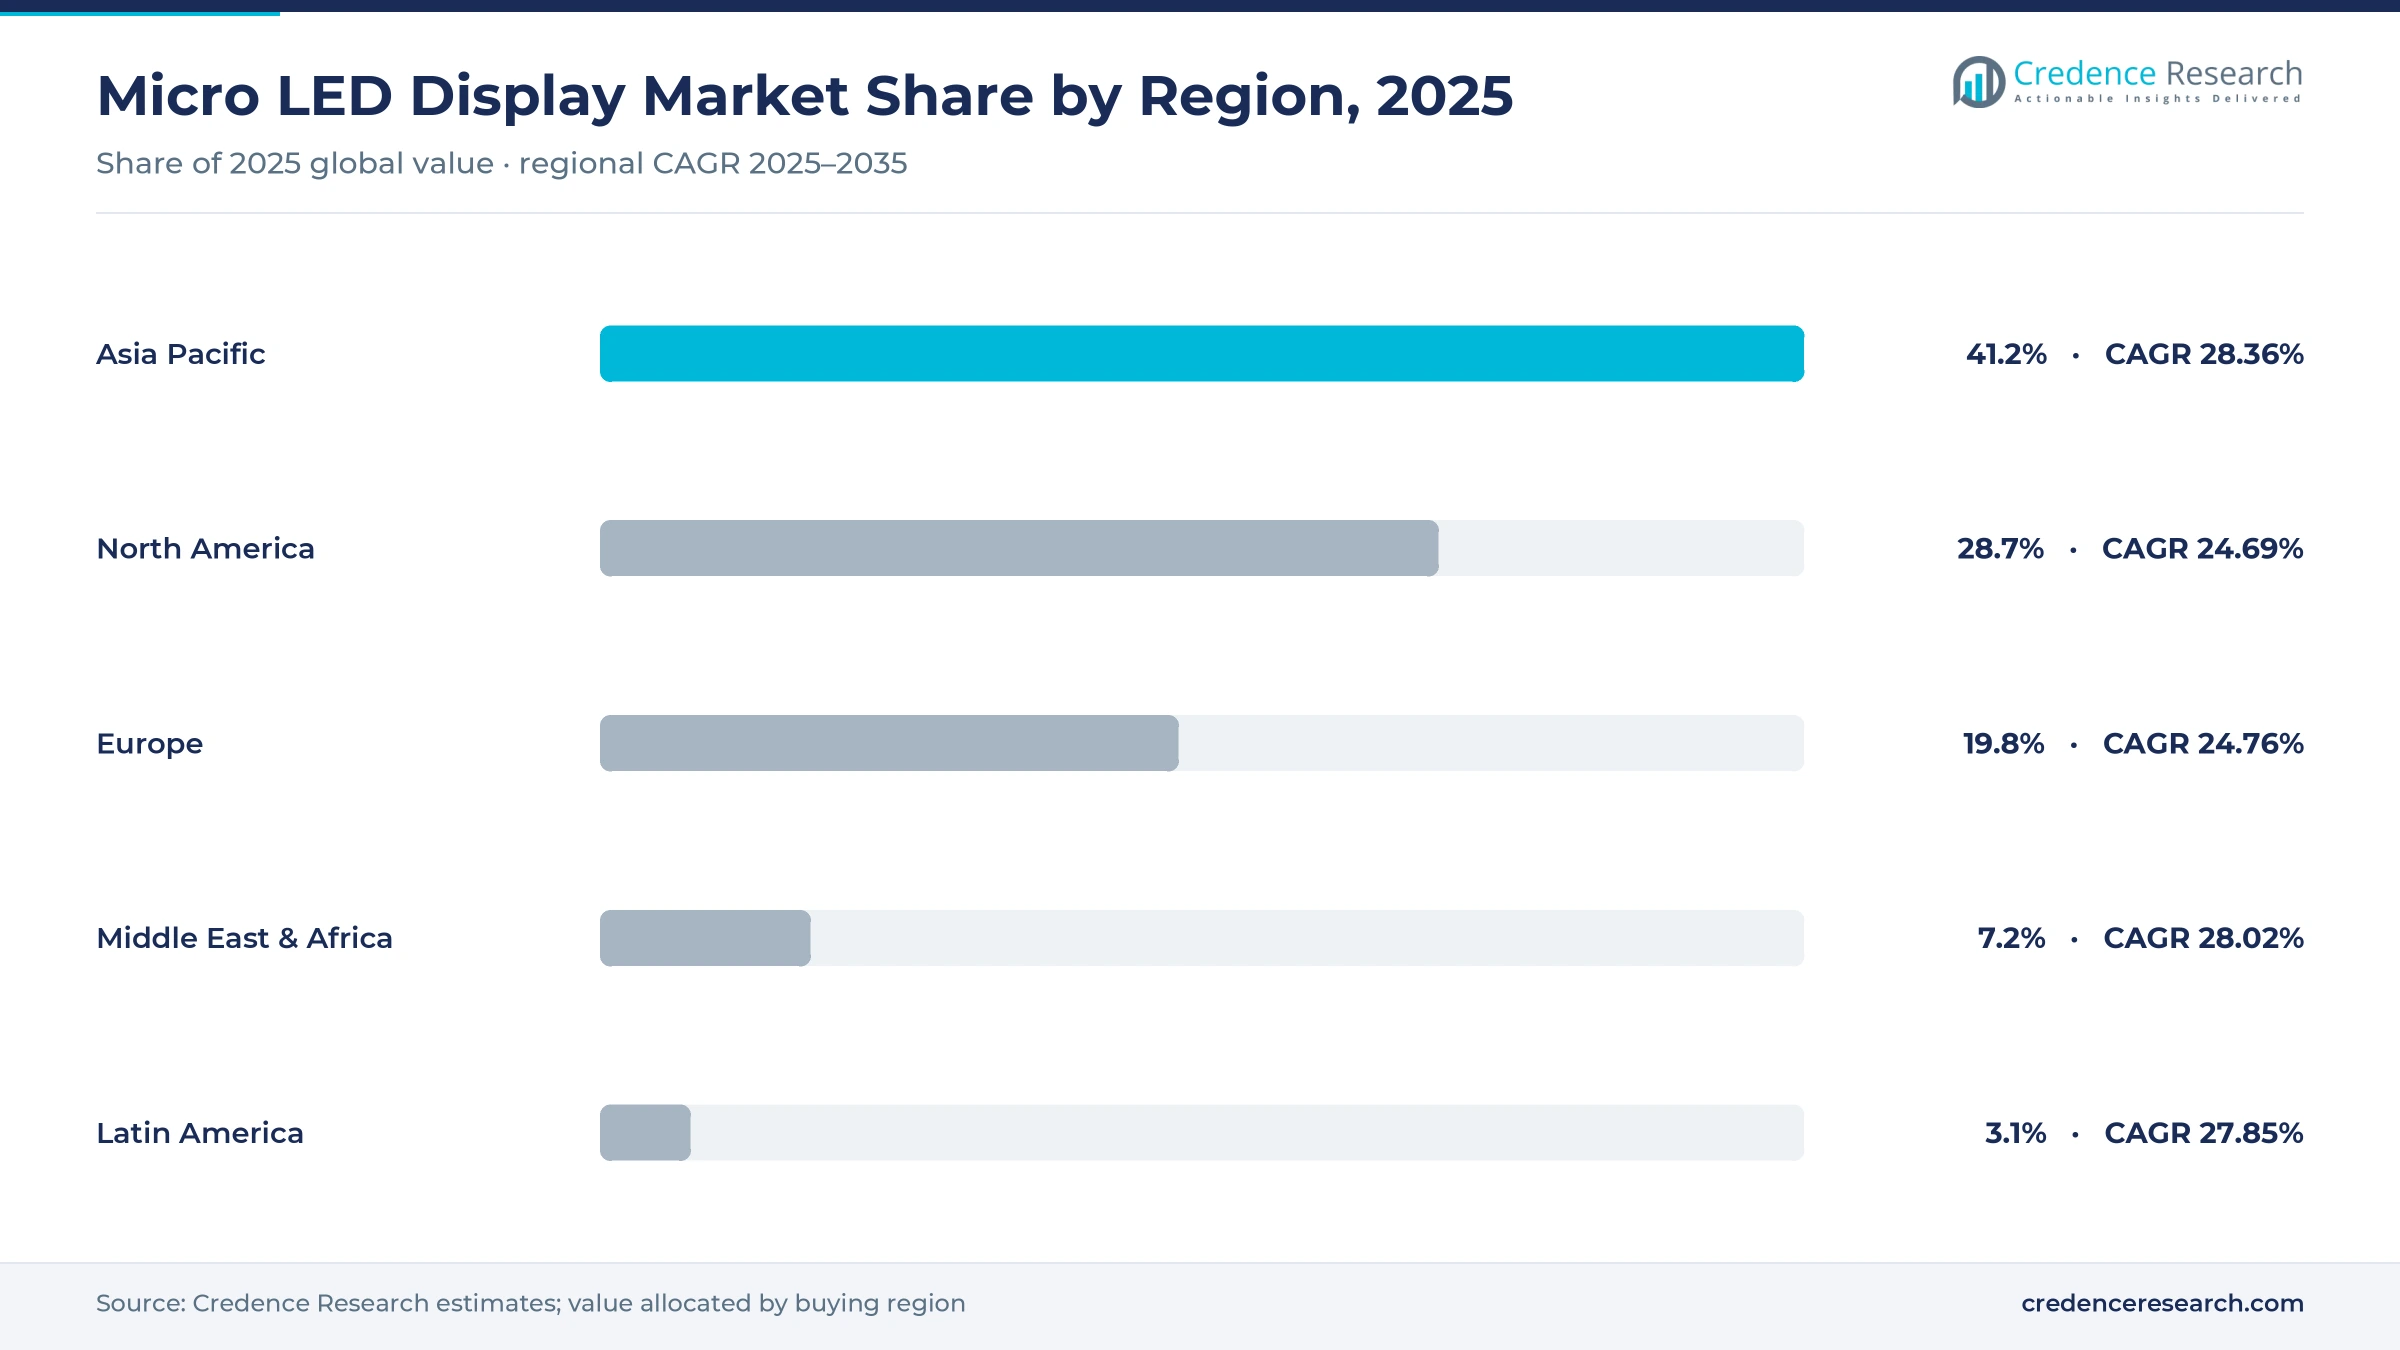
We count value where the finished display is bought, not where it is made. Almost every panel is produced in Taiwan, Korea, China or Japan, but large walls and premium watches sell heavily in North America and Europe. Asia Pacific is the largest and fastest-growing region at 28.36% a year.
| Region | Share 2025 | CAGR 2025–2035 |
|---|---|---|
| Asia Pacific | 41.2% | 28.36% |
| North America | 28.7% | 24.69% |
| Europe | 19.8% | 24.76% |
| Middle East & Africa | 7.2% | 28.02% |
| Latin America | 3.1% | 27.85% |
Asia Pacific
Asia Pacific holds a 41.2% share of 2025 value and grows at 28.36% a year. China leads demand for AR glasses with micro LED engines and for glass-based micro LED walls, while Korea and Japan buy premium commercial walls. Taiwan supplies much of the world's small-panel output through AUO and PlayNitride.
North America
North America holds a 28.7% share and grows at 24.69% a year. Custom home cinemas, corporate lobbies, sports venues and virtual production stages buy the largest walls, and the region is a major market for premium outdoor watches.
Europe
Europe holds a 19.8% share and grows at 24.76% a year. Broadcast studios, automotive design programmes in Germany and luxury retail drive demand, and EU-funded projects support a local microLED supply chain for AR.
Middle East & Africa
The Middle East & Africa holds a 7.2% share and grows at 28.02% a year. Gulf states buy very large walls for hotels, malls, airports and event venues; Africa adds little so far.
Latin America
Latin America holds a 3.1% share and grows at 27.85% a year. Brazil and Mexico account for most demand, mainly corporate and retail walls.
Launches, Platforms and Public Programmes, 2024–2026
| Date | Development | Why it matters |
|---|---|---|
| May 2026 | JBD moved micro LED microdisplay production from 4-inch wafers to a 12-inch reconstructed wafer platform, reporting reconstitution yield above 98%. | Brings foundry-scale wafer cost to AR display engines. |
| March 2026 | AUO previewed a transparent micro LED stage, a 16.1-inch dual-sided display for metro train doors and a rollable vehicle panel for Touch Taiwan 2026. | Opens transport and retail uses that LCD and OLED cannot serve. |
| January 2026 | Sony announced the Crystal LED S Series, two mid-market models at 1.25 mm and 1.56 mm pitch for offices, schools and commercial sites. | Takes a premium direct-view brand to lower price points. |
| December 2025 | LG announced a 136-inch 4K MAGNIT with an active-matrix micro LED panel for a US launch at CES 2026. | Active-matrix drive lowers power and improves uniformity on large screens. |
| October 2025 | JBD launched the Roadrunner platform with a 2.5-μm pixel pitch and 10,160 PPI, for a phased rollout in the second half of 2026. | Shrinks AR projectors and raises resolution for everyday glasses. |
| September 2025 | Garmin launched the fēnix 8 Pro MicroLED with a 1.4-inch AUO panel, the first smartwatch with a micro LED display. | Moves micro LED from showroom walls to a consumer wrist. |
| May 2025 | AUO showed a 13-inch micro LED head-up display and a 17.3-inch dual-sided transparent micro LED display at SID 2025. | Signals automotive and transparent panels as the next volume uses. |
| February 2025 | Samsung used a 462-inch micro LED media facade at the entrance to its ISE 2025 booth. | Shows the scale that modular walls now reach. |
| September 2024 | The EU-funded iSMILE project began developing microLED modules for AR glasses and optical interconnects, running to January 2027. | Builds a European micro LED supply chain for near-eye displays. |
Need a Custom Version of This Report?
Tailor the scope, geography, or segments to your exact requirements.
- Custom geography or segment scope
- Direct access to our analyst team
Brand Owners, Panel Makers and Microdisplay Specialists
Supply splits into three groups. Brand owners sell finished large-format systems under their own names. Panel makers build small and medium micro LED panels for device brands. Microdisplay specialists bond micro LED arrays to silicon for near-eye engines.
Who sells the large screens?
- Samsung Electronics launched The Wall in 2018 as a 146-inch modular micro LED display and now sells consumer, all-in-one and commercial versions; a 462-inch micro LED facade greeted visitors to its booth at ISE 2025.
- Sony Group sells Crystal LED for studios, virtual production and corporate sites, and added the mid-market S Series in January 2026.
- LG Electronics sells the MAGNIT range and announced a 136-inch active-matrix MAGNIT for luxury home cinemas in December 2025.
- BOE Technology Group and TCL CSOT bring LCD-scale glass capacity to micro LED walls and televisions in China.
Who makes small and medium panels?
AUO is the clearest leader. It supplies the panel in Garmin's fēnix 8 Pro MicroLED, has shown head-up, transparent and rollable micro LED displays, and calls micro LED a core technology platform in its roadmap. PlayNitride supplies chips and panel technology across watch, automotive and large-format work.
Who leads near-eye micro LED?
In our view, JBD is the volume leader in AR microdisplays, with Hummingbird engines in nearly 50 glasses models and the Roadrunner platform next. European and US start-ups, many backed by public research funding, work on full-colour and monolithic alternatives.
Which device brands set demand?
Garmin is the first watch brand to ship a micro LED display. AR glasses brands such as Rokid, RayNeo and INMO depend on JBD engines, while the largest phone and watch makers have so far stayed with OLED.
How concentrated is the market?
We estimate that the five largest suppliers hold well over half of 2025 value, because large walls and near-eye engines each rest on a few firms. Concentration should ease after 2028 as Chinese glass-panel makers scale up and more device brands qualify second sources.
Frequently Asked Questions
How big is the micro LED display market?
What counts as a micro LED display?
Which application is largest?
Which region leads the micro LED display market?
Why did micro LED reach smartwatches first among small screens?
Who are the main micro LED display suppliers?
What holds micro LED displays back?
How was the micro LED display market sized?
Table of Content
Chapter 1 Market Segmentation
- 1.1 Segmentation Framework
- 1.1.1 Product and Service Classification
- 1.1.2 Application and End-Use Classification
- 1.1.3 Technology and Solution Classification
- 1.1.4 Customer and Distribution Channel Classification
- 1.1.5 Geographic Segmentation
- 1.1.6 Market Segment Definitions and Boundaries
- 1.2 By Panel Size
- 1.2.1 Large Panels
- 1.2.2 Small & Medium Panels
- 1.2.3 Micro-displays
- 1.3 By Application
- 1.3.1 Commercial Video Walls & Signage
- 1.3.2 Televisions & Home Theater
- 1.3.3 NTE Devices (AR/VR Headsets)
- 1.3.4 Smartwatches & Wearables
- 1.3.5 Automotive Displays (HUDs & Dashboards)
- 1.3.6 Others (Industrial, Medical, Monitors)
Chapter 2 Introduction
- 2.1 Report Objectives and Scope
- 2.2 Product Definition and Industry Terminology
- 2.3 Market Inclusions and Exclusions
- 2.4 Research Process
- 2.4.1 Primary Research and Expert Interviews
- 2.4.2 Secondary Research and Source Review
- 2.4.3 Top-Down and Bottom-Up Estimation
- 2.4.4 Data Triangulation and Verification
- 2.5 Market Size Measurement Basis
- 2.5.1 2025: USD 550.6 million → 2035: USD 5,853.1 million
- 2.6 Historical and Forecast Reference Periods
- 2.6.1 Historical Period: 2018-2025
- 2.6.2 Base Year: 2025
- 2.6.3 Forecast Period: 2025-2035
- 2.7 Research Assumptions and Limitations
Chapter 3 Executive Summary
- 3.1 Market Snapshot and Key Findings
- 3.2 Base-Year Market Size, 2025
- 3.3 Forecast Market Size, 2035
- 3.4 Revenue and Volume Growth Outlook
- 3.5 Key Demand and Supply Indicators
- 3.6 Leading Market Segments
- 3.7 Fastest-Growing Market Opportunities
- 3.8 Regional Performance Highlights
- 3.9 Technology and Industry Transformation
- 3.10 Competitive Landscape Summary
- 3.11 Analyst View and Strategic Implications
Chapter 4 Global Micro LED Display Market Trends and Developments
- 4.1 Historical Industry Development, 2018-2025
- 4.2 Recent Market Trends and Developments
- 4.3 Demand and Customer Behavior Trends
- 4.4 Technology and Product Innovation
- 4.5 Artificial Intelligence, Automation and Digitalization
- 4.6 Local Manufacturing and Supply Chain Realignment
- 4.7 Industry Partnerships, Mergers and Acquisitions
- 4.8 Sustainability and Circular Economy Developments
- 4.9 Government and Private Sector Investment Trends
- 4.10 Emerging Business Models and Commercialization
- 4.11 Industry Developments and Announcements
Chapter 5 Global Micro LED Display Market Production, Supply and Demand Analysis
- 5.1 Demand Trend and Consumption Analysis, 2018-2025
- 5.2 Demand Forecast, 2025-2035
- 5.3 Production and Output Trend, 2018-2025
- 5.4 Production and Output Forecast, 2025-2035
- 5.5 Installed Capacity and Capacity Utilization
- 5.6 Company-Wise Production Plants and Statistics
- 5.6.1 Installed Production Capacity
- 5.6.2 Actual Production
- 5.6.3 Planned Capacity and Expansion Targets
- 5.7 Supply Chain Structure and Procurement Trends
- 5.8 Supply-Demand Gap and Bottlenecks
- 5.9 Import Dependence and Sourcing Structure
- 5.10 Contract Manufacturing and Outsourcing
- 5.11 Regional Supply and Demand Concentration
Chapter 6 Global Micro LED Display Market Pricing Analysis
- 6.1 Pricing Structure and Measurement
- 6.2 Historical Pricing Trends, 2018-2025
- 6.3 Pricing Outlook, 2025-2035
- 6.4 Average Selling Price and Unit Economics
- 6.5 Pricing by Product and Market Segment
- 6.6 Geographic Pricing Differences
- 6.7 Key Input, Energy, Labor and Logistics Costs
- 6.8 Contract Pricing and Purchasing Models
- 6.9 Pricing Sensitivity and Competitive Positioning
- 6.10 Price, Margin and Profitability Implications
Chapter 7 Global Micro LED Display Market Dynamics
- 7.1 Market Growth Drivers
- 7.1.1 Demand-Side Drivers
- 7.1.2 Technology and Innovation Drivers
- 7.1.3 Infrastructure and Investment Drivers
- 7.1.4 Regulatory and Policy Drivers
- 7.2 Market Restraints
- 7.2.1 Cost and Affordability Constraints
- 7.2.2 Technology and Adoption Barriers
- 7.2.3 Supply Chain and Operational Constraints
- 7.3 Market Challenges
- 7.3.1 Competitive Pressure and Margin Erosion
- 7.3.2 Skills, Infrastructure and Implementation Gaps
- 7.4 Emerging Market Opportunities
- 7.5 Market Dynamics Impact and Time-Horizon Assessment
Chapter 8 Global Micro LED Display Value Chain Analysis
- 8.1 Industry Value Chain Overview
- 8.2 Upstream Suppliers and Critical Inputs
- 8.3 Technology and Component Providers
- 8.4 Manufacturing or Service Delivery
- 8.5 Distribution, Channel Partners and Integrators
- 8.6 Downstream Applications and End Users
- 8.7 Value Addition and Profit Pools
- 8.8 Vertical Integration and Outsourcing
- 8.9 Supplier Concentration and Risk
- 8.10 Supply Chain Localization and Resilience
Chapter 9 Global Micro LED Display Market Regulations and Policies
- 9.1 Relevant Laws, Standards and Compliance Frameworks
- 9.2 Product, Service, Safety and Quality Requirements
- 9.3 Government Policies, Incentives and Subsidies
- 9.4 Imports, Exports and Trade Barriers
- 9.5 Public Procurement and Local Content Requirements
- 9.6 Environmental and Sustainability Compliance
- 9.7 Upcoming Policy Changes and Market Implications
Chapter 10 Global Micro LED Display Market Hotspots and Opportunities
- 10.1 Market Opportunity Mapping and Growth Hotspots
- 10.2 High-Growth Applications and Customer Groups
- 10.3 Underserved Markets and White-Space Opportunities
- 10.4 Emerging Technology and Product Opportunities
- 10.5 New Capacity and Investment Hotspots
- 10.6 Market Entry and Expansion Opportunities
- 10.7 Distribution and Partnership Opportunities
- 10.8 Near-Term and Long-Term Commercial Potential
- 10.9 Opportunity Attractiveness and Execution Risks
Chapter 11 Global Micro LED Display Market Outlook, 2025-2035
- 11.1 Market Size and Analysis
- 11.1.1 Revenue (Market Measurement: 2025: USD 550.6 million → 2035: USD 5,853.1 million)
- 11.1.2 Market Volume and Quantity Sold
- 11.1.3 Historical Market Size, 2018-2025
- 11.1.4 Base-Year Market Size, 2025
- 11.2 Market Forecast, 2025-2035
- 11.2.1 Revenue Forecast to 2035
- 11.2.2 Volume Forecast to 2035
- 11.2.3 CAGR and Year-on-Year Growth
- 11.2.4 Incremental Revenue Opportunity
- 11.3 Forecast Assumptions and Scenario Analysis
- 11.3.1 Base-Case Forecast
- 11.3.2 Optimistic and Conservative Scenarios
- 11.3.3 Technology, Pricing and Policy Sensitivities
- 11.4 Market Attractiveness and Growth Outlook
Chapter 12 Global Micro LED Display Market Segmentation and Outlook
- 12.1 Segmentation Summary and Market Shares, 2025
- 12.2 Largest and Fastest-Growing Segments
- 12.3 By Panel Size - Market Size and Forecast, 2025-2035
- 12.3.1 Segment Definition and Scope
- 12.3.2 Historical Market Size, 2018-2025
- 12.3.3 Revenue Forecast, 2025-2035
- 12.3.4 Volume Forecast, 2025-2035
- 12.3.5 Base-Year Market Share, 2025
- 12.3.6 Segment CAGR and Growth Drivers
- 12.3.7 Subsegment Market Size and Forecast
- 12.3.7.1 Large Panels
- 12.3.7.2 Small & Medium Panels
- 12.3.7.3 Micro-displays
- 12.3.8 Subsegment Pricing and Adoption Trends
- 12.3.9 Leading Suppliers and Competition
- 12.3.10 Regional Demand and Opportunities
- 12.4 By Application - Market Size and Forecast, 2025-2035
- 12.4.1 Segment Definition and Scope
- 12.4.2 Historical Market Size, 2018-2025
- 12.4.3 Revenue Forecast, 2025-2035
- 12.4.4 Volume Forecast, 2025-2035
- 12.4.5 Base-Year Market Share, 2025
- 12.4.6 Segment CAGR and Growth Drivers
- 12.4.7 Subsegment Market Size and Forecast
- 12.4.7.1 Commercial Video Walls & Signage
- 12.4.7.2 Televisions & Home Theater
- 12.4.7.3 NTE Devices (AR/VR Headsets)
- 12.4.7.4 Smartwatches & Wearables
- 12.4.7.5 Automotive Displays (HUDs & Dashboards)
- 12.4.7.6 Others (Industrial, Medical, Monitors)
- 12.4.8 Subsegment Pricing and Adoption Trends
- 12.4.9 Leading Suppliers and Competition
- 12.4.10 Regional Demand and Opportunities
- 12.5 Segment Growth Comparison
- 12.6 Segment Attractiveness and Priority Matrix
Chapter 13 Global Micro LED Display End-Use and Application Market Outlook
- 13.1 End-Use Industry and Customer Demand Structure
- 13.2 Leading Applications and Customer Groups
- 13.3 End-Use Market Size, Share and Forecast
- 13.4 Major End-Use Industry Deep Dives
- 13.4.1 Customer Requirements and Use Cases
- 13.4.2 Demand and Replacement Cycles
- 13.4.3 Technical and Regulatory Considerations
- 13.4.4 Purchasing and Procurement Models
- 13.4.5 Leading Vendors and Distribution Channels
- 13.4.6 Forecast and Commercial Opportunities
- 13.5 Emerging Applications and Cross-Segment Demand
- 13.6 End-Use Industry Investment Priorities
Chapter 14 Global Micro LED Display Geographic Market Outlook, 2025-2035
- 14.1 Regional Market Size and Share, 2025
- 14.2 Regional Market Forecast, 2025-2035
- 14.3 Regional Pricing, Production and Demand Differences
- 14.4 North America
- 14.4.1 United States
- 14.4.2 Canada
- 14.4.3 Mexico
- 14.5 Europe
- 14.5.1 Germany
- 14.5.2 France
- 14.5.3 Italy
- 14.5.4 United Kingdom
- 14.5.5 Spain
- 14.5.6 Poland
- 14.5.7 Russia
- 14.5.8 Netherlands
- 14.5.9 Belgium
- 14.5.10 Sweden
- 14.5.11 Denmark
- 14.5.12 Norway
- 14.5.13 Rest of Europe
- 14.6 Asia Pacific
- 14.6.1 China
- 14.6.2 India
- 14.6.3 Japan
- 14.6.4 South Korea
- 14.6.5 Thailand
- 14.6.6 Indonesia
- 14.6.7 Vietnam
- 14.6.8 Malaysia
- 14.6.9 Australia
- 14.6.10 Rest of Asia Pacific
- 14.7 Latin America
- 14.7.1 Brazil
- 14.7.2 Argentina
- 14.7.3 Colombia
- 14.7.4 Chile
- 14.7.5 Rest of Latin America
- 14.8 Middle East
- 14.8.1 Saudi Arabia
- 14.8.2 United Arab Emirates
- 14.8.3 Turkey
- 14.8.4 Israel
- 14.8.5 Iran
- 14.8.6 Rest of the Middle East
- 14.9 Africa
- 14.9.1 South Africa
- 14.9.2 Egypt
- 14.9.3 Nigeria
- 14.9.4 Morocco
- 14.9.5 Rest of Africa
- 14.10 Regional Investment, Policy and Supply Chain Differences
- 14.11 Regional Competitive Landscape
- 14.12 Geographic Growth Hotspots
Chapter 15 Global Micro LED Display Technology, Innovation and Sustainability Outlook
- 15.1 Technology Landscape and Maturity
- 15.2 Product, Process and Service Innovation
- 15.3 AI, Automation and Digital Tools in the Industry
- 15.4 Technology Adoption and Performance Benchmarking
- 15.5 Innovation Pipeline and R&D Investment
- 15.6 Patent and Intellectual Property Trends
- 15.7 Energy Efficiency and Resource Management
- 15.8 Sustainability, Recycling and Circularity
- 15.9 Technology Roadmap, 2025-2035
- 15.10 Risks of Obsolescence and Technology Substitution
Chapter 16 Global Micro LED Display Market Key Strategic Imperatives
- 16.1 Growth and Market Entry Priorities
- 16.2 High-Return Products and Segments
- 16.3 Pricing, Profitability and Cost Optimization
- 16.4 Technology Investment and Product Differentiation
- 16.5 Supply Chain Localization and Resilience
- 16.6 Distribution and Customer Acquisition
- 16.7 Partnership, Acquisition and Capacity Strategy
- 16.8 Regional Expansion Priorities
- 16.9 Short-, Medium- and Long-Term Actions
Chapter 17 Competition Outlook
- 17.1 Industry Competition Characteristics
- 17.2 Market Structure and Concentration
- 17.3 Market Share and Competitive Positioning, 2025
- 17.4 Company-Wise Revenue and Product Benchmarking
- 17.5 Production and Service Capacity Benchmarking
- 17.6 Technology, Pricing and Differentiation
- 17.7 Regional Footprint and Distribution Strength
- 17.8 Mergers, Acquisitions and Strategic Alliances
- 17.9 New Entrants and Competitive Threats
- 17.10 Porter's Five Forces and Industry Attractiveness
- 17.11 Competitive Outlook, 2025-2035
Chapter 18 Company Profiles
- 18.1 Company Coverage and Selection Criteria
- 18.2 Samsung Electronics
- 18.2.1 Business Description
- 18.2.2 Company Ownership and Geographic Presence
- 18.2.3 Product and Service Portfolio
- 18.2.4 Manufacturing and Operating Footprint
- 18.2.5 Production Capacity and Expansion Plans
- 18.2.6 Financial Performance and Investment
- 18.2.7 Market Share and Competitive Position
- 18.2.8 Technology and Innovation Capabilities
- 18.2.9 Strategic Alliances or Partnerships
- 18.2.10 Recent Developments
- 18.2.11 Growth Strategy and Outlook
- 18.3 Sony Group
- 18.4 LG Electronics
- 18.5 AUO
- 18.6 PlayNitride
- 18.7 JBD
- 18.8 BOE Technology Group
- 18.9 TCL CSOT
- 18.10 Garmin
- 18.11 Other Relevant Market Participants
Note: Every listed company is profiled on the structure shown under the first company. The company list is preliminary and may change based on research findings, market developments, data availability and client requirements.
Chapter 19 Disclaimer
- 19.1 Research and Forecast Disclaimer
- 19.2 Data Source and Estimation Limitations
Note: The depth of individual sections depends on data availability for this market. Volume, capacity, trade and other unit-based metrics are included where applicable.
