CHAPTER NO. 1 : GENESIS OF THE MARKET
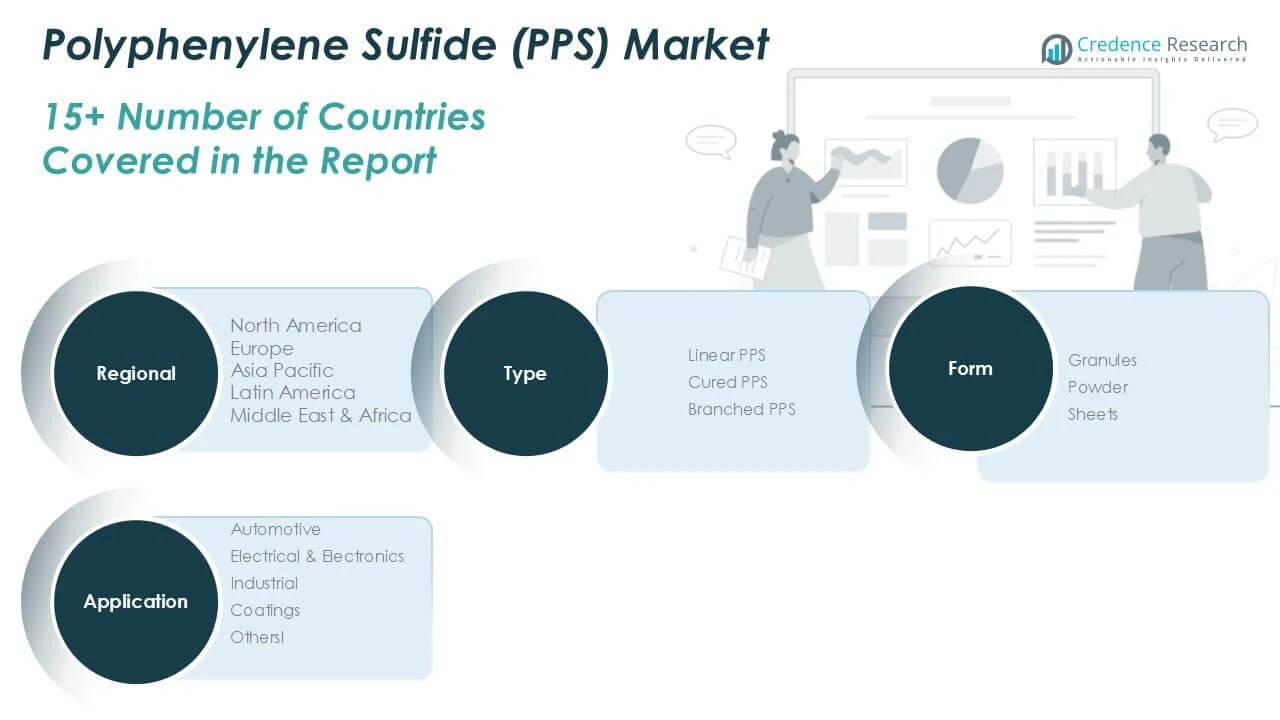
1.1 Market Prelude – Introduction & Scope
1.2 The Big Picture – Objectives & Vision
1.3 Strategic Edge – Unique Value Proposition
1.4 Stakeholder Compass – Key Beneficiaries
CHAPTER NO. 2 : EXECUTIVE LENS
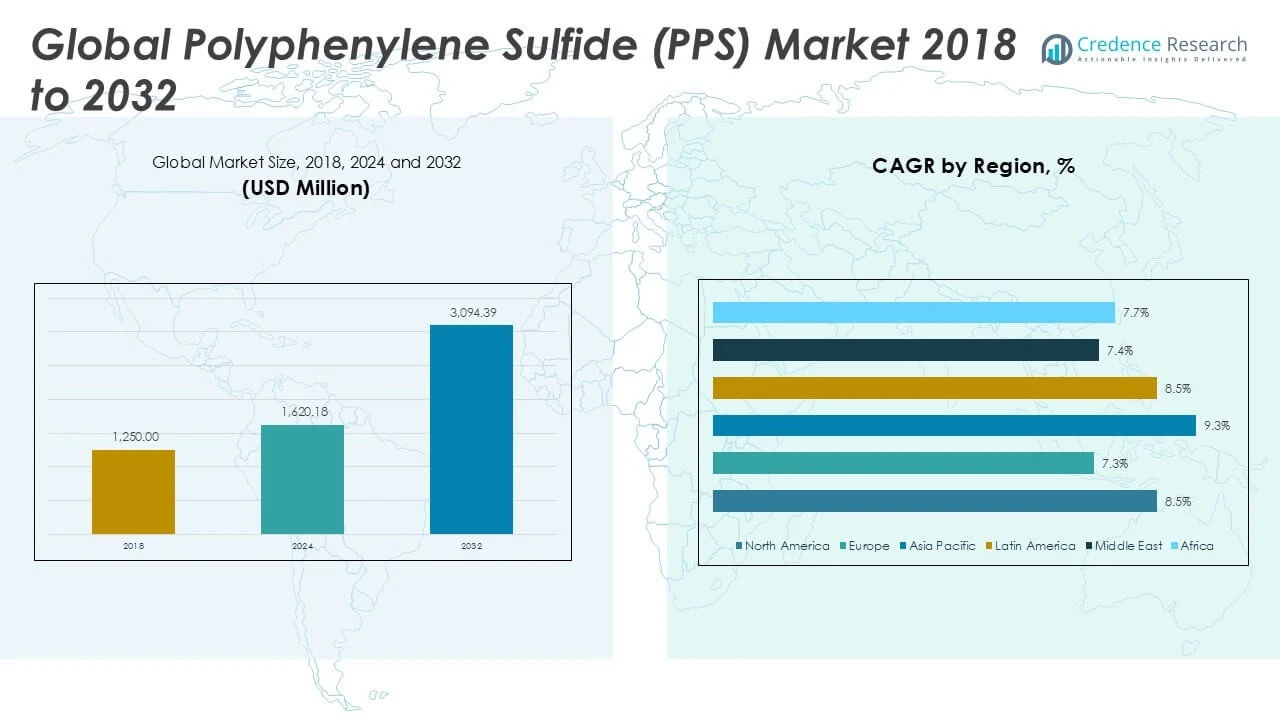
2.1 Pulse of the Industry – Market Snapshot
2.2 Growth Arc – Revenue Projections (USD Million)
2.3. Premium Insights – Based on Primary Interviews
CHAPTER NO. 3 : POLYPHENYLENE SULFIDE (PPS) MARKET FORCES & INDUSTRY PULSE
3.1 Foundations of Change – Market Overview
3.2 Catalysts of Expansion – Key Market Drivers
3.2.1 Momentum Boosters – Growth Triggers
3.2.2 Innovation Fuel – Disruptive Technologies
3.3 Headwinds & Crosswinds – Market Restraints
3.3.1 Regulatory Tides – Compliance Challenges
3.3.2 Economic Frictions – Inflationary Pressures
3.4 Untapped Horizons – Growth Potential & Opportunities
3.5 Strategic Navigation – Industry Frameworks
3.5.1 Market Equilibrium – Porter’s Five Forces
3.5.2 Ecosystem Dynamics – Value Chain Analysis
3.5.3 Macro Forces – PESTEL Breakdown
3.6 Price Trend Analysis
3.6.1 Regional Price Trend
3.6.2 Price Trend by product
CHAPTER NO. 4 : KEY INVESTMENT EPICENTER
4.1 Regional Goldmines – High-Growth Geographies
4.2 Product Frontiers – Lucrative Product Categories
4.3 Application Sweet Spots – Emerging Demand Segments
CHAPTER NO. 5: REVENUE TRAJECTORY & WEALTH MAPPING
5.1 Momentum Metrics – Forecast & Growth Curves
5.2 Regional Revenue Footprint – Market Share Insights
5.3 Segmental Wealth Flow – Type & Application Revenue
CHAPTER NO. 6 : TRADE & COMMERCE ANALYSIS
6.1.Import Analysis by Region
6.1.1. Global Polyphenylene Sulfide (PPS) Market Import Volume By Region
6.2.Export Analysis by Region
6.2.1. Global Polyphenylene Sulfide (PPS) Market Export Volume By Region
CHAPTER NO. 7 : COMPETITION ANALYSIS
7.1.Company Market Share Analysis
7.1.1. Global Polyphenylene Sulfide (PPS) Market: Company Market Share
7.1. Global Polyphenylene Sulfide (PPS) Market Company Volume Market Share
7.2. Global Polyphenylene Sulfide (PPS) Market Company Revenue Market Share
7.3.Strategic Developments
7.3.1.Acquisitions & Mergers
7.3.2. New Product Launch
7.3.3. Regional Expansion
7.4. Competitive Dashboard
7.5. Company Assessment Metrics, 2024
CHAPTER NO. 8 : POLYPHENYLENE SULFIDE (PPS) MARKET – BY TYPE SEGMENT ANALYSIS
8.1.Polyphenylene Sulfide (PPS) Market Overview by Type Segment
8.1.1. Polyphenylene Sulfide (PPS) Market Volume Share By Type
8.1.2. Polyphenylene Sulfide (PPS) Market Revenue Share By Type
8.2. Linear PPS
8.3. Cured PPS
8.4. Branched PPS
CHAPTER NO. 9 : POLYPHENYLENE SULFIDE (PPS) MARKET – BY APPLICATION SEGMENT ANALYSIS
9.1.Polyphenylene Sulfide (PPS) Market Overview by Application Segment
9.1.1. Polyphenylene Sulfide (PPS) Market Volume Share By Application
9.1.2. Polyphenylene Sulfide (PPS) Market Revenue Share By Application
9.2. Automotive
9.3. Electrical & Electronics
9.4. Industrial
9.5. Coatings
9.6. Others
CHAPTER NO. 10 : POLYPHENYLENE SULFIDE (PPS) MARKET – BY FORM SEGMENT ANALYSIS
10.1.Polyphenylene Sulfide (PPS) Market Overview by Form Segment
10.1.1. Polyphenylene Sulfide (PPS) Market Volume Share By Form
10.1.2. Polyphenylene Sulfide (PPS) Market Revenue Share By Form
10.2. Granules
10.3. Powder
10.4. Sheets
CHAPTER NO. 11 : POLYPHENYLENE SULFIDE (PPS) MARKET – REGIONAL ANALYSIS
11.1.Polyphenylene Sulfide (PPS) Market Overview by Region Segment
11.1.1. Global Polyphenylene Sulfide (PPS) Market Volume Share By Region
11.1.2. Global Polyphenylene Sulfide (PPS) Market Revenue Share By Region
11.1.3.Regions
11.1.4.Global Polyphenylene Sulfide (PPS) Market Volume By Region
11.1.5.Global Polyphenylene Sulfide (PPS) Market Revenue By Region
11.1.6.Type
11.1.7.Global Polyphenylene Sulfide (PPS) Market Volume By Type
11.1.8.Global Polyphenylene Sulfide (PPS) Market Revenue By Type
11.1.9.Application
11.1.10. Global Polyphenylene Sulfide (PPS) Market Volume By Application
11.1.11. Global Polyphenylene Sulfide (PPS) Market Revenue By Application
11.1.12. Form
11.1.13. Global Polyphenylene Sulfide (PPS) Market Volume By Form
11.1.14. Global Polyphenylene Sulfide (PPS) Market Revenue By Form
CHAPTER NO. 12 : NORTH AMERICA POLYPHENYLENE SULFIDE (PPS) MARKET – COUNTRY ANALYSIS
12.1.North America Polyphenylene Sulfide (PPS) Market Overview by Country Segment
12.1.1.North America Polyphenylene Sulfide (PPS) Market Volume Share By Region
12.1.2. North America Polyphenylene Sulfide (PPS) Market Revenue Share By Region
12.2.North America
12.2.1.North America Polyphenylene Sulfide (PPS) Market Volume By Country
12.2.2.North America Polyphenylene Sulfide (PPS) Market Revenue By Country
12.2.3.Type
12.2.4.North America Polyphenylene Sulfide (PPS) Market Volume By Type
12.2.5.North America Polyphenylene Sulfide (PPS) Market Revenue By Type
12.2.6.Application
12.2.7.North America Polyphenylene Sulfide (PPS) Market Volume By Application
12.2.8. North America Polyphenylene Sulfide (PPS) Market Revenue By Application
12.2.9. Form
12.2.10.North America Polyphenylene Sulfide (PPS) Market Volume By Form
12.2.11. North America Polyphenylene Sulfide (PPS) Market Revenue By Form
12.3.U.S.
12.4.Canada
12.5.Mexico
CHAPTER NO. 13 : EUROPE POLYPHENYLENE SULFIDE (PPS) MARKET – COUNTRY ANALYSIS
13.1. Europe Polyphenylene Sulfide (PPS) Market Overview by Country Segment
13.1.1. Europe Polyphenylene Sulfide (PPS) Market Volume Share By Region
13.1.2. Europe Polyphenylene Sulfide (PPS) Market Revenue Share By Region
13.2.Europe
13.2.1.Europe Polyphenylene Sulfide (PPS) Market Volume By Country
13.2.2.Europe Polyphenylene Sulfide (PPS) Market Revenue By Country
13.2.3.Type
13.2.4.Europe Polyphenylene Sulfide (PPS) Market Volume By Type
13.2.5.Europe Polyphenylene Sulfide (PPS) Market Revenue By Type
13.2.6.Application
13.2.7. Europe Polyphenylene Sulfide (PPS) Market Volume By Application
13.2.8. Europe Polyphenylene Sulfide (PPS) Market Revenue By Application
13.2.9. Form
13.2.10. Europe Polyphenylene Sulfide (PPS) Market Volume By Form
13.2.11. Europe Polyphenylene Sulfide (PPS) Market Revenue By Form
13.3.UK
13.4.France
13.5.Germany
13.6.Italy
13.7.Spain
13.8.Russia
13.9. Rest of Europe
CHAPTER NO. 14 : ASIA PACIFIC POLYPHENYLENE SULFIDE (PPS) MARKET – COUNTRY ANALYSIS
14.1.Asia Pacific Polyphenylene Sulfide (PPS) Market Overview by Country Segment
14.1.1.Asia Pacific Polyphenylene Sulfide (PPS) Market Volume Share By Region
14.1.2.Asia Pacific Polyphenylene Sulfide (PPS) Market Revenue Share By Region
14.2.Asia Pacific
14.2.1. Asia Pacific Polyphenylene Sulfide (PPS) Market Volume By Country
14.2.2.Asia Pacific Polyphenylene Sulfide (PPS) Market Revenue By Country
14.2.3.Type
14.2.4.Asia Pacific Polyphenylene Sulfide (PPS) Market Volume By Type
14.2.5.Asia Pacific Polyphenylene Sulfide (PPS) Market Revenue By Type
14.2.6.Application
14.2.7.Asia Pacific Polyphenylene Sulfide (PPS) Market Volume By Application
14.2.8.Asia Pacific Polyphenylene Sulfide (PPS) Market Revenue By Application
14.2.9. Form
14.2.10.Asia Pacific Polyphenylene Sulfide (PPS) Market Volume By Form
14.2.11.Asia Pacific Polyphenylene Sulfide (PPS) Market Revenue By Form
14.3.China
14.4.Japan
14.5.South Korea
14.6.India
14.7.Australia
14.8.Southeast Asia
14.9. Rest of Asia Pacific
CHAPTER NO. 15 : LATIN AMERICA POLYPHENYLENE SULFIDE (PPS) MARKET – COUNTRY ANALYSIS
15.1.Latin America Polyphenylene Sulfide (PPS) Market Overview by Country Segment
15.1.1.Latin America Polyphenylene Sulfide (PPS) Market Volume Share By Region
15.1.2.Latin America Polyphenylene Sulfide (PPS) Market Revenue Share By Region
15.2. Latin America
15.2.1. Latin America Polyphenylene Sulfide (PPS) Market Volume By Country
15.2.2.Latin America Polyphenylene Sulfide (PPS) Market Revenue By Country
15.2.3.Type
15.2.4. Latin America Polyphenylene Sulfide (PPS) Market Volume By Type
15.2.5. Latin America Polyphenylene Sulfide (PPS) Market Revenue By Type
15.2.6.Application
15.2.7.Latin America Polyphenylene Sulfide (PPS) Market Volume By Application
15.2.8.Latin America Polyphenylene Sulfide (PPS) Market Revenue By Application
15.2.9. Form
15.2.10.Latin America Polyphenylene Sulfide (PPS) Market Volume By Form
15.2.11.Latin America Polyphenylene Sulfide (PPS) Market Revenue By Form
15.3.Brazil
15.4.Argentina
15.5.Rest of Latin America
CHAPTER NO. 16 : MIDDLE EAST POLYPHENYLENE SULFIDE (PPS) MARKET – COUNTRY ANALYSIS
16.1.Middle East Polyphenylene Sulfide (PPS) Market Overview by Country Segment
16.1.1.Middle East Polyphenylene Sulfide (PPS) Market Volume Share By Region
16.1.2. Middle East Polyphenylene Sulfide (PPS) Market Revenue Share By Region
16.2.Middle East
16.2.1. Middle East Polyphenylene Sulfide (PPS) Market Volume By Country
16.2.2.Middle East Polyphenylene Sulfide (PPS) Market Revenue By Country
16.2.3.Type
16.2.4.Middle East Polyphenylene Sulfide (PPS) Market Volume By Type
16.2.5.Middle East Polyphenylene Sulfide (PPS) Market Revenue By Type
16.2.6.Application
16.2.7.Middle East Polyphenylene Sulfide (PPS) Market Volume By Application
16.2.8.Middle East Polyphenylene Sulfide (PPS) Market Revenue By Application
16.2.9. Form
16.2.10.Middle East Polyphenylene Sulfide (PPS) Market Volume By Form
16.2.11. Middle East Polyphenylene Sulfide (PPS) Market Revenue By End-user
16.3.GCC Countries
16.4. Israel
16.5. Turkey
16.6.Rest of Middle East
CHAPTER NO. 17 : AFRICA POLYPHENYLENE SULFIDE (PPS) MARKET – COUNTRY ANALYSIS
17.1. Africa Polyphenylene Sulfide (PPS) Market Overview by Country Segment
17.1.1.Africa Polyphenylene Sulfide (PPS) Market Volume Share By Region
17.1.2. Africa Polyphenylene Sulfide (PPS) Market Revenue Share By Region
17.2. Africa
17.2.1.Africa Polyphenylene Sulfide (PPS) Market Volume By Country
17.2.2.Africa Polyphenylene Sulfide (PPS) Market Revenue By Country
17.2.3.Type
17.2.4.Africa Polyphenylene Sulfide (PPS) Market Volume By Type
17.2.5.Africa Polyphenylene Sulfide (PPS) Market Revenue By Type
17.2.6.Application
17.2.7. Africa Polyphenylene Sulfide (PPS) Market Volume By Application
17.2.8. Africa Polyphenylene Sulfide (PPS) Market Revenue By Application
17.2.9. Form
17.2.10. Africa Polyphenylene Sulfide (PPS) Market Volume By Form
17.2.11. Africa Polyphenylene Sulfide (PPS) Market Revenue By Form
17.3. South Africa
17.4.Egypt
17.5.Rest of Africa
CHAPTER NO. 18 : COMPANY PROFILES
18.1. DIC CORPORATION
18.1.1.Company Overview
18.1.2.Product Portfolio
18.1.3.Financial Overview
18.1.4.Recent Developments
18.1.5.Growth Strategy
18.1.6.SWOT Analysis
18.2. Solvay S.A.
18.3. Lion Idemitsu Composites Co., Ltd
18.4. Toray Industries, Inc.
18.5.Tosoh Corporation
18.6.SK chemicals
18.7. Chengdu Letian Plastics Co., Ltd.
18.8.Celanese Corporation
18.9. TEIJIN LIMITED
18.10.SABIC
18.11. Zhejiang NHU Co., Ltd.
18.12. Polyplastics Co., Ltd.
18.13.RTP Company
18.14. Ensinger

 Market Insights


