
Market Overview
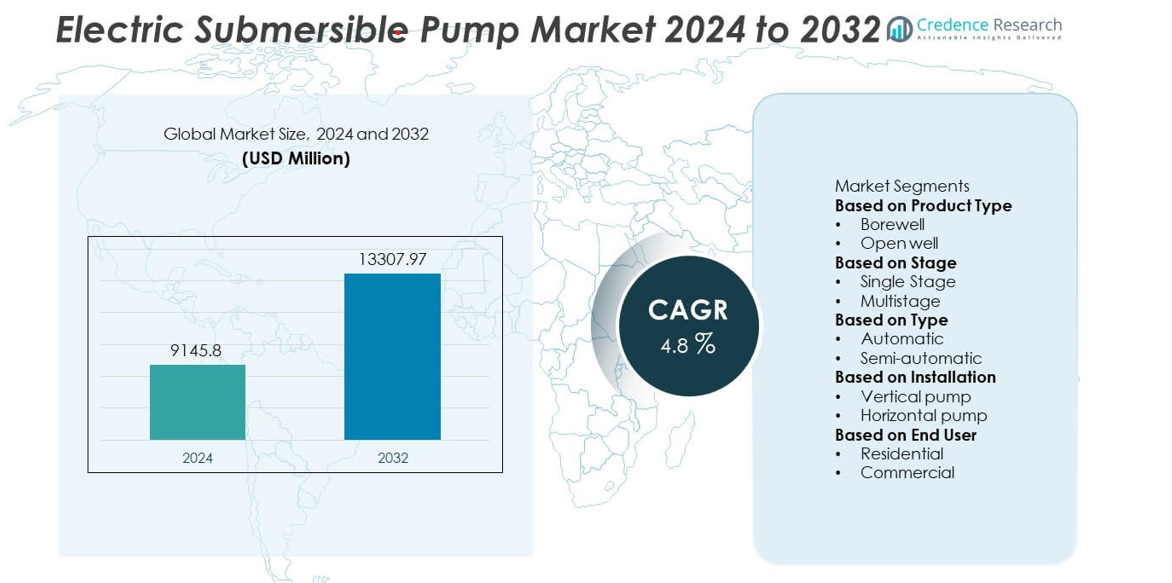
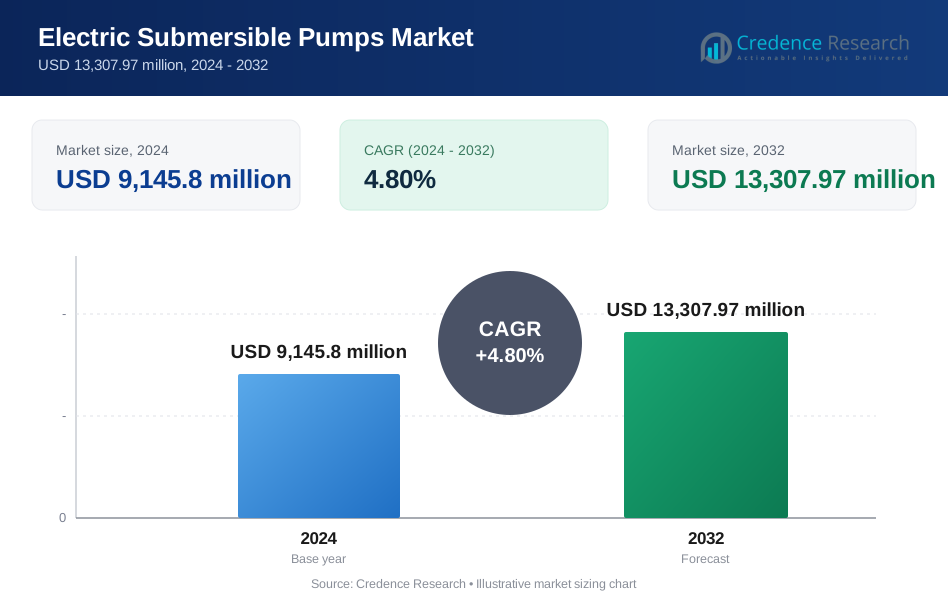
The Electric Submersible Pump Market was valued at USD 9,145.8 million in 2024 and is projected to reach USD 13,307.97 million by 2032, growing at a CAGR of 4.8% during the forecast period.
| REPORT ATTRIBUTE | DETAILS |
|---|---|
| Historical Period | 2020-2023 |
| Base Year | 2024 |
| Forecast Period | 2025-2032 |
| Electric Submersible Pump Market Size 2024 | USD 9,145.8 million |
| Electric Submersible Pump Market, CAGR | 4.8% |
| Electric Submersible Pump Market Size 2032 | USD 13,307.97 million |
The Electric Submersible Pump market is led by major companies including EBARA, Atlas Copco, Pleuger, Baker Hughes, Proril Pumps, Aqua Group, SLB, Pedrollo, Flexachem, and Dab Pumps. These players dominate through advanced product portfolios, digital monitoring integration, and strong distribution networks. Asia-Pacific emerged as the leading region with a 38 percent market share in 2024, driven by rapid industrialization and extensive agricultural irrigation demand. North America followed with 27 percent, supported by ongoing oil and gas exploration. Europe maintained steady growth at 21 percent, supported by sustainability-focused investments and water management modernization programs.
Market Insights
- The Electric Submersible Pump market was valued at USD 9,145.8 million in 2024 and is projected to reach USD 13,307.97 million by 2032, growing at a CAGR of 4.8 percent.
- Rising demand for groundwater extraction and increasing oil and gas exploration activities are major growth drivers, supported by expanding urban and industrial water infrastructure.
- Technological trends include the integration of IoT-based monitoring, energy-efficient motor designs, and corrosion-resistant materials to improve performance and durability.
- The market is competitive with key players such as EBARA, Atlas Copco, Baker Hughes, SLB, and Pedrollo focusing on innovation, partnerships, and regional expansion to strengthen their presence.
- Asia-Pacific held the largest share of 38 percent in 2024, followed by North America with 27 percent and Europe with 21 percent, while the borewell product segment led with 61 percent share due to high agricultural and municipal water demand.
Market Segmentation Analysis:
By Product Type
The borewell submersible pump segment dominated the market in 2024, accounting for nearly 61% of the total share. Its leadership stems from wide use in agriculture, municipal water supply, and groundwater extraction. Borewell pumps provide higher discharge rates, durability, and energy efficiency, making them ideal for deep-well applications. The growing demand for irrigation systems and reliable water access in developing regions supports steady growth. Government initiatives promoting rural water infrastructure and precision farming further accelerate borewell pump adoption across Asia-Pacific and the Middle East.
- For instance, EBARA s borehole pump series includes models delivering a total head up to 682 m with capacities reaching 75 m³/h. Other models like the 6BHE and 8BHE series also achieve powerful performance, demonstrating that EBARA manufactures pumps with these capabilities.
By Stage
The multistage submersible pump segment held the largest share of about 68% in 2024. Multistage systems offer higher pressure and efficiency for deep-well pumping and industrial operations. These pumps are widely used in oil and gas, mining, and water treatment due to their ability to handle high head requirements. Increasing industrial water use and deeper groundwater extraction have boosted demand. Manufacturers are also focusing on corrosion-resistant materials and variable frequency drives to improve operational reliability and energy performance in large-scale installations.
- For instance, Atlas Copco’s PAC H108 JD model handles flows up to 6,400 gpm at a head up to 360 ft in dewatering service.
By Type
The automatic submersible pump segment led the market with approximately 57% share in 2024. Automatic pumps are favored for their smart operation, reduced maintenance, and energy-saving capabilities. These systems feature built-in sensors and controllers that regulate water levels, ensuring efficient use and preventing dry runs. Rising adoption of automation in residential and agricultural sectors drives segment expansion. The trend toward intelligent water management and integration with IoT-based monitoring systems continues to strengthen the preference for automatic submersible pumps globally.
Key Growth Drivers
Rising Demand for Groundwater Extraction
Growing dependence on groundwater for agriculture and municipal supply is a major driver for electric submersible pumps. Expanding irrigation networks and depleting surface water sources are increasing the use of borewell systems. These pumps provide efficient water delivery and long-term reliability in deep aquifer operations. Government initiatives promoting sustainable irrigation and rural water access further encourage installation. Continuous focus on water security and efficient usage supports strong adoption across developing economies.
- For instance, Grundfos supplied pumps for water projects in India, including those under the Jal Jeevan Mission, using high-efficiency SP submersible pumps. The pumps feature stainless-steel components for corrosion resistance and sand handling, ensuring long service life in continuous groundwater operations.
Expanding Oil and Gas Exploration Activities
Increased exploration of both offshore and onshore oil reserves is boosting demand for electric submersible pumps. These pumps are widely used to enhance oil recovery and maintain steady production rates in deep wells. Advancements in high-temperature and corrosion-resistant technologies are improving pump performance under demanding conditions. Energy producers rely on these systems to optimize operations and lower production costs. Growing investments in energy exploration across key oil-producing regions continue to strengthen market growth.
- For instance, Schlumberger's REDA Maximus ESP system is designed for enhanced reliability in challenging conditions, with high-efficiency motor technology capable of withstanding high temperatures up to 204°C.
Rapid Industrialization and Urban Infrastructure Development
Industrial expansion and urbanization are accelerating the need for efficient water management systems. Sectors such as mining, wastewater treatment, and manufacturing depend on submersible pumps for reliable fluid handling. Urban projects require advanced pumping systems for water supply, flood control, and drainage. Governments are integrating automated and smart pumping technologies into infrastructure plans. This trend supports continuous market expansion driven by modernization and industrial growth across developing regions.
Key Trends and Opportunities
Integration of Smart and Connected Technologies
Smart monitoring systems and IoT-based controls are transforming the performance of electric submersible pumps. These technologies enable real-time tracking, predictive maintenance, and improved energy efficiency. Manufacturers are adopting digital controllers and cloud-based monitoring to reduce downtime and extend equipment life. The integration of automation in water and wastewater applications enhances operational reliability. Growing adoption of smart water management platforms creates strong opportunities for technologically advanced pump solutions.
- For instance, Baker Hughes deploys digital systems like its ProductionLink™ platform for Electrical Submersible Pumps (ESPs). The platform enables well performance tracking, including predictive failure analytics powered by machine learning, to identify potential issues before costly failures occur.
Shift Toward Energy-Efficient and Eco-Friendly Designs
Energy efficiency and sustainability are becoming central to pump design. Manufacturers are focusing on high-efficiency motors, variable frequency drives, and recyclable materials. These innovations help reduce energy consumption and meet environmental standards. Demand for eco-friendly systems is rising in agriculture, construction, and municipal sectors. The focus on reducing carbon footprints and lifecycle costs positions energy-efficient submersible pumps as a preferred choice for modern applications.
- For instance, Franklin Electric introduced its high-efficiency 6-inch E-Tech borehole motor capable of operating up to 18.5 kW with a 92% efficiency rating. The motor uses 316-grade stainless steel construction and recyclable copper windings, which improve corrosion resistance and reduce power losses in continuous agricultural pumping operations.
Key Challenges
High Maintenance and Operational Complexity
Frequent exposure to corrosive fluids, sand, and high-pressure conditions increases wear on submersible pumps. This leads to high maintenance requirements and operational costs, especially in remote locations. Failures in seals or impellers can disrupt operations and increase downtime. Manufacturers are developing durable designs with self-cleaning and anti-corrosive components to reduce service frequency. However, maintenance costs remain a major constraint for small and medium users.
Fluctuating Raw Material Prices
Volatility in prices of metals such as copper and stainless steel affects production stability. These materials are vital for pump casings and motor components, making manufacturing costs sensitive to market fluctuations. Global supply chain disruptions and energy cost variations add further uncertainty. Companies are exploring alternative materials and efficient fabrication techniques to manage price risks. Despite these efforts, raw material instability continues to challenge profitability in the submersible pump market.
Regional Analysis
North America
North America held a market share of 27 percent in 2024, driven by increasing oil and gas production in the United States and Canada. The region’s shale exploration and offshore drilling projects continue to strengthen demand for advanced electric submersible pumps. Growing adoption in municipal water supply and wastewater treatment also supports steady growth. Key manufacturers are investing in digital pump monitoring and energy-efficient designs to improve operational reliability. Government focus on upgrading industrial and urban water systems further enhances market expansion across the region.
Europe
Europe accounted for 21 percent of the total market share in 2024, supported by strong industrial and municipal water management programs. Countries such as Germany, France, and the United Kingdom are adopting energy-efficient submersible pumps to meet sustainability goals. Investments in wastewater treatment and flood control systems boost product deployment. Rising demand for automation in water infrastructure and environmental compliance under EU regulations further strengthens growth. Manufacturers in the region are focusing on low-noise, corrosion-resistant models for long-term durability and reduced lifecycle costs.
Asia-Pacific
Asia-Pacific dominated the global market with a 38 percent share in 2024, led by rapid industrialization and agricultural development in China, India, and Southeast Asia. Expanding irrigation networks and rising groundwater extraction drive significant demand for borewell submersible pumps. Urbanization and infrastructure investments continue to enhance water distribution and sewage systems. Governments across the region are promoting rural electrification and sustainable water supply projects. The strong presence of domestic manufacturers offering cost-effective and energy-efficient solutions further boosts market growth across Asia-Pacific.
Middle East and Africa
The Middle East and Africa captured 9 percent of the global share in 2024, supported by ongoing oil field development and water desalination projects. Electric submersible pumps are widely used for artificial lift in high-temperature oil wells. Gulf nations such as Saudi Arabia and the UAE are major adopters due to large-scale energy and water initiatives. In Africa, rising agricultural irrigation and rural water supply projects contribute to steady demand. The focus on expanding infrastructure and industrial capacity is expected to sustain regional market growth.
Latin America
Latin America accounted for 5 percent of the total market share in 2024, driven by oil exploration activities and agricultural water applications. Countries such as Brazil and Mexico are leading adopters due to increased drilling operations and groundwater extraction. Government programs promoting rural electrification and efficient irrigation further boost pump installation. Local manufacturing improvements and partnerships with international players enhance product availability. Continued investment in mining and energy infrastructure is expected to support consistent demand for electric submersible pumps across the region.
Market Segmentations:
By Product Type
- Borewell
- Open well
By Stage
- Single Stage
- Multistage
By Type
- Automatic
- Semi-automatic
By Installation
- Vertical pump
- Horizontal pump
By End User
- Residential
- Commercial
By Geography
- North America
- U.S.
- Canada
- Mexico
- Europe
- Germany
- France
- U.K.
- Italy
- Spain
- Rest of Europe
- Asia Pacific
- China
- Japan
- India
- South Korea
- South-east Asia
- Rest of Asia Pacific
- Latin America
- Brazil
- Argentina
- Rest of Latin America
- Middle East & Africa
- GCC Countries
- South Africa
- Rest of the Middle East and Africa
Competitive Landscape
The competitive landscape of the Electric Submersible Pump market includes key players such as EBARA, Atlas Copco, Pleuger, Baker Hughes, Proril Pumps, Aqua Group, SLB, Pedrollo, Flexachem, and Dab Pumps. These companies focus on expanding product portfolios, enhancing energy efficiency, and integrating digital monitoring technologies to strengthen market presence. Strategic investments in automation and smart pumping systems are becoming a major differentiator among global and regional manufacturers. Companies are actively pursuing mergers, partnerships, and capacity expansions to address growing demand in oil and gas, municipal water, and industrial sectors. Product reliability, lifecycle cost efficiency, and aftersales service capabilities remain key competitive factors. Manufacturers are also emphasizing sustainability, introducing pumps with corrosion-resistant materials and variable frequency drives to improve performance in harsh environments. Continuous innovation and regional expansion strategies are shaping long-term competition across developed and emerging markets.
Key Player Analysis
- EBARA
- Atlas Copco
- Pleuger
- Baker Hughes
- Proril Pumps
- Aqua Group
- SLB
- Pedrollo
- Flexachem
- Dab Pumps
Recent Developments
- In September 2025, Pleuger highlighted its StEnSea offshore energy-storage submersible pump work.
- In 2025, SLB (and Baker Hughes) reported Q2 2025 earnings; SLB’s Production Systems division (which includes pumping and artificial lift) showed 3 % sequential revenue growth.
- In May 2024, Baker Hughes and the Azneft production association reached an agreement to set up the assembly of electric submersible pumps (ESPs) in Azerbaijan.
- In March 2023, Atlas Copco launched an updated WEDA D electric submersible dewatering pump
Report Coverage
The research report offers an in-depth analysis based on Product Type, Stage, Type, Installation, End User and Geography. It details leading market players, providing an overview of their business, product offerings, investments, revenue streams, and key applications. Additionally, the report includes insights into the competitive environment, SWOT analysis, current market trends, as well as the primary drivers and constraints. Furthermore, it discusses various factors that have driven market expansion in recent years. The report also explores market dynamics, regulatory scenarios, and technological advancements that are shaping the industry. It assesses the impact of external factors and global economic changes on market growth. Lastly, it provides strategic recommendations for new entrants and established companies to navigate the complexities of the market.
Future Outlook
- The market will continue to grow steadily due to rising global water demand.
- Increasing use in deep-well and offshore oil extraction will sustain long-term adoption.
- Smart pump technologies with IoT integration will enhance performance and monitoring.
- Energy-efficient and eco-friendly pump designs will gain strong market preference.
- Rural electrification projects will drive installation in developing regions.
- Demand for automated and variable frequency-controlled systems will increase rapidly.
- Manufacturers will focus on durable materials to reduce maintenance and downtime.
- Expansion of wastewater treatment facilities will boost product utilization.
- Partnerships between global and regional players will strengthen supply chains.
- Asia-Pacific will remain the leading growth hub supported by industrial and agricultural development.
Request a Free Sample
Fill in your details and we'll send you a free sample report.
- Sample data tables & charts
- Research methodology
Need a Custom Version of This Report?
Tailor the scope, geography, or segments to your exact requirements.
- Custom geography or segment scope
- Direct access to our analyst team
Frequently Asked Questions
What is the projected growth of the electric submersible pumps market?
What are the key drivers of growth in the ESP market?
Which regions are leading the electric submersible pumps market?
Why are ESPs becoming more attractive to industries?
How are innovations contributing to the ESP market’s growth?
Table of Content
Chapter 1. Report Introduction
- 1.1 Report Description & Purpose
- 1.1.1 Report Title & Market Definition
- 1.1.2 Unique Selling Propositions (USP) & Key Differentiators
- 1.1.3 Value Proposition for Stakeholders
- 1.2 Research Objectives
- 1.2.1 Market Sizing Objectives (Volume & Revenue)
- 1.2.2 Segmentation Objectives
- 1.2.3 Competitive Intelligence Objectives
- 1.2.4 Forecast & Scenario Objectives
- 1.3 Report Scope
- 1.3.1 Electric Submersible Pumps Scope – Types & Subtypes Covered
- 1.3.2 Geographic Scope – Regions & Countries Covered
- 1.3.3 Historical Period, Base Year & Forecast Period (2024; forecast to 2032)
- 1.3.4 Inclusions & Exclusions
- 1.4 HS Code & Classification Framework
- 1.5 Currency, Units & Pricing Basis
- 1.6 Target Stakeholders
- 1.7 Limitations & Assumptions
Chapter 2. Executive Summary
- 2.1 Global Electric Submersible Pumps Market Snapshot
- 2.1.1 Market Size – Historical (2024) & Forecast (2024-2032) (2024: USD 9,145.8 million → 2032: USD 13,307.97 million)
- 2.1.2 Volume & Revenue – Global Totals
- 2.1.3 Key Market Highlights – Top Five Facts
- 2.2 Electric Submersible Pumps Market Segmentation Snapshot
- 2.2.1 Market Split by Region – 2024 vs. 2032
- 2.3 Competitive Snapshot
- 2.3.1 Top 10 Players by Revenue Share – 2024
- 2.3.2 Top 10 Players by Volume Share – 2024
- 2.3.3 Recent Strategic Developments (18-Month Summary)
- 2.4 Key Investment Highlights & Strategic Conclusions
Chapter 3. Electric Submersible Pumps Market Dynamics & Industry Analysis
- 3.1 Market Overview & Context
- 3.1.1 Electric Submersible Pumps Market Position in the Broader Automotive Value Chain
- 3.1.2 OEM vs. Replacement Market Dynamics
- 3.1.3 Market Maturity & Development Stage by Region
- 3.2 Electric Submersible Pumps Market Drivers
- 3.3 Electric Submersible Pumps Market Restraints & Challenges
- 3.4 Electric Submersible Pumps Market Opportunities
- 3.5 Porter's Five Forces Analysis
- 3.5.1 Threat of New Entrants
- 3.5.2 Bargaining Power of Suppliers
- 3.5.3 Bargaining Power of Buyers
- 3.5.4 Threat of Substitutes
- 3.5.5 Competitive Rivalry – Intensity Assessment
- 3.6 Electric Submersible Pumps Value Chain Analysis
- 3.6.1 Upstream – Raw Material/Input Suppliers
- 3.6.1.1 Raw Material/Input 1
- 3.6.1.2 Raw Material/Input 2
- 3.6.1.3 Raw Material/Input 3
- 3.6.2 Midstream – Production/Manufacturing/Service Delivery
- 3.6.2.1 Production/Process Overview
- 3.6.2.2 Key Facility Locations & Capacity by Manufacturer
- 3.6.3 Downstream – Distribution & End Consumer
- 3.6.3.1 Primary Channel – B2B/OEM
- 3.6.3.2 Secondary Channels – Dealer, Retail, Online, Direct
- 3.6.4 Value Chain Profitability Analysis
- 3.6.1 Upstream – Raw Material/Input Suppliers
- 3.7 PESTEL Analysis
- 3.7.1 Political Factors
- 3.7.2 Economic Factors
- 3.7.3 Social Factors
- 3.7.4 Technological Factors
- 3.7.5 Environmental Factors
- 3.7.6 Legal Factors
- 3.8 Electric Submersible Pumps Supply Chain Analysis
- 3.8.1 Raw Material/Input Supply Risk Assessment
- 3.8.2 Manufacturing Concentration Risk (Geographic Exposure)
- 3.8.3 Trade Disruption Impact Analysis
- 3.9 Regulatory & Policy Landscape
Note: The regulatory and policy landscape section covers regulations based on their applicability to the market, Electric Submersible Pumps category, geography, and scope of the study. Only regulatory frameworks with a material impact on operations, compliance, trade, sustainability, or market access are analyzed in detail.
Chapter 4. Key Investment Pockets & Opportunity Analysis
- 4.1 Electric Submersible Pumps Market Attractiveness Analysis
- 4.1.1 By Region – Investment Attractiveness Matrix (Volume × CAGR)
- 4.2 Absolute Revenue Growth Opportunity
- 4.2.1 By Region – Absolute USD Growth Through 2032
- 4.3 Incremental Volume Opportunity
- 4.3.1 By Region – Incremental Volume Through 2032
- 4.3.2 Segment – Incremental Volume
- 4.4 Emerging Submarket Opportunity Deep Dive (Subject to Applicability)
- 4.5 Emerging Market Opportunity Scorecards
- 4.5.1 United States
- 4.5.2 Europe
- 4.5.3 Asia
- 4.5.4 Middle East & Africa
Note: Emerging Market Opportunity Scorecards will be included based on relevance and strategic importance. Regions listed are indicative and may vary depending on data availability and market dynamics.
Chapter 5. Electric Submersible Pumps Import-Export Analysis & Trade Flows
- 5.1 Global Trade Overview
- 5.1.1 Global Export Value by Country (2024)
- 5.1.2 Global Export Volume by Country (2024)
- 5.1.3 Global Import Value by Country (2024)
- 5.1.4 Global Import Volume by Country (2024)
- 5.1.5 Net Trade Balance by Country (2024)
- 5.2 Export Analysis – Segment
- 5.2.1 Type 1 (HS Code)
- 5.2.2 Type 2 (HS Code)
- 5.2.3 Type 3 (HS Code)
- 5.2.4 Type 4 (HS Code)
- 5.2.5 Type 5 (HS Code)
- 5.3 Import Analysis – Segment
- 5.3.1 Type 1 (HS Code)
- 5.3.2 Type 2 (HS Code)
- 5.3.3 Type 3 (HS Code)
- 5.3.4 Type 4 (HS Code)
- 5.3.5 Type 5 (HS Code)
- 5.4 Average Unit Trade Prices
- 5.4.1 Average Export Price – Segment & Country
- 5.4.2 Average Import Price – Segment & Source Country
- 5.4.3 Price Trends (2024)
- 5.5 Key Trade Route Analysis
- 5.5.1 Trade Route 1
- 5.5.2 Trade Route 2
- 5.5.3 Trade Route 3
- 5.5.4 Trade Route 4
- 5.5.5 Trade Route 5
- 5.6 Trade Policy Impact Assessment
- 5.6.1 US Anti-Dumping & Section 301 Tariffs
- 5.6.2 EU Customs Union Impact
- 5.6.3 Major Free Trade Agreements
- 5.6.4 USMCA Rules of Origin
Note: Trade policy analysis will be included only where relevant to the Electric Submersible Pumps market.
Chapter 6. Competitive Landscape & Company Benchmarking
- 6.1 Electric Submersible Pumps Market Concentration & Structure
- 6.1.1 Herfindahl-Hirschman Index (HHI) – vs. 2024
- 6.1.2 Tier 1, Tier 2 & Tier 3 Market Structure
- 6.1.3 Global, Regional & Local Player Dynamics
- 6.2 Electric Submersible Pumps Market Share Analysis – 2024
- 6.2.1 Global Revenue Share by Company
- 6.2.2 Global Volume Share by Company
- 6.2.3 Regional Revenue Share
- 6.2.4 Market Share Evolution ( vs. 2024)
- 6.2.5 OEM Segment Share by Company
- 6.2.6 Replacement Segment Share by Company
- 6.3 Production/Delivery Capacity & Facility Analysis
- 6.3.1 Global Installed Capacity
- 6.3.2 Capacity Utilization Rates
- 6.3.3 Production/Output Volume
- 6.3.4 Facility Locations & Capacity Map
- 6.3.5 Planned Capacity Additions
- 6.4 Electric Submersible Pumps Competitive Benchmarking Matrix
- 6.4.1 Revenue, Volume, CAGR & Profitability Comparison
- 6.4.2 Channel Revenue Mix
- 6.4.3 Geographic Revenue Exposure
- 6.4.4 R&D Intensity
- 6.4.5 Sustainability Maturity
- 6.5 Strategic Developments in Electric Submersible Pumps (Last 24 Months)
- 6.5.1 Mergers, Acquisitions & Divestments
- 6.5.2 New Electric Submersible Pumps Launches
- 6.5.3 Facility Expansions
- 6.5.4 Strategic Alliances, Joint Ventures & Partnerships
- 6.5.5 Distribution Expansion & Market Entry
- 6.5.6 Sustainability & ESG Initiatives
- 6.6 Competitive Strategy Mapping
- 6.6.1 Leader, Challenger, Follower & Niche Classification
- 6.6.2 Pricing Strategy Comparison
- 6.6.3 Channel Strategy Matrix
Note: Strategic developments are included based on their materiality and the availability of reliable information.
Chapter 7. Global Electric Submersible Pumps Market – By Distribution Channel
- 7.1 Segment Overview
- 7.1.1 Volume & Revenue Split by Channel (2024 & 2032)
- 7.1.2 Channel Mix Evolution (2024-2032)
Chapter 8. Regional Market Analysis – Global Overview
- 8.1 Global Regional Overview
- 8.1.1 Regional Volume Share
- 8.1.2 Regional Revenue Share
- 8.1.3 Regional Volume by Region
- 8.1.4 Regional Revenue by Region
- 8.1.5 Regional Forecast Through 2032
- 8.2 Cross-Regional Segment Analysis
- 8.2.1 By Distribution Channel
- 8.2.2 By Brand/Price Tier
Chapter 9. North America Electric Submersible Pumps Market
- 9.1 United States
- 9.2 Canada
- 9.3 Mexico
Chapter 10. Europe Electric Submersible Pumps Market
- 10.1 Germany
- 10.2 France
- 10.3 Italy
- 10.4 United Kingdom
- 10.5 Spain
- 10.6 Poland
- 10.7 Russia
- 10.8 Netherlands
- 10.9 Belgium
- 10.10 Sweden
- 10.11 Denmark
- 10.12 Norway
- 10.13 Rest of Europe
Chapter 11. Asia Pacific Electric Submersible Pumps Market
- 11.1 China
- 11.2 India
- 11.3 Japan
- 11.4 South Korea
- 11.5 Thailand
- 11.6 Indonesia
- 11.7 Vietnam
- 11.8 Malaysia
- 11.9 Australia
- 11.10 Rest of Asia Pacific
Chapter 12. Latin America Electric Submersible Pumps Market
- 12.1 Brazil
- 12.2 Argentina
- 12.3 Colombia
- 12.4 Chile
- 12.5 Rest of Latin America
Chapter 13. Middle East Electric Submersible Pumps Market
- 13.1 Saudi Arabia
- 13.2 United Arab Emirates
- 13.3 Turkey
- 13.4 Israel
- 13.5 Iran
- 13.6 Rest of the Middle East
Chapter 14. Africa Electric Submersible Pumps Market
- 14.1 South Africa
- 14.2 Egypt
- 14.3 Nigeria
- 14.4 Morocco
- 14.5 Rest of Africa
Chapter 15. Electric Submersible Pumps Company Profiles
- 15.1 [Company 01]
- 15.1.1 Company Overview
- 15.1.2 Key Management Personnel
- 15.1.3 Products & Services Portfolio
- 15.1.4 Financial Performance
- 15.1.5 Key Market Focus & Geographic Presence
- 15.1.6 Recent Developments & Strategic Initiatives
Note: The company profile list is preliminary and may change based on research findings, market developments, data availability, and client requirements.
Chapter 16. Appendices
- Appendix A – List of Abbreviations & Acronyms
- Appendix B – Industry Classification Code Reference – Full Series
- Appendix C – Production & Capacity Data Tables
- Appendix D – End-Use & Demand Base Tables
- Appendix E – Consumption & Replacement Rate Assumptions
- Appendix F – ASP Reference Tables
- Appendix G – Manufacturing & Facility Database
- Appendix H – Import-Export Data Tables
- Appendix I – Regulatory Summary Tables
- Appendix J – Primary Research Participant List (Anonymized)
- Appendix K – Primary Research Questionnaire Framework
- Appendix L – Data Sources & Bibliography
- Appendix M – Market Size Divergence & Source Comparison
Chapter 17. Research Methodology
- 17.1 Research Framework & Philosophy
- 17.2 Secondary Research – Sources, Hierarchy & Data Extraction
- 17.3 Data Modeling – Bottom-Up & Top-Down Market Sizing
- 17.4 Primary Research – Stakeholder Framework, LOI & Sample Sizes
- 17.5 Forecast Methodology – Regression, Scenario & Sensitivity Analysis
- 17.6 Quality Control – Four-Layer Validation Framework
- 17.7 Limitations & Standard Assumptions
- 17.8 Disclaimer
