| REPORT ATTRIBUTE |
DETAILS |
| Historical Period |
2020-2023 |
| Base Year |
2024 |
| Forecast Period |
2025-2032 |
| Submersible Pumps Market Size 2024 |
USD 12,236.72 Million |
| Submersible Pumps Market, CAGR |
5.46% |
| Submersible Pumps Market Size 2032 |
USD 18,652.64 Million |
Market Overview:
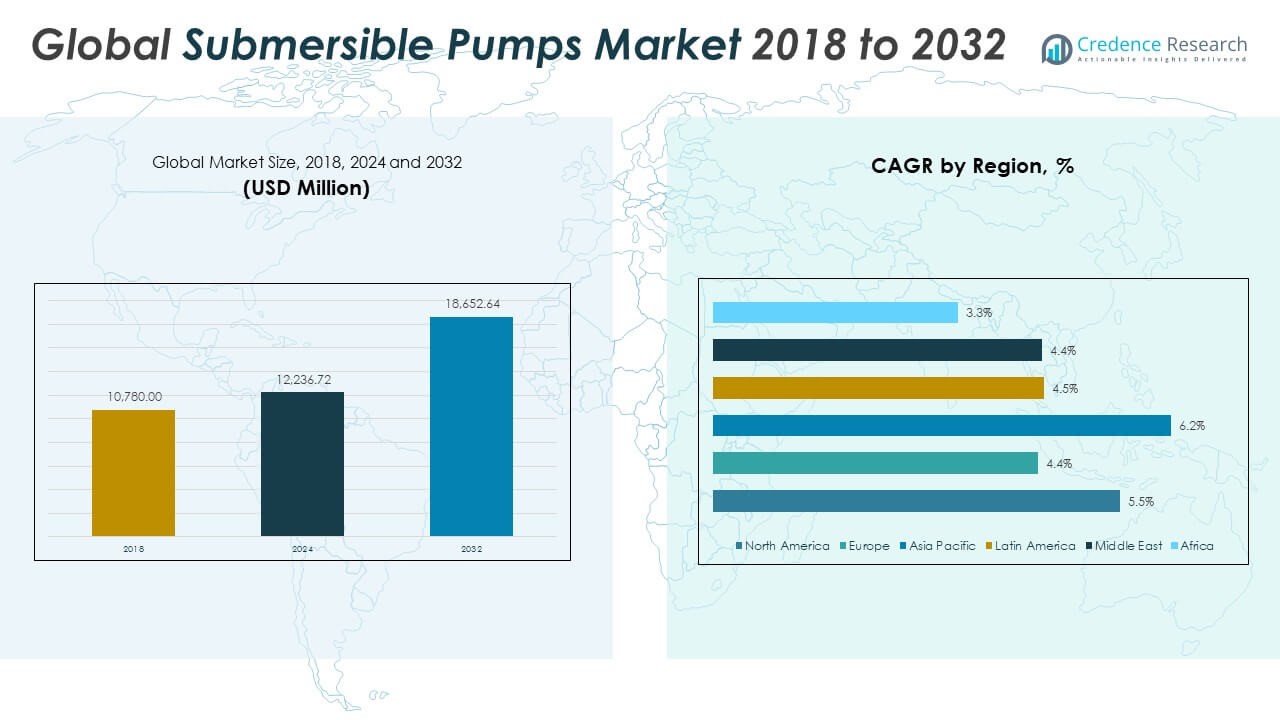
The Global Submersible Pumps Market size was valued at USD 10,780.00 million in 2018 to USD 12,236.72 million in 2024 and is anticipated to reach USD 18,652.64 million by 2032, at a CAGR of 5.46% during the forecast period.
Key drivers of the submersible pumps market include expanding urban populations, rising industrialization, and global water scarcity challenges. Governments and utility providers are investing in modern water management systems, where submersible pumps play a critical role in transporting water and managing wastewater. In agriculture, these pumps are essential for groundwater extraction and irrigation, particularly in regions with seasonal rainfall or unreliable surface water. The oil and gas sector contributes to demand through extensive use of electric submersible pumps in extraction and processing operations. Meanwhile, technological improvements such as smart pump monitoring, energy-efficient designs, and solar-powered models have enhanced reliability, operational lifespan, and total cost of ownership. These advances align with sustainability targets and infrastructure modernization efforts in both developed and developing economies.
Asia-Pacific leads the global submersible pumps market by revenue share, driven by significant infrastructure development, high agricultural water demand, and rural electrification programs in countries such as India, China, and Indonesia. Government initiatives, including large-scale rural water supply schemes, continue to accelerate adoption in the region. North America ranks second, with strong demand from municipal water systems, the oil and gas sector, and industrial users prioritizing energy-efficient pump solutions. Europe follows closely, where regulatory pressure on wastewater reuse and energy consumption encourages adoption of high-performance pumps in urban utilities and industry. The Middle East and Africa region sees increasing demand due to desalination projects, groundwater management, and agricultural expansion in arid zones. Latin America is witnessing moderate growth, supported by investment in water infrastructure and rural development. Across all regions, the market remains driven by the need for reliable, efficient, and durable pumping systems capable of operating in challenging environments.
Access crucial information at unmatched prices!
Request your sample report today & start making informed decisions powered by Credence Research Inc.!
Download Sample
Market Insights:
- The Global Submersible Pumps Market was valued at USD 10,780.00 million in 2018, reached USD 12,236.72 million in 2024, and is projected to hit USD 18,652.64 million by 2032, registering a CAGR of 5.46% during the forecast period.
- Government investments in water infrastructure are rising due to urbanization and scarcity, boosting demand for submersible pumps in wastewater transport and flood control systems.
- Agriculture continues to drive demand, with submersible pumps used for irrigation and groundwater extraction, especially in regions facing irregular rainfall and low surface water availability.
- The oil and gas industry contributes significantly through the use of electric submersible pumps in well operations, while mining and industrial sectors rely on them for fluid handling in harsh environments.
- Technological advancements such as smart monitoring, energy-efficient motors, and solar-powered submersible pumps are enhancing reliability and lowering total cost of ownership.
- Operational and maintenance costs remain a challenge, especially in deep or abrasive environments, where pump failures can disrupt critical processes and increase lifecycle expenses.
- Asia-Pacific leads the market due to strong infrastructure and agricultural demand, followed by North America and Europe, while Middle East & Africa and Latin America show steady growth from desalination and rural water projects.
Market Drivers:
Increasing Global Demand for Clean Water and Wastewater Management Infrastructure:
The Global Submersible Pumps Market benefits from growing investments in clean water access and modern wastewater systems. Rapid urbanization, population growth, and industrial expansion are placing pressure on municipalities to upgrade aging infrastructure and expand capacity. Governments are allocating funds toward sustainable water management projects, which require reliable pump solutions for fluid transport, drainage, and sewage treatment. Submersible pumps offer efficient operation in submerged conditions and are ideal for continuous use in wastewater and flood control systems. Their role in supporting both centralized and decentralized water systems enhances their demand across urban and rural regions. It continues to grow as cities scale up stormwater systems, address water contamination, and reduce losses in supply networks. Global focus on water resilience and public health reinforces their long-term utility.
- For instance, Xylem Inc. is a global leader in submersible pump solutions for municipal, industrial, and residential water management. Their stainless-steel submersible pumps are widely adopted for wastewater, mining, and flood control applications, offering high corrosion resistance and proven reliability in the world’s toughest environments.
Expanding Agricultural Irrigation and Groundwater Extraction Requirements:
Agriculture remains a vital sector for submersible pump applications, especially in water-scarce or monsoon-dependent regions. The Global Submersible Pumps Market gains significant traction from irrigation and groundwater pumping needs in countries with large rural populations and unreliable surface water sources. Farmers use submersible pumps to extract water from deep wells and boreholes to ensure consistent crop production throughout the year. Energy-efficient models that reduce electricity costs are increasingly favored in both large-scale and smallholder operations. Governments and rural development programs often subsidize pump deployment to improve food security and farm productivity. It supports mechanization in agriculture, helping farmers better manage water use and adapt to changing climate patterns. Rising agricultural exports and investments in farm modernization further strengthen pump demand.
- For instance, Grundfos launched the SQFlex Large solar submersible pump series across Asia Pacific, providing sustainable, off-grid water supply for agricultural irrigation and livestock watering.
Growth in Oil & Gas, Mining, and Industrial Infrastructure Development:
Substantial demand in the oil and gas industry supports the expansion of the Global Submersible Pumps Market. Operators deploy electric submersible pumps in oil wells to boost recovery rates and reduce production downtime. In mining, pumps are critical for dewatering open pits, shafts, and underground operations, ensuring safe and continuous production. Industrial sectors such as construction, chemicals, and manufacturing also rely on submersible pumps to manage wastewater, control flooding, and handle abrasive or corrosive liquids. It provides performance advantages in high-pressure and harsh environments where surface-mounted pumps are ineffective. The increase in energy infrastructure, resource extraction projects, and industrial facilities in both developed and emerging markets drives sustained adoption. High reliability and minimal maintenance requirements add to their value proposition across sectors.
Advancements in Energy-Efficient Technologies and Solar Pump Solutions:
Technology improvements are reshaping product performance and driving adoption across cost-sensitive and remote areas. The Global Submersible Pumps Market sees growing interest in energy-efficient motors, variable speed drives, and smart monitoring systems that improve operational control. Manufacturers are investing in pump designs that meet environmental regulations while lowering electricity consumption. In off-grid or low-infrastructure regions, solar-powered submersible pumps are gaining popularity due to their autonomy and low operating costs. It enables water access in remote agricultural fields, villages, and arid regions without conventional power sources. These innovations align with sustainability goals and energy transition strategies adopted by governments and industries. The market continues to evolve with technology that increases efficiency, reduces downtime, and extends service life.
Market Trends:
Increasing Integration of Smart Monitoring and IoT-Enabled Pump Systems:
Digitalization is reshaping the Global Submersible Pumps Market through the adoption of smart monitoring and Internet of Things (IoT) technologies. Pump manufacturers are integrating sensors and real-time data analytics into their systems to improve visibility, diagnostics, and remote control. These smart pumps help operators track performance metrics, detect faults, and schedule maintenance, which reduces downtime and extends service life. Utilities and industries benefit from lower operating costs and more accurate system management. It supports the shift toward predictive maintenance and intelligent asset monitoring across water utilities, industrial plants, and municipal applications. The trend reflects rising demand for automation in fluid management infrastructure, particularly in developed markets with advanced digital ecosystems.
- For instance, Sulzer’s BLUE BOX™ is an IoT-based remote analytics platform for pump performance optimization. In 2024, Sulzer connected 40 performance-critical pumps in real-time for Phillips 66 pipelines, enabling significant operational improvements, predictive maintenance, and cost savings through actionable insights and asset optimization.
Growing Focus on Material Innovation and Corrosion-Resistant Design:
Material technology is playing a pivotal role in product differentiation across the Global Submersible Pumps Market. Manufacturers are investing in high-durability materials such as stainless-steel alloys, reinforced polymers, and advanced composites that withstand harsh operating conditions. These innovations improve resistance to corrosion, abrasion, and chemical exposure, especially in mining, oil and gas, and wastewater applications. It enhances pump performance in aggressive environments while reducing maintenance needs and replacement cycles. The trend also supports energy conservation, as lighter and more durable materials improve hydraulic efficiency. Regulatory emphasis on environmental compliance and safety standards encourages further adoption of advanced pump designs. Product development strategies increasingly focus on balancing strength, cost-effectiveness, and environmental compatibility.
- For instance, KSB launched the UPA S 250 submersible borehole pump series with all cast components made of high-grade stainless steel (1.4408 or 1.4517), achieving high efficiency and extended service life in aggressive environments such as mine dewatering and groundwater management. The pumps cover flow rates between 60 and 400 cubic meters per hour with a maximum head of 360 meters.
Expansion of Customized Pumping Solutions for Niche Applications:
Demand for specialized pumping systems is gaining momentum in segments requiring application-specific designs. The Global Submersible Pumps Market is seeing a shift toward custom-engineered solutions tailored to unique operational needs in sectors such as aquaculture, pharmaceuticals, food processing, and desalination. Clients are seeking products that meet specific pressure ranges, fluid properties, installation constraints, and power availability. It encourages closer collaboration between pump manufacturers, system integrators, and end-users to deliver high-precision solutions. The trend reflects growing diversity in end-user requirements and greater focus on performance optimization. Tailored pump systems help reduce inefficiencies and ensure compliance with stringent industry standards, enhancing their appeal across niche sectors.
Rising Adoption of Modular and Prefabricated Pump Systems:
Modular design principles are gaining traction in the Global Submersible Pumps Market, driven by the need for flexible and scalable solutions. Prefabricated systems allow for faster deployment, simplified maintenance, and easy replacement of components, especially in remote or space-constrained locations. Standardized modular units can be configured to meet varying capacity and head requirements, enabling efficient customization. It reduces installation time and labor costs, supporting faster project execution in infrastructure and industrial settings. The trend aligns with growing demand for off-site fabrication and plug-and-play systems in water treatment, mining, and utility-scale applications. Suppliers are expanding modular product lines to address market needs for adaptability, speed, and cost control.
Market Challenges Analysis:
High Operational and Maintenance Costs in Harsh Environments:
One of the key challenges facing the Global Submersible Pumps Market is the high cost of operation and maintenance, especially in extreme and abrasive environments. Submersible pumps often operate in deep wells, corrosive fluids, or high-solid-content conditions, which lead to rapid wear and frequent servicing needs. Downtime due to pump failure can disrupt critical processes in water supply, mining, and oil production, making reliability a top concern. It requires durable components and regular monitoring, which increase both capital and lifecycle costs. Energy consumption is another issue, particularly in older or oversized systems that lack efficiency controls. These cost burdens can delay adoption in cost-sensitive markets or lead to short-term solutions that compromise long-term performance. End users often weigh these factors against benefits before committing to large-scale deployments.
Lack of Skilled Workforce and Technical Expertise in Developing Regions:
The shortage of skilled technicians and pump system experts creates a deployment barrier in many emerging markets. The Global Submersible Pumps Market depends on proper sizing, installation, and maintenance to ensure performance and longevity. In regions with limited technical capacity, incorrect setup or delayed maintenance can shorten equipment life and reduce operational efficiency. It becomes difficult for operators to diagnose system faults or optimize energy use without trained personnel. Distributors and manufacturers face added pressure to provide training and aftersales support, which increases costs and slows market expansion. Language barriers, inconsistent standards, and limited access to diagnostic tools also affect service quality. Building a strong technical ecosystem remains critical for market growth in underserved geographies.
Market Opportunities:
Expanding Investments in Rural Water Supply and Electrification Projects:
The Global Submersible Pumps Market has strong growth potential in rural infrastructure initiatives targeting clean water access and electrification. Governments and international agencies are funding large-scale programs to improve rural water delivery through borewell and tube well systems. Submersible pumps offer a dependable solution in areas with limited surface water and require minimal above-ground infrastructure. It enables water extraction from deep aquifers to support households, agriculture, and small-scale industries. Demand is further supported by the integration of decentralized renewable energy sources such as solar power, which reduces dependence on unreliable grids. Suppliers that align with public-sector tenders and rural development projects can access new and underserved markets.
Emerging Demand for Sustainable and Energy-Efficient Pumping Solutions:
Sustainability goals and rising energy costs create strong opportunities for energy-efficient submersible pump technologies. Industries and municipalities are seeking advanced motor systems, variable frequency drives, and solar-compatible units to reduce electricity use and environmental impact. The Global Submersible Pumps Market is positioned to benefit from this shift, particularly in regions with energy access challenges or regulatory mandates for carbon reduction. It encourages innovation in design, materials, and integration with digital control systems. Manufacturers offering certified, high-efficiency pumps can capture market share by addressing both performance and sustainability requirements. End users increasingly prioritize long-term savings and lifecycle value over initial cost.
Market Segmentation Analysis:
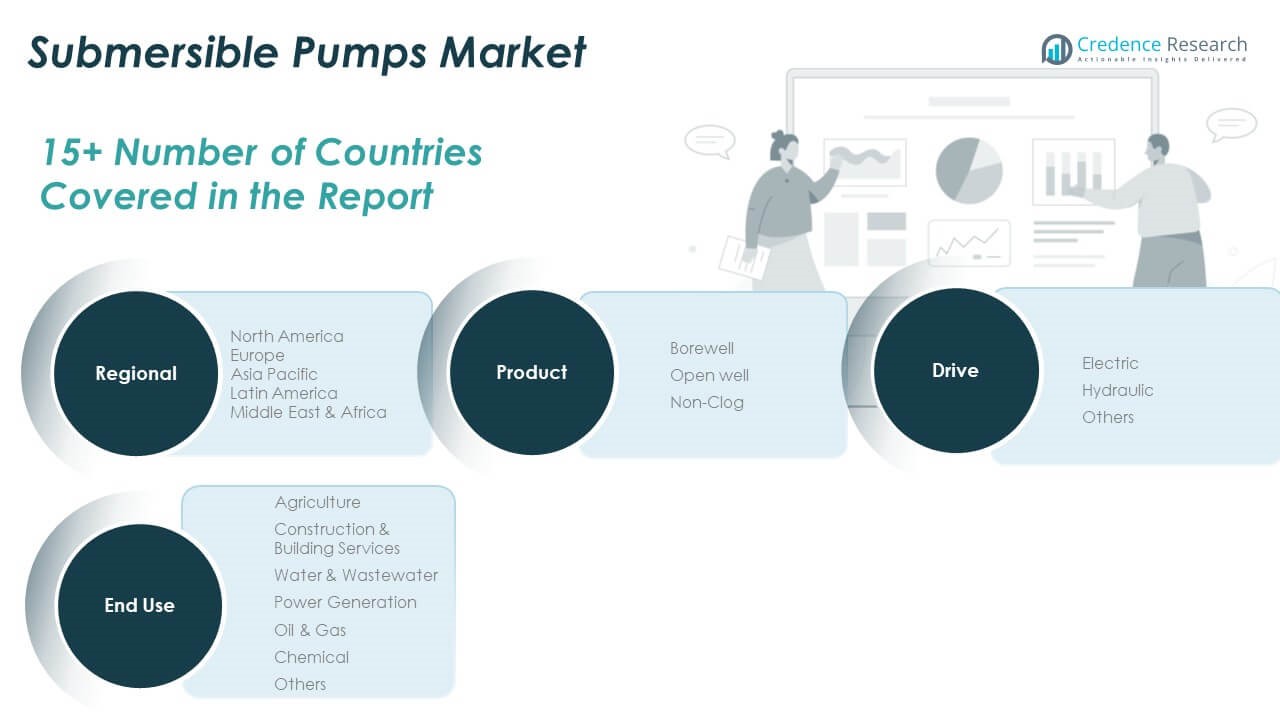
By Product
The Global Submersible Pumps Market includes three primary product categories: borewell, open well, and non-clog pumps. Borewell pumps account for the largest share due to their ability to extract water from deep aquifers, making them essential in agriculture, municipal supply, and industrial operations. Open well pumps are suitable for shallow water sources and are widely used in rural and semi-urban irrigation systems. Non-clog pumps handle liquids with high solid content and are deployed in sewage, drainage, and wastewater treatment systems where durability and continuous operation are critical.
- For instance, Kirloskar Brothers Limited’s KU6 and KU7P borewell pumps are designed for deep aquifer extraction and are widely used in agriculture and municipal supply projects, delivering high efficiency and low maintenance for continuous operation.
By Drive
Drive types in the market include electric, hydraulic, and others. Electric submersible pumps dominate the segment because of their high energy efficiency, ease of integration, and broad applicability in domestic, agricultural, and commercial environments. Hydraulic pumps serve niche markets like mining and oil extraction, where electric supply may be unreliable or unsafe. The ‘others’ category includes solar and pneumatic systems, increasingly used in remote areas with limited grid access.
- For instance, Franklin Electric launched the Minetuff Series electric submersible dewatering pumps in 2024, with models ranging from 8 to 140 horsepower and capable of operating in wells as deep as 245 feet. These pumps are engineered for rugged performance in mining, construction, and municipal dewatering applications.
By End-use
The market serves various end-use industries: agriculture, construction & building services, water & wastewater, power generation, oil & gas, chemical, and others. Agriculture leads the segment, driven by demand for reliable irrigation solutions in water-scarce regions. Water & wastewater management is another key application, with rising investments in municipal infrastructure. Construction and building services require submersible pumps for site dewatering and fluid handling. The oil & gas and chemical sectors utilize pumps for transporting corrosive or viscous fluids. The Global Submersible Pumps Market continues to support each of these sectors with robust, application-specific pumping systems.
Segmentation:
By Product
- Borewell
- Open Well
- Non-Clog
By Drive
- Electric
- Hydraulic
- Others
By End-use
- Agriculture
- Construction & Building Services
- Water & Wastewater
- Power Generation
- Oil & Gas
- Chemical
- Others
By Region
- North America
- Europe
- UK
- France
- Germany
- Italy
- Spain
- Russia
- Rest of Europe
- Asia Pacific
- China
- Japan
- South Korea
- India
- Australia
- Southeast Asia
- Rest of Asia Pacific
- Latin America
- Brazil
- Argentina
- Rest of Latin America
- Middle East
- GCC Countries
- Israel
- Turkey
- Rest of Middle East
- Africa
- South Africa
- Egypt
- Rest of Africa
Regional Analysis:
North America
The North America Submersible Pumps Market size was valued at USD 2,296.14 million in 2018 to USD 2,552.51 million in 2024 and is anticipated to reach USD 3,881.65 million by 2032, at a CAGR of 5.5% during the forecast period. North America holds a 17.6% share of the Global Submersible Pumps Market. It benefits from well-established industrial and municipal infrastructure, especially in the United States and Canada. Investments in wastewater treatment and oil & gas exploration contribute to steady demand. The construction and agriculture sectors also drive volume-based purchases of submersible pumps. Market players focus on energy-efficient models to comply with regional energy regulations. It sees consistent replacement demand due to aging infrastructure and compliance upgrades.
Europe
The Europe Submersible Pumps Market size was valued at USD 1,968.43 million in 2018 to USD 2,109.28 million in 2024 and is anticipated to reach USD 2,953.70 million by 2032, at a CAGR of 4.4% during the forecast period. Europe accounts for a 14.5% share of the Global Submersible Pumps Market. Industrial sectors such as chemicals, pharmaceuticals, and food processing continue to support market growth. Strict water discharge norms promote the use of high-efficiency wastewater pumps. Germany, France, and the UK lead demand due to ongoing infrastructure modernization. It faces moderate growth, influenced by energy efficiency mandates and environmental policies. Suppliers emphasize low-noise, corrosion-resistant designs to meet urban utility requirements.
Asia Pacific
The Asia Pacific Submersible Pumps Market size was valued at USD 5,088.16 million in 2018 to USD 5,908.45 million in 2024 and is anticipated to reach USD 9,499.81 million by 2032, at a CAGR of 6.2% during the forecast period. Asia Pacific commands a 40.8% share of the Global Submersible Pumps Market, making it the largest regional contributor. It benefits from high agricultural activity, rapid urbanization, and major investments in infrastructure. China and India dominate demand due to extensive irrigation needs and expanding industrial sectors. It sees growing installations in residential and municipal applications, supported by smart city initiatives. Manufacturers expand regional production to reduce lead times and cost. The region’s long-term outlook remains robust due to rising water stress and government-backed utility projects.
Latin America
The Latin America Submersible Pumps Market size was valued at USD 652.19 million in 2018 to USD 732.86 million in 2024 and is anticipated to reach USD 1,032.80 million by 2032, at a CAGR of 4.5% during the forecast period. Latin America holds a 5.7% share of the Global Submersible Pumps Market. It relies heavily on submersible pumps in agriculture, particularly in Brazil and Argentina. Water management for urban areas and mining activities also contribute to regional demand. It faces challenges such as economic volatility and limited modernization of water infrastructure. Demand is supported by public-private investments in rural electrification and irrigation programs. Local manufacturers compete on pricing and durability to serve regional needs.
Middle East
The Middle East Submersible Pumps Market size was valued at USD 515.28 million in 2018 to USD 555.47 million in 2024 and is anticipated to reach USD 781.65 million by 2032, at a CAGR of 4.4% during the forecast period. The Middle East accounts for a 3.6% share of the Global Submersible Pumps Market. It sees demand primarily from oil & gas operations, desalination facilities, and urban infrastructure. Gulf Cooperation Council (GCC) countries invest in advanced pumping systems to ensure water security. It benefits from regional focus on energy-efficient and solar-powered pumps. Harsh environmental conditions require corrosion-resistant and explosion-proof designs. Market expansion depends on infrastructure diversification beyond oil revenues.
Africa
The Africa Submersible Pumps Market size was valued at USD 259.80 million in 2018 to USD 378.16 million in 2024 and is anticipated to reach USD 503.05 million by 2032, at a CAGR of 3.3% during the forecast period. Africa represents a 2.1% share of the Global Submersible Pumps Market. It shows growing potential in rural water supply, irrigation, and off-grid applications. Countries like Nigeria, Kenya, and South Africa lead market demand through donor-funded water projects. It faces challenges from inadequate grid infrastructure and limited access to capital. Solar submersible pumps gain traction to address electrification gaps. International development agencies and NGOs continue to support pump deployment for water access.
Shape Your Report to Specific Countries or Regions & Enjoy 30% Off!
Key Player Analysis:
- Xylem
- Sulzer Ltd.
- KSB SE & Co. KGaA
- Grundfos Holding A/S
- Atlas Copco
- Flowserve
- Wilo SE
- Homa Pump Technology
- LEO Group Pump (Zhejiang) Co., Ltd.
- VANSAN Water Technologies
- Grindex
- HCP Pump Manufacturer Co., Ltd.
- EBARA International Corporation
- Schlumberger Limited
- ITT Inc.
Competitive Analysis:
The Global Submersible Pumps Market features intense competition among established multinational players and regional manufacturers. It is characterized by innovation in motor efficiency, corrosion resistance, and remote monitoring capabilities. Key companies such as Grundfos, Xylem Inc., Sulzer Ltd., KSB SE & Co. KGaA, and Ebara Corporation dominate through strong product portfolios and global distribution networks. These firms invest in R&D and energy-efficient technologies to meet rising demand from municipal, industrial, and agricultural sectors. Emerging players in Asia-Pacific focus on cost-effective solutions to penetrate rural and small-scale industrial markets. The market exhibits consolidation through strategic mergers and partnerships aimed at expanding product offerings and geographic reach. It is highly sensitive to regulatory standards related to energy consumption and water conservation. Companies differentiate by offering durable materials, advanced control systems, and tailored pumping solutions. The Global Submersible Pumps Market continues to evolve as players adopt digital tools to enhance service and operational reliability.
Recent Developments:
- In July 2025, KSB SE & Co. KGaA launched the AmaCan P type series, a new generation of submersible motor pumps with axial propellers. These pumps are engineered for large-volume municipal and industrial water transport, stormwater, drainage, and irrigation, featuring advanced corrosion-resistant materials, intelligent sensor monitoring, and high hydraulic efficiencies.
- In June 2025, Grundfos Holding A/S signed an agreement to acquire Newterra Corp., expanding its water and wastewater treatment solutions portfolio in North America. This acquisition strengthens Grundfos’ presence in the U.S. and Canadian markets and supports its strategic ambition to double its North American business by 2030.
- In March 2025, Flowserve launched the INNOMAG TB-MAG Dual Drive Pump, the world’s first sealless pump with true secondary containment. This innovation sets a new safety standard by providing a double hermetic seal and independent containment system, enhancing environmental protection for hazardous fluid handling.
- In February 2025, Xylem announced the launch of the Jabsco Sensor-Max II, a new freshwater pump designed for greater efficiency in boat and RV applications. This pump features advanced sensor technology for precise control and improved energy efficiency, supporting Xylem’s commitment to innovation in water solutions.
Market Concentration & Characteristics:
The Global Submersible Pumps Market demonstrates moderate to high market concentration, with leading players controlling a significant portion of global revenue. It is defined by high entry barriers due to capital-intensive manufacturing, technical expertise, and stringent product quality standards. The market favors vertically integrated companies with capabilities in design, production, and after-sales services. It serves diverse applications including water and wastewater management, agriculture, oil and gas, and construction. Product differentiation relies on pump efficiency, durability, and adaptability to harsh environments. The market shows cyclical demand influenced by infrastructure development, groundwater extraction, and industrial activity. It supports customization to meet varied end-user requirements across geographies. The Global Submersible Pumps Market rewards innovation and reliability, pushing manufacturers to invest in smart technologies and energy-efficient systems to remain competitive.
Report Coverage:
The research report offers an in-depth analysis based on product, drive and end use. It details leading market players, providing an overview of their business, product offerings, investments, revenue streams, and key applications. Additionally, the report includes insights into the competitive environment, SWOT analysis, current market trends, as well as the primary drivers and constraints. Furthermore, it discusses various factors that have driven market expansion in recent years. The report also explores market dynamics, regulatory scenarios, and technological advancements that are shaping the industry. It assesses the impact of external factors and global economic changes on market growth. Lastly, it provides strategic recommendations for new entrants and established companies to navigate the complexities of the market.
Future Outlook:
- Rising global demand for efficient water and wastewater management will support long-term market expansion.
- Growth in agricultural mechanization will drive adoption of submersible pumps for irrigation and drainage.
- Urban infrastructure projects and smart city initiatives will increase deployment in municipal applications.
- Energy-efficient pump models will gain traction amid tightening environmental regulations.
- Technological advances such as IoT-enabled pumps will improve remote monitoring and predictive maintenance.
- Expansion of industrial activities in emerging economies will boost demand across manufacturing sectors.
- Aging water infrastructure in developed markets will create replacement and retrofitting opportunities.
- Strategic investments in solar-powered submersible pumps will address off-grid and rural water needs.
- OEMs will strengthen aftermarket service capabilities to retain customers and increase recurring revenue.
- Consolidation among key players is expected to intensify competition and streamline global supply chains.


