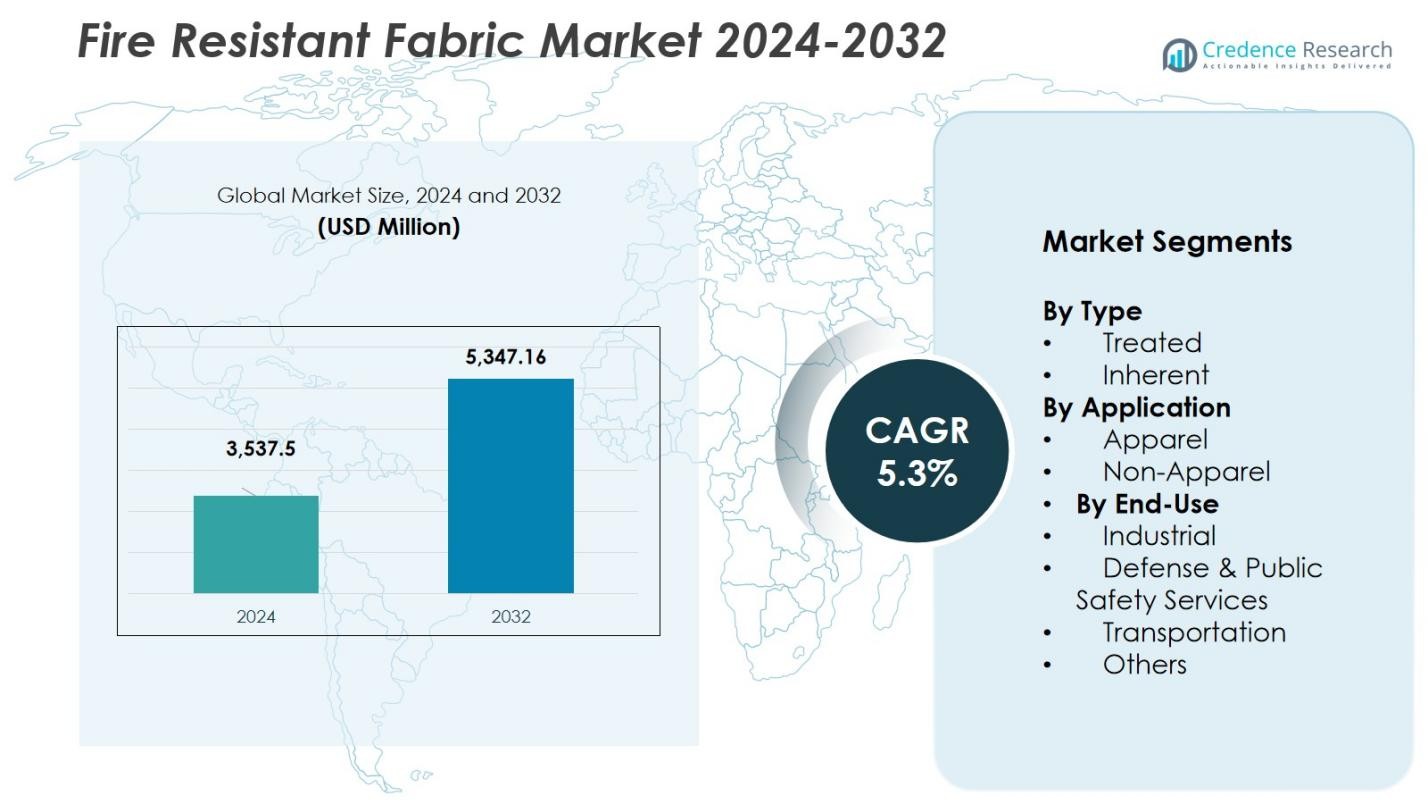
Fire Resistant Fabric Market By Price (Range, Low, Medium, High)-Growth, Future Prospects & Competitive Analysis, 2016 – 2030

Price: $4999

Published: | Report ID: 20846 | Report Format : PDF

Market Insights

  • The fire-resistant fabric marketplace is witnessing significant growth, driven by the growing call for safety apparel and textiles throughout diverse industries.
  • Stringent safety policies imposed by authorities, government, and regulatory bodies have compelled corporations to adopt fire-resistant fabric to guard employees against fire hazards.
  • Moreover, emerging economies’ developing industrialization and infrastructure development have similarly accelerated the demand for fire-resistant fabric.
  • These fabrics provide enhanced safety in opposition to fire injuries, lowering the hazard of injuries and fatalities inside the place of work.

Fire Resistant Fabric Market

Executive Summary

Market Definition

The international fire-resistant fabric market is experiencing a huge increase because of numerous elements, consisting of stringent safety regulations, developing industrialization, growing focus approximately place of job safety, growing incidences of fire injuries, and technological advancements.

Design Element 2

Access crucial information at unmatched prices!

Request your free sample report today & start making informed decisions powered by Credence Research!

Download Free Sample
CTA Design Element 3

These drivers, along with numerous market opportunities, are fueling the expansion of the fire-resistant fabric market. However, the market faces certain challenges, consisting of the high cost of fire-resistant fabrics, limited comfort and fashion alternatives, and the provision of substitutes.

Players are exploring emerging markets, investing, development activities, and focusing on integrating smart textiles to capitalize on the market’s capability.

Market Overview

The fire-resistant fabric market is segmented based on product type, application, end-use industry, and region. Treated fire-resistant fabric dominates the marketplace due to its ability to face high temperatures and resist flames.

This segment includes fabric handled with flame-retardant chemical substances, making them inherently fire-resistant. Treated fire-resistant fabric discovers enormous commercial safety applications, including coveralls, jackets, pants, and gloves.

Key Highlights of the Report

The international fire-resistant fabric marketplace is projected to attain sales of USD 8,374.15 million by 2030, with a Compound Annual Growth Rate (CAGR) of 6.33% between 2023 and 2030. In 2022, the market revenue changed into envisioned at USD 5,125.36 million.

Asia Pacific accounted for the most important share of the fire-resistant fabric market. The vicinity’s dominance may be attributed to rapid industrialization and strict safety regulations in countries like China and India.

Treated fire-resistant fabric emerged as the dominant segment in the marketplace, owing to its superior fire-resistant properties and vast adoption across various industries.

Industrial protective garb represents the leading segment in the fire-resistant fabric market, driven using the increasing call for safety clothing in industries that includes oil and fuel, production, manufacturing, and chemical.

Fire Resistant Fabric Market

What Are the Main Drivers of the Fire Resistant Fabric Market?

Stringent safety regulations, growing industrialization, increasing awareness about workplace safety, technological advancements, and emerging incidences of fire accidents.

What Are The Major Challenges Faced By the Fire Resistance Fabric Market?

High cost of flame-resistant fabrics, limited comfort and style options, and availability of substitutes.

What Are The Growth Opportunities In the Fire Resistant Fabric Market?

Emerging markets, research and development, and integration of smart textiles.

Stringent Safety Regulations

Government policies and enterprise regulations mandating fire-resistant fabrics in places of work have driven market growth. These rules purpose to decrease the hazard of fire accidents and defend people from dangerous situations. Compliance with safety regulations has come to be vital for industries to make certain employee safety and keep away from felony effects.

Growing Industrialization

The rapid growth in business sectors, mainly in emerging economies, has fueled the demand for fire-resistant fabric. Industries, including oil and gas, chemical, creation, and production, require robust safety measures to guard employees and property from fire dangers. This has brought about increased adoption of fire-resistant fabric in commercial environments.

Increasing Awareness about Workplace Safety

Employers and personnel have a growing awareness of the significance of place of work safety. Workers are increasingly demanding defensive clothing and equipment to ensure their well-being. This growing awareness has substantially contributed to adopting fire-resistant fabrics, which give high safety against fire accidents.

Emerging Incidences of Fire Accidents

Fire injuries in commercial and industrial settings have expanded, ensuing in sizable economic losses and human casualties. These incidents have underscored the importance of fire safety measures, prompting industries to invest in fire-resistant fabrics. Using such fabric minimizes the threat of fire-associated injuries and fatalities, making them vital to place of job safety protocols.

Technological Advancements

Advancements in textile generation have played a vital function in developing revolutionary fire-resistant fabrics. Manufacturers are incorporating superior fabrics and fabric remedies to enhance textiles’ fire resistance and sturdiness.

Integrating nanotechnology and segment-change substances has similarly improved the overall performance of fire-resistant fabrics, making them extra effective and efficient in fire prevention.

High Cost of Flame-Resistant Fabrics

The cost of flame-resistant fabric is noticeably higher compared to traditional fabric. The extra cost is related to incorporating fire-resistant properties, including chemical treatments or specialized fibers, contribute to the increased cost of these fabrics. The higher price of fire-resistant fabrics poses a challenge for cost-sensitive industries, limiting their adoption.

Limited Comfort and Style Options

Fire-resistant fabrics regularly face obstacles in phrases of comfort and style alternatives. Incorporating fire-resistant residences can affect the fabric’s breathability, flexibility, and comfort. Additionally, the layout and style selections for fire-resistant garb are highly constrained, mainly concerning these garments’ aesthetics and wear ability.

Availability of Substitutes

Despite the advantages of fire-resistant fabric, alternative solutions are available in the marketplace. For example, flame-resistant coatings and treatments may be implemented in traditional fabrics, providing temporary fire-resistant properties. Industries may choose fire-resistant barriers and protective coatings as opposed to fire-resistant fabrics. The availability of substitutes poses a project to the growth of the fire-resistant fabric marketplace.

Emerging Markets

Emerging economies present significant possibilities for the fire-resistant fabric marketplace. The fast industrialization, infrastructural improvement, and growing workplace safety recognition in international locations like China, India, Brazil, and Indonesia offer favorable market surroundings. These areas are witnessing a surge in business activities, increasing the demand for fire-resistant fabric.

Research and Development

Investments in research and development activities can result in the improvement of superior fire-resistant fabric with progressive properties. Innovations in fiber technology, fabric systems, and chemical treatments can enhance fabrics’ fire resistance, comfort, and sturdiness. Companies focusing on R&D can gain a competitive edge by introducing novel fire-resistant solutions.

Integration of Smart Textiles

Integrating smart textile technologies with fire-resistant fabric provides sizeable opportunities within the market. Smart textiles with sensors, monitoring structures, and conversation skills can provide real-time information about the wearer’s safety.

These intelligent fabrics can enhance the effectiveness of fire-resistant fabrics by imparting early warning systems and facilitating prompt response in the event of fire injuries.

Key Players

The fire resistant fabric market is highly competitive, with several key players. Some of the major players in the market and their market share are as follows:

  • DuPont de Nemours, Inc.
  • Milliken & Company
  • PBI Performance Products, Inc.
  • Teijin Aramid
  • Solvay S.A.
  • Westex by Milliken
  • Kermel

These are only some key players within the fire-resistant fabric market. Other great players include Carrington Textiles Ltd, TenCate Protective Fabrics, and W.L. Gore & Associates, Inc. The marketplace is especially competitive, and players try to distinguish themselves thru product innovation, strategic partnerships, and geographical growth.

Summary of Key Findings

  • The international fire-resistant fabric marketplace is projected to reach USD 8,374.15 million by 2030, growing at a CAGR of 6.33% between 2023 and 2030.
  • Asia Pacific leads the marketplace, driven by fast industrialization and stringent safety policies.
  • Treated fire-resistant fabric dominates the market, specifically in business protective apparel.
  • Stringent safety regulations, developing industrialization, increasing cognizance of approximate places of job safety, emerging incidences of fire accidents, and technological advancements are the primary marketplace drivers.
  • The excessive price of flame-resistant fabric restricted comfort and fashion alternatives, and the provision of substitutes poses challenges to market growth.
  • Emerging markets, research and improvement, and the integration of clever textiles present great possibilities for marketplace enlargement.

Shape Your Report to Specific Countries or Regions & Enjoy 30% Off!

Future Outlook

  • The fire-resistant fabric marketplace is anticipated to develop within the coming years.
  • The growing awareness of administrative center safety and stringent safety regulations will pressure the call for fire-resistant fabrics.
  • Advancements in textile technology, together with integrating smart textiles, will further decorate the performance and capability of fire-resistant fabric.
  • To capitalize on the marketplace’s ability, key players should invest in studies and improvement, increase their product portfolios, and leverage emerging markets to benefit an aggressive gain.

Segmentation

  • By Price Range
    • Low
    • Medium
    • High
  • By Region
    • North America
      • Canada
      • Mexico
    • Europe
      • Germany
      • France
      • U.K.
      • Italy
      • Spain
      • Rest of Europe
    • Asia Pacific
      • China
      • Japan
      • India
      • South Korea
      • South-east Asia
      • Rest of Asia Pacific
    • Latin America
      • Brazil
      • Argentina
      • Rest of Latin America
    • Middle East & Africa
      • GCC Countries
      • South Africa
      • Rest of Middle East and Africa

CHAPTER NO. 1 : INTRODUCTION 15
1.1. Report Description 15
1.1.1. Purpose of the Report 15
1.1.2. USP & Key Offerings 15
1.2. Key Benefits for Stakeholders 15
1.3. Target Audience 16
1.4. Report Scope 16

CHAPTER NO. 2 : EXECUTIVE SUMMARY 19
2.1. Fire Resistant Fabric Market Snapshot 19
2.2. Global Fire Resistant Fabric Market, 2017 – 2030 (Million Sq Mtr) (USD Million) 21
2.1. Insights from Primary Respondents 21

CHAPTER NO. 3 : COVID 19 IMPACT ANALYSIS 22
3.1. Impact Assessment of COVID-19 Pandemic, By Region 22

CHAPTER NO. 4 : FIRE RESISTANT FABRIC MARKET – INDUSTRY ANALYSIS 23
4.1. Introduction 23
4.2. Market Drivers 24
4.2.1. Stringent Safety Regulations 24
4.2.2. Increasing Awareness about Workplace Safety 25
4.3. Market Restraints 25
4.3.1. Restraining Factor Analysis 25
4.4. Market Opportunities 26
4.4.1. Market Opportunity Analysis 26
4.5. Porter’s Five Forces Analysis 26
4.6. Value Chain Analysis 27

CHAPTER NO. 5 : KEY INVESTMENT POCKETS ANALYSIS 28
5.1. Top Investment Pockets 28
5.1.1.1. Fire Resistant Fabric Market Attractiveness Analysis, By Type 28
5.1.1.2. Fire Resistant Fabric Market Attractiveness Analysis, By Application 28
5.2. Product Life Cycle Analysis 29
5.3. Incremental Revenue Growth Opportunity, 2023 – 2030 30
5.3.1. Type 30
5.3.2. Application 30

CHAPTER NO. 6 : IMPORT EXPORT ANALYSIS 31
6.1. Import Analysis by Region 31
6.1.1. Global Fire Resistant Fabric Market Import Volume, By Region, 2017 – 2022 (Million Sq Mtr) 31
6.2. Export Analysis by Region 31
6.2.1. Global Fire Resistant Fabric Market Export Volume, By Region, 2017 – 2022 (Million Sq Mtr) 31

CHAPTER NO. 7 : DEMAND SUPPLY ANALYSIS 32
7.1. Demand Analysis by Region 32
7.1.1. Global Fire Resistant Fabric Market Demand Volume, By Region, 2017 – 2022 (Million Sq Mtr) 32
7.2. Supply Analysis by Region 32
7.2.1. Global Fire Resistant Fabric Market Supply Volume, By Region, 2017 – 2022 (Million Sq Mtr) 32

CHAPTER NO. 8 : MARKET POSITIONING OF KEY PLAYERS 33
8.1. Company Market Share Analysis –2020 and 2022 33
8.1.1. Global Fire Resistant Fabric Market: Company Market Share, 2022 33
8.1.2. Global Fire Resistant Fabric Market: Company Market Share, 2022 33
8.1. Global Fire Resistant Fabric Market Company Volume Market Share, 2022 34
8.2. Global Fire Resistant Fabric Market Company Revenue Market Share, 2022 35
8.3. Market Position of Key Players 2022 36
8.3.1. Market Position of Key Players, 2022 36
8.4. Strategic Developments 37
8.4.1. Acquisitions & Mergers 37
8.4.2. New Product Launch 37
8.4.3. Regional Expansion 37

CHAPTER NO. 9 : FIRE RESISTANT FABRIC MARKET – BY TYPE SEGMENT ANALYSIS 38
9.1. Fire Resistant Fabric Market Overview, by Type Segment 38
9.1.1. Global Fire Resistant Fabric Market Volume Share, By Type, 2022 & 2030 39
9.1.2. Global Fire Resistant Fabric Market Revenue Share, By Type, 2022 & 2030 39
9.2. Inherent Fire Resistant Fabric 40
9.2.1. Global Inherent Fire Resistant Fabric Fire Resistant Fabric Market Volume, By Region, 2017 – 2022 (Million Sq Mtr) 40
9.2.2. Global Inherent Fire Resistant Fabric Fire Resistant Fabric Market Revenue, By Region, 2017 – 2022 (USD Million) 41
9.3. Treated Fire Resistant Fabric 42
9.3.1. Global Treated Fire Resistant Fabric Fire Resistant Fabric Market Volume, By Region, 2017 – 2022 (Million Sq Mtr) 42
9.3.2. Global Inherent Fire Resistant Fabric Fire Resistant Fabric Market Revenue, By Region, 2017 – 2022 (USD Million) 43

CHAPTER NO. 10 : FIRE RESISTANT FABRIC MARKET – BY APPLICATION SEGMENT ANALYSIS 50
10.1. Fire Resistant Fabric Market Overview, by Application Segment 50
10.1.1. Global Fire Resistant Fabric Market Volume Share, By Application, 2022 & 2030 51
10.1.2. Global Fire Resistant Fabric Market Revenue Share, By Application, 2022 & 2030 51
10.2. Industrial Protective Clothing 52
10.2.1. Global Fire Resistant Fabric for Industrial Protective Clothing Market Volume, By Region, 2017 – 2022 (Million Sq Mtr) 52
10.2.2. Global Fire Resistant Fabric for Industrial Protective Clothing Market Revenue, By Region, 2017 – 2022 (USD Million) 53
10.3. Law Enforcement and Firefighting Services 54
10.3.1. Global Fire Resistant Fabric for Law Enforcement and Firefighting Services Market Volume, By Region, 2017 – 2022 (Million Sq Mtr) 54
10.3.2. Global Fire Resistant Fabric for Law Enforcement and Firefighting Services Market Revenue, By Region, 2017 – 2022 (USD Million) 55
10.4. Transport 56
10.4.1. Global Fire Resistant Fabric for Transport Market Volume, By Region, 2017 – 2022 (Million Sq Mtr) 56
10.4.2. Global Fire Resistant Fabric for Transport Market Revenue, By Region, 2017 – 2022 (USD Million) 57
10.5. Others 58
10.5.1. Global Fire Resistant Fabric for Others Market Volume, By Region, 2017 – 2022 (Million Sq Mtr) 58
10.5.2. Global Fire Resistant Fabric for Others Market Revenue, By Region, 2017 – 2022 (USD Million) 59

CHAPTER NO. 11 : FIRE RESISTANT FABRIC MARKET – REGIONAL ANALYSIS 62
11.1. Fire Resistant Fabric Market Overview, by Region Segment 62
11.1.1. Global Fire Resistant Fabric Market Volume Share, By Region, 2022 & 2030 63
11.1.2. Global Fire Resistant Fabric Market Revenue Share, By Region, 2022 & 2030 63
11.1.3. Global Fire Resistant Fabric Market Volume, By Region, 2017 – 2022 (Million Sq Mtr) 64
11.1.4. Global Fire Resistant Fabric Market Revenue, By Region, 2017 – 2022 (USD Million) 65
11.1.5. Global Fire Resistant Fabric Market Volume, By Type, 2017 – 2022 (Million Sq Mtr) 66
11.1.6. Global Fire Resistant Fabric Market Revenue, By Type, 2017 – 2022 (USD Million) 67
11.1.7. Global Fire Resistant Fabric Market Volume, By Application, 2017 – 2022 (Million Sq Mtr) 68
11.1.8. Global Fire Resistant Fabric Market Revenue, By Application, 2017 – 2022 (USD Million) 69
11.2. North America 70
11.2.1. North America Fire Resistant Fabric Market Volume, By Country, 2017 – 2022 (Million Sq Mtr) 71
11.2.2. North America Fire Resistant Fabric Market Revenue, By Country, 2017 – 2022 (USD Million) 71
11.2.2.1. North America Fire Resistant Fabric Market Volume, By Type, 2017 – 2022 (Million Sq Mtr) 72
11.2.3. North America Fire Resistant Fabric Market Revenue, By Type, 2017 – 2022 (USD Million) 73
11.2.4. North America Fire Resistant Fabric Market Volume, By Application, 2017 – 2022 (Million Sq Mtr) 74
11.2.5. North America Fire Resistant Fabric Market Revenue, By Application, 2017 – 2022 (USD Million) 75
11.2.6. U.S. 76
11.2.7. Canada 76
11.2.8. Mexico 76
11.3. Europe 77
11.3.1. Europe Fire Resistant Fabric Market Volume, By Country, 2017 – 2022 (Million Sq Mtr) 78
11.3.2. Europe Fire Resistant Fabric Market Revenue, By Country, 2017 – 2022 (USD Million) 79
11.3.3. Europe Fire Resistant Fabric Market Volume, By Type, 2017 – 2022 (Million Sq Mtr) 80
11.3.4. Europe Fire Resistant Fabric Market Revenue, By Type, 2017 – 2022 (USD Million) 81
11.3.5. Europe Fire Resistant Fabric Market Volume, By Application, 2017 – 2022 (Million Sq Mtr) 82
11.3.6. Europe Fire Resistant Fabric Market Revenue, By Application, 2017 – 2022 (USD Million) 83
11.3.7. UK 84
11.3.8. France 84
11.3.9. Germany 84
11.3.10. Italy 84
11.3.11. Spain 84
11.3.12. Russia 84
11.3.13. BENELUX 84
11.3.14. Sweden 84
11.3.15. Denmark 84
11.3.16. Poland 84
11.3.17. Austria 84
11.3.18. Rest of Europe 84
11.4. Asia Pacific 85
11.4.1. Asia Pacific Fire Resistant Fabric Market Volume, By Country, 2017 – 2022 (Million Sq Mtr) 86
11.4.2. Asia Pacific Fire Resistant Fabric Market Revenue, By Country, 2017 – 2022 (USD Million) 87
11.4.3. Asia Pacific Fire Resistant Fabric Market Volume, By Type, 2017 – 2022 (Million Sq Mtr) 88
11.4.4. Asia Pacific Fire Resistant Fabric Market Revenue, By Type, 2017 – 2022 (USD Million) 89
11.4.5. Asia Pacific Fire Resistant Fabric Market Volume, By Application, 2017 – 2022 (Million Sq Mtr) 90
11.4.6. Asia Pacific Fire Resistant Fabric Market Revenue, By Application, 2017 – 2022 (USD Million) 91
11.4.7. China 92
11.4.8. Japan 92
11.4.9. South Korea 92
11.4.10. India 92
11.4.11. Thailand 92
11.4.12. Indonesia 92
11.4.13. Vietnam 92
11.4.14. Malaysia 92
11.4.15. Philippines 92
11.4.16. Taiwan 92
11.4.17. Rest of Asia Pacific 92
11.5. Latin America 93
11.5.1. Latin America Fire Resistant Fabric Market Volume, By Country, 2017 – 2022 (Million Sq Mtr) 94
11.5.2. Latin America Fire Resistant Fabric Market Revenue, By Country, 2017 – 2022 (USD Million) 95
11.5.3. Latin America Fire Resistant Fabric Market Volume, By Type, 2017 – 2022 (Million Sq Mtr) 96
11.5.4. Latin America Fire Resistant Fabric Market Revenue, By Type, 2017 – 2022 (USD Million) 97
11.5.5. Latin America Fire Resistant Fabric Market Volume, By Application, 2017 – 2022 (Million Sq Mtr) 98
11.5.6. Latin America Fire Resistant Fabric Market Revenue, By Application, 2017 – 2022 (USD Million) 99
11.5.7. Brazil 100
11.5.8. Argentina 100
11.5.9. Colombia 100
11.5.10. Chile 100
11.5.11. Peru 100
11.5.12. Rest of Latin America 100
11.6. The Middle-East 101
11.6.1. Middle East Fire Resistant Fabric Market Volume, By Country, 2017 – 2022 (Million Sq Mtr) 102
11.6.2. Middle East Fire Resistant Fabric Market Revenue, By Country, 2017 – 2022 (USD Million) 103
11.6.3. Middle East Fire Resistant Fabric Market Volume, By Type, 2017 – 2022 (Million Sq Mtr) 104
11.6.4. Middle East Fire Resistant Fabric Market Revenue, By Type, 2017 – 2022 (USD Million) 105
11.6.5. Middle East Fire Resistant Fabric Market Volume, By Application, 2017 – 2022 (Million Sq Mtr) 106
11.6.6. Middle East Fire Resistant Fabric Market Revenue, By Application, 2017 – 2022 (USD Million) 107
11.6.7. GCC Countries 108
11.6.8. Israel 108
11.6.9. Turkey 108
11.6.10. Iran 108
11.6.11. Rest of Middle East & Africa 108
11.7. Africa 109
11.7.1. Africa Fire Resistant Fabric Market Volume, By Country, 2017 – 2022 (Million Sq Mtr) 110
11.7.2. Africa Fire Resistant Fabric Market Revenue, By Country, 2017 – 2022 (USD Million) 111
11.7.3. Africa Fire Resistant Fabric Market Volume, By Type, 2017 – 2022 (Million Sq Mtr) 112
11.7.4. Africa Fire Resistant Fabric Market Revenue, By Type, 2017 – 2022 (USD Million) 113
11.7.5. Africa Fire Resistant Fabric Market Volume, By Application, 2017 – 2022 (Million Sq Mtr) 114
11.7.6. Africa Fire Resistant Fabric Market Revenue, By Application, 2017 – 2022 (USD Million) 115
11.7.7. South Africa 116
11.7.8. Egypt 116
11.7.9. Nigeria 116
11.7.10. Algeria 116
11.7.11. Morocco 116
11.7.12. Rest of Africa 116

CHAPTER NO. 12 : COMPANY PROFILES 117
12.1. TenCate 117
12.1.1. Company Overview 117
12.1.2. Product Portfolio 117
12.1.3. Financial Overview 117
12.2. Milliken & Company 118
12.3. Mount Vernon Mills, Inc. 118
12.4. Mount Vernon Mills, Inc. 118
12.5. Carrington Workwear Ltd 118
12.6. Klopman International S.R.L. 118
12.7. WL Gore & Associates Inc. 118
12.8. Marina Textil S.L. 118
12.9. DuPont 118
12.10. Lenzing AG 118
12.11. Solvay S.A. 118
12.12. Teijin Aramid 118
12.13. Kaneka Corporation 118
12.14. Huntsman Corporation 118

CHAPTER NO. 13 : RESEARCH METHODOLOGY 119
13.1. Research Methodology 119
13.2. Phase I – Secondary Research 120
13.3. Phase II – Data Modeling 120
13.3.1. Company Share Analysis Model 121
13.3.2. Revenue Based Modeling 121
13.4. Phase III – Primary Research 122
13.5. Research Limitations 123
13.5.1. Assumptions 123

List of Figures
FIG NO. 1. Global Fire Resistant Fabric Market Volume & Revenue, 2017 – 2030 (Million Sq Mtr) (USD Million) 22
FIG NO. 2. Porter’s Five Forces Analysis for Global Fire Resistant Fabric Market 27
FIG NO. 3. Value Chain Analysis for Global Fire Resistant Fabric Market 28
FIG NO. 4. Market Attractiveness Analysis, By Type 29
FIG NO. 5. Market Attractiveness Analysis, By Application 29
FIG NO. 6. Product Life Cycle Analysis 30
FIG NO. 7. Incremental Revenue Growth Opportunity by Type 31
FIG NO. 8. Incremental Revenue Growth Opportunity by Application 31
FIG NO. 9. Company Share Analysis, 2020 34
FIG NO. 10. Company Share Analysis, 2022 34
FIG NO. 11. Fire Resistant Fabric Market – Company Volume Market Share, 2022 35
FIG NO. 12. Fire Resistant Fabric Market – Company Revenue Market Share, 2022 36
FIG NO. 13. Market Position of Key Players, 2022 37
FIG NO. 14. Global Fire Resistant Fabric Market Volume Share, By Type, 2022 & 2030 40
FIG NO. 15. Global Fire Resistant Fabric Market Revenue Share, By Type, 2022 & 2030 40
FIG NO. 16. Global Fire Resistant Fabric Market for Inherent Fire Resistant Fabric, Volume & Revenue (Million Sq Mtr) (USD Million) 2017 – 2030 41
FIG NO. 17. Global Fire Resistant Fabric Market for Treated Fire Resistant Fabric, Volume & Revenue (Million Sq Mtr) (USD Million) 2017 – 2030 43
FIG NO. 18. Global Fire Resistant Fabric Market for Type 3, Volume & Revenue (Million Sq Mtr) (USD Million) 2017 – 2030 45
FIG NO. 19. Global Fire Resistant Fabric Market for Type 4, Volume & Revenue (Million Sq Mtr) (USD Million) 2017 – 2030 47
FIG NO. 20. Global Fire Resistant Fabric Market for Type 5, Volume & Revenue (Million Sq Mtr) (USD Million) 2017 – 2030 49
FIG NO. 21. Global Fire Resistant Fabric Market Volume Share, By Application, 2022 & 2030 52
FIG NO. 22. Global Fire Resistant Fabric Market Revenue Share, By Application, 2022 & 2030 52
FIG NO. 23. Global Fire Resistant Fabric Market for Industrial Protective Clothing, Volume & Revenue (Million Sq Mtr) (USD Million) 2017 – 2030 53
FIG NO. 24. Global Fire Resistant Fabric Market for Law Enforcement and Firefighting Services, Volume & Revenue (Million Sq Mtr) (USD Million) 2017 – 2030 55
FIG NO. 25. Global Fire Resistant Fabric Market for Transport, Volume & Revenue (Million Sq Mtr) (USD Million) 2017 – 2030 57
FIG NO. 26. Global Fire Resistant Fabric Market for Others, Volume & Revenue (Million Sq Mtr) (USD Million) 2017 – 2030 59
FIG NO. 27. Global Fire Resistant Fabric Market for Application 5, Volume & Revenue (Million Sq Mtr) (USD Million) 2017 – 2030 61
FIG NO. 28. Global Fire Resistant Fabric Market Volume Share, By Region, 2022 & 2030 64
FIG NO. 29. Global Fire Resistant Fabric Market Revenue Share, By Region, 2022 & 2030 64
FIG NO. 30. North America Fire Resistant Fabric Market Volume & Revenue, 2017 – 2022 (Million Sq Mtr) (USD Million) 71
FIG NO. 31. Europe Fire Resistant Fabric Market Volume & Revenue, 2017 – 2022 (Million Sq Mtr) (USD Million) 78
FIG NO. 32. Asia Pacific Fire Resistant Fabric Market Volume & Revenue, 2017 – 2022 (Million Sq Mtr) (USD Million) 86
FIG NO. 33. Latin America Fire Resistant Fabric Market Volume & Revenue, 2017 – 2022 (Million Sq Mtr) (USD Million) 94
FIG NO. 34. The Middle-East Fire Resistant Fabric Market Volume & Revenue, 2017 – 2022 (Million Sq Mtr) (USD Million) 102
FIG NO. 35. Africa Fire Resistant Fabric Market Volume & Revenue, 2017 – 2022 (Million Sq Mtr) (USD Million) 110
FIG NO. 36. Research Methodology – Detailed View 120
FIG NO. 37. Research Methodology 121

List of Tables
TABLE NO. 1. : Global Fire Resistant Fabric Market: Snapshot 20
TABLE NO. 2. : Drivers for the Fire Resistant Fabric Market: Impact Analysis 25
TABLE NO. 3. : Restraints for the Fire Resistant Fabric Market: Impact Analysis 26
TABLE NO. 4. : Global Fire Resistant Fabric Market Import Volume, By End-user, 2017 – 2022 (Million Sq Mtr) 32
TABLE NO. 5. : Global Fire Resistant Fabric Market Export Volume, By End-user, 2017 – 2022 (Million Sq Mtr) 32
TABLE NO. 6. : Global Fire Resistant Fabric Market Demand Volume, By End-user, 2017 – 2022 (Million Sq Mtr) 33
TABLE NO. 7. : Global Fire Resistant Fabric Market Supply Volume, By End-user, 2017 – 2022 (Million Sq Mtr) 33
TABLE NO. 8. : Global Inherent Fire Resistant Fabric Fire Resistant Fabric Market Volume, By Region, 2017 – 2022 (Million Sq Mtr) 41
TABLE NO. 9. : Global Inherent Fire Resistant Fabric Fire Resistant Fabric Market Volume, By Region, 2023– 2030 (Million Sq Mtr) 41
TABLE NO. 10. : Global Inherent Fire Resistant Fabric Fire Resistant Fabric Market Revenue, By Region, 2017 – 2022 (USD Million) 42
TABLE NO. 11. : Global Inherent Fire Resistant Fabric Fire Resistant Fabric Market Revenue, By Region, 2023– 2030 (USD Million) 42
TABLE NO. 12. : Global Treated Fire Resistant Fabric Fire Resistant Fabric Market Volume, By Region, 2017 – 2022 (Million Sq Mtr) 43
TABLE NO. 13. : Global Treated Fire Resistant Fabric Fire Resistant Fabric Market Volume, By Region, 2023– 2030 (Million Sq Mtr) 43
TABLE NO. 14. : Global Inherent Fire Resistant Fabric Fire Resistant Fabric Market Revenue, By Region, 2017 – 2022 (USD Million) 44
TABLE NO. 15. : Global Inherent Fire Resistant Fabric Fire Resistant Fabric Market Revenue, By Region, 2023– 2030 (USD Million) 44
TABLE NO. 16. : Global Type 3 Fire Resistant Fabric Market Volume, By Region, 2017 – 2022 (Million Sq Mtr) 45
TABLE NO. 17. : Global Type 3 Fire Resistant Fabric Market Volume, By Region, 2023– 2030 (Million Sq Mtr) 45
TABLE NO. 18. : Global Type 3 Fire Resistant Fabric Market Revenue, By Region, 2017 – 2022 (USD Million) 46
TABLE NO. 19. : Global Type 3 Fire Resistant Fabric Market Revenue, By Region, 2023– 2030 (USD Million) 46
TABLE NO. 20. : Global Type 4 Fire Resistant Fabric Market Revenue, By Region, 2017 – 2022 (USD Million) 47
TABLE NO. 21. : Global Type 4 Fire Resistant Fabric Market Volume, By Region, 2023– 2030 (Million Sq Mtr) 47
TABLE NO. 22. : Global Type 4 Fire Resistant Fabric Market Revenue, By Region, 2017 – 2022 (USD Million) 48
TABLE NO. 23. : Global Type 4 Fire Resistant Fabric Market Revenue, By Region, 2023– 2030 (USD Million) 48
TABLE NO. 24. : Global Type 5 Fire Resistant Fabric Market Volume, By Region, 2017 – 2022 (Million Sq Mtr) 49
TABLE NO. 25. : Global Type 5 Fire Resistant Fabric Market Volume, By Region, 2023– 2030 (Million Sq Mtr) 49
TABLE NO. 26. : Global Type 5 Fire Resistant Fabric Market Revenue, By Region, 2017 – 2022 (USD Million) 50
TABLE NO. 27. : Global Type 5 Fire Resistant Fabric Market Revenue, By Region, 2023– 2030 (USD Million) 50
TABLE NO. 28. : Global Fire Resistant Fabric for Industrial Protective Clothing Market Volume, By Region, 2017 – 2022 (Million Sq Mtr) 53
TABLE NO. 29. : Global Fire Resistant Fabric for Industrial Protective Clothing Market Volume, By Region, 2023– 2030 (Million Sq Mtr) 53
TABLE NO. 30. : Global Fire Resistant Fabric for Industrial Protective Clothing Market Revenue, By Region, 2017 – 2022 (USD Million) 54
TABLE NO. 31. : Global Fire Resistant Fabric for Industrial Protective Clothing Market Revenue, By Region, 2023– 2030 (USD Million) 54
TABLE NO. 32. : Global Fire Resistant Fabric for Law Enforcement and Firefighting Services Market Volume, By Region, 2017 – 2022 (Million Sq Mtr) 55
TABLE NO. 33. : Global Fire Resistant Fabric for Law Enforcement and Firefighting Services Market Volume, By Region, 2023– 2030 (Million Sq Mtr) 55
TABLE NO. 34. : Global Fire Resistant Fabric for Law Enforcement and Firefighting Services Market Revenue, By Region, 2017 – 2022 (USD Million) 56
TABLE NO. 35. : Global Fire Resistant Fabric for Law Enforcement and Firefighting Services Market Revenue, By Region, 2023– 2030 (USD Million) 56
TABLE NO. 36. : Global Fire Resistant Fabric for Transport Market Volume, By Region, 2017 – 2022 (Million Sq Mtr) 57
TABLE NO. 37. : Global Fire Resistant Fabric for Transport Market Volume, By Region, 2023– 2030 (Million Sq Mtr) 57
TABLE NO. 38. : Global Fire Resistant Fabric for Transport Market Revenue, By Region, 2017 – 2022 (USD Million) 58
TABLE NO. 39. : Global Fire Resistant Fabric for Transport Market Revenue, By Region, 2023– 2030 (USD Million) 58
TABLE NO. 40. : Global Fire Resistant Fabric for Others Market Volume, By Region, 2017 – 2022 (Million Sq Mtr) 59
TABLE NO. 41. : Global Fire Resistant Fabric for Others Market Volume, By Region, 2023– 2030 (Million Sq Mtr) 59
TABLE NO. 42. : Global Fire Resistant Fabric for Others Market Revenue, By Region, 2017 – 2022 (USD Million) 60
TABLE NO. 43. : Global Fire Resistant Fabric for Others Market Revenue, By Region, 2023– 2030 (USD Million) 60
TABLE NO. 44. : Global Fire Resistant Fabric for Application 5 Market Volume, By Region, 2017 – 2022 (Million Sq Mtr) 61
TABLE NO. 45. : Global Fire Resistant Fabric for Application 5 Market Volume, By Region, 2023– 2030 (Million Sq Mtr) 61
TABLE NO. 46. : Global Fire Resistant Fabric for Application 5 Market Revenue, By Region, 2017 – 2022 (USD Million) 62
TABLE NO. 47. : Global Fire Resistant Fabric for Application 5 Market Revenue, By Region, 2023– 2030 (USD Million) 62
TABLE NO. 48. : Global Fire Resistant Fabric Market Volume, By Region, 2017 – 2022 (Million Sq Mtr) 65
TABLE NO. 49. : Global Fire Resistant Fabric Market Volume, By Region, 2023– 2030 (Million Sq Mtr) 65
TABLE NO. 50. : Global Fire Resistant Fabric Market Revenue, By Region, 2017 – 2022 (USD Million) 66
TABLE NO. 51. : Global Fire Resistant Fabric Market Revenue, By Region, 2023– 2030 (USD Million) 66
TABLE NO. 52. : Global Fire Resistant Fabric Market Volume, By Type, 2017 – 2022 (Million Sq Mtr) 67
TABLE NO. 53. : Global Fire Resistant Fabric Market Volume, By Type, 2023– 2030 (Million Sq Mtr) 67
TABLE NO. 54. : Global Fire Resistant Fabric Market Revenue, By Type, 2017 – 2022 (USD Million) 68
TABLE NO. 55. : Global Fire Resistant Fabric Market Revenue, By Type, 2023– 2030 (USD Million) 68
TABLE NO. 56. : Global Fire Resistant Fabric Market Volume, By Application, 2017 – 2022 (Million Sq Mtr) 69
TABLE NO. 57. : Global Fire Resistant Fabric Market Volume, By Application, 2023– 2030 (Million Sq Mtr) 69
TABLE NO. 58. : Global Fire Resistant Fabric Market Revenue, By Application, 2017 – 2022 (USD Million) 70
TABLE NO. 59. : Global Fire Resistant Fabric Market Revenue, By Application, 2023– 2030 (USD Million) 70
TABLE NO. 60. : North America Fire Resistant Fabric Market Volume, By Country, 2017 – 2022 (Million Sq Mtr) 72
TABLE NO. 61. : North America Fire Resistant Fabric Market Volume, By Country, 2023– 2030 (Million Sq Mtr) 72
TABLE NO. 62. : North America Fire Resistant Fabric Market Revenue, By Country, 2017 – 2022 (USD Million) 72
TABLE NO. 63. : North America Fire Resistant Fabric Market Revenue, By Country, 2023– 2030 (USD Million) 72
TABLE NO. 64. : North America Fire Resistant Fabric Market Volume, By Type, 2017 – 2022 (Million Sq Mtr) 73
TABLE NO. 65. : North America Fire Resistant Fabric Market Volume, By Type, 2023– 2030 (Million Sq Mtr) 73
TABLE NO. 66. : North America Fire Resistant Fabric Market Revenue, By Type, 2017 – 2022 (USD Million) 74
TABLE NO. 67. : North America Fire Resistant Fabric Market Revenue, By Type, 2023– 2030 (USD Million) 74
TABLE NO. 68. : North America Fire Resistant Fabric Market Volume, By Application, 2017 – 2022 (Million Sq Mtr) 75
TABLE NO. 69. : North America Fire Resistant Fabric Market Volume, By Application, 2023– 2030 (Million Sq Mtr) 75
TABLE NO. 70. : North America Fire Resistant Fabric Market Revenue, By Application, 2017 – 2022 (USD Million) 76
TABLE NO. 71. : North America Fire Resistant Fabric Market Revenue, By Application, 2023– 2030 (USD Million) 76
TABLE NO. 72. : Europe Fire Resistant Fabric Market Volume, By Country, 2017 – 2022 (Million Sq Mtr) 79
TABLE NO. 73. : Europe Fire Resistant Fabric Market Volume, By Country, 2023– 2030 (Million Sq Mtr) 79
TABLE NO. 74. : Europe Fire Resistant Fabric Market Revenue, By Country, 2017 – 2022 (USD Million) 80
TABLE NO. 75. : Europe Fire Resistant Fabric Market Revenue, By Country, 2023– 2030 (USD Million) 80
TABLE NO. 76. : Europe Fire Resistant Fabric Market Volume, By Type, 2017 – 2022 (Million Sq Mtr) 81
TABLE NO. 77. : Europe Fire Resistant Fabric Market Volume, By Type, 2023– 2030 (Million Sq Mtr) 81
TABLE NO. 78. : Europe Fire Resistant Fabric Market Revenue, By Type, 2017 – 2022 (USD Million) 82
TABLE NO. 79. : Europe Fire Resistant Fabric Market Revenue, By Type, 2023– 2030 (USD Million) 82
TABLE NO. 80. : Europe Fire Resistant Fabric Market Volume, By Application, 2017 – 2022 (Million Sq Mtr) 83
TABLE NO. 81. : Europe Fire Resistant Fabric Market Volume, By Application, 2023– 2030 (Million Sq Mtr) 83
TABLE NO. 82. : Europe Fire Resistant Fabric Market Revenue, By Application, 2017 – 2022 (USD Million) 84
TABLE NO. 83. : Europe Fire Resistant Fabric Market Revenue, By Application, 2023– 2030 (USD Million) 84
TABLE NO. 84. : Asia Pacific Fire Resistant Fabric Market Volume, By Country, 2017 – 2022 (Million Sq Mtr) 87
TABLE NO. 85. : Asia Pacific Fire Resistant Fabric Market Volume, By Country, 2023– 2030 (Million Sq Mtr) 87
TABLE NO. 86. : Asia Pacific Fire Resistant Fabric Market Revenue, By Country, 2017 – 2022 (USD Million) 88
TABLE NO. 87. : Asia Pacific Fire Resistant Fabric Market Revenue, By Country, 2023– 2030 (USD Million) 88
TABLE NO. 88. : Asia Pacific Fire Resistant Fabric Market Volume, By Type, 2017 – 2022 (Million Sq Mtr) 89
TABLE NO. 89. : Asia Pacific Fire Resistant Fabric Market Volume, By Type, 2023– 2030 (Million Sq Mtr) 89
TABLE NO. 90. : Asia Pacific Fire Resistant Fabric Market Revenue, By Type, 2017 – 2022 (USD Million) 90
TABLE NO. 91. : Asia Pacific Fire Resistant Fabric Market Revenue, By Type, 2023– 2030 (USD Million) 90
TABLE NO. 92. : Asia Pacific Fire Resistant Fabric Market Volume, By Application, 2017 – 2022 (Million Sq Mtr) 91
TABLE NO. 93. : Asia Pacific Fire Resistant Fabric Market Volume, By Application, 2023– 2030 (Million Sq Mtr) 91
TABLE NO. 94. : Asia Pacific Fire Resistant Fabric Market Revenue, By Application, 2017 – 2022 (USD Million) 92
TABLE NO. 95. : Asia Pacific Fire Resistant Fabric Market Revenue, By Application, 2023– 2030 (USD Million) 92
TABLE NO. 96. : Latin America Fire Resistant Fabric Market Volume, By Country, 2017 – 2022 (Million Sq Mtr) 95
TABLE NO. 97. : Latin America Fire Resistant Fabric Market Volume, By Country, 2023– 2030 (Million Sq Mtr) 95
TABLE NO. 98. : Latin America Fire Resistant Fabric Market Revenue, By Country, 2017 – 2022 (USD Million) 96
TABLE NO. 99. : Latin America Fire Resistant Fabric Market Revenue, By Country, 2023– 2030 (USD Million) 96
TABLE NO. 100. : Latin America Fire Resistant Fabric Market Volume, By Type, 2017 – 2022 (Million Sq Mtr) 97
TABLE NO. 101. : Latin America Fire Resistant Fabric Market Volume, By Type, 2023– 2030 (Million Sq Mtr) 97
TABLE NO. 102. : Latin America Fire Resistant Fabric Market Revenue, By Type, 2017 – 2022 (USD Million) 98
TABLE NO. 103. : Latin America Fire Resistant Fabric Market Revenue, By Type, 2023– 2030 (USD Million) 98
TABLE NO. 104. : Latin America Fire Resistant Fabric Market Volume, By Application, 2017 – 2022 (Million Sq Mtr) 99
TABLE NO. 105. : Latin America Fire Resistant Fabric Market Volume, By Application, 2023– 2030 (Million Sq Mtr) 99
TABLE NO. 106. : Latin America Fire Resistant Fabric Market Revenue, By Application, 2017 – 2022 (USD Million) 100
TABLE NO. 107. : Latin America Fire Resistant Fabric Market Revenue, By Application, 2023– 2030 (USD Million) 100
TABLE NO. 108. : Middle East Fire Resistant Fabric Market Volume, By Country, 2017 – 2022 (Million Sq Mtr) 103
TABLE NO. 109. : Middle East Fire Resistant Fabric Market Volume, By Country, 2023– 2030 (Million Sq Mtr) 103
TABLE NO. 110. : Middle East Fire Resistant Fabric Market Revenue, By Country, 2017 – 2022 (USD Million) 104
TABLE NO. 111. : Middle East Fire Resistant Fabric Market Revenue, By Country, 2023– 2030 (USD Million) 104
TABLE NO. 112. : Middle East Fire Resistant Fabric Market Volume, By Type, 2017 – 2022 (Million Sq Mtr) 105
TABLE NO. 113. : Middle East Fire Resistant Fabric Market Volume, By Type, 2023– 2030 (Million Sq Mtr) 105
TABLE NO. 114. : Middle East Fire Resistant Fabric Market Revenue, By Type, 2017 – 2022 (USD Million) 106
TABLE NO. 115. : Middle East Fire Resistant Fabric Market Revenue, By Type, 2023– 2030 (USD Million) 106
TABLE NO. 116. : Middle East Fire Resistant Fabric Market Volume, By Application, 2017 – 2022 (Million Sq Mtr) 107
TABLE NO. 117. : Middle East Fire Resistant Fabric Market Volume, By Application, 2023– 2030 (Million Sq Mtr) 107
TABLE NO. 118. : Middle East Fire Resistant Fabric Market Revenue, By Application, 2017 – 2022 (USD Million) 108
TABLE NO. 119. : Middle East Fire Resistant Fabric Market Revenue, By Application, 2023– 2030 (USD Million) 108
TABLE NO. 120. : Africa Fire Resistant Fabric Market Volume, By Country, 2017 – 2022 (Million Sq Mtr) 111
TABLE NO. 121. : Africa Fire Resistant Fabric Market Volume, By Country, 2023– 2030 (Million Sq Mtr) 111
TABLE NO. 122. : Africa Fire Resistant Fabric Market Revenue, By Country, 2017 – 2022 (USD Million) 112
TABLE NO. 123. : Africa Fire Resistant Fabric Market Revenue, By Country, 2023– 2030 (USD Million) 112
TABLE NO. 124. : Africa Fire Resistant Fabric Market Volume, By Type, 2017 – 2022 (Million Sq Mtr) 113
TABLE NO. 125. : Africa Fire Resistant Fabric Market Volume, By Type, 2023– 2030 (Million Sq Mtr) 113
TABLE NO. 126. : Africa Fire Resistant Fabric Market Revenue, By Type, 2017 – 2022 (USD Million) 114
TABLE NO. 127. : Africa Fire Resistant Fabric Market Revenue, By Type, 2023– 2030 (USD Million) 114
TABLE NO. 128. : Africa Fire Resistant Fabric Market Volume, By Application, 2017 – 2022 (Million Sq Mtr) 115
TABLE NO. 129. : Africa Fire Resistant Fabric Market Volume, By Application, 2023– 2030 (Million Sq Mtr) 115
TABLE NO. 130. : Africa Fire Resistant Fabric Market Revenue, By Application, 2017 – 2022 (USD Million) 116
TABLE NO. 131. : Africa Fire Resistant Fabric Market Revenue, By Application, 2023– 2030 (USD Million) 116

Frequently Asked Question

What is the fire-resistant fabric marketplace?

The fire-resistant fabric marketplace refers to the global enterprise producing, distributing, and promoting textiles and fabrics designed to withstand fire and offer safety from heat and flames.

Why is fire-resistant fabric vital?

Fire-resistant fabric is critical in numerous industries wherein employees are exposed to fire hazards. It gives a layer of safety, lowering the danger of burns and accidents. Fire-resistant fabric is used in sectors including firefighting, oil and gas, manufacturing, production, and navy.

How is a fire-resistant fabric made?

Fire-resistant fabrics are usually made by treating everyday fabric with chemical finishes or coatings that enhance their fire-resistant properties. Common treatments include using flame-retardant chemicals, incorporating aramid fibers (including Nomex or Kevlar), or using inherently flame-resistant fibers like modacrylic or meta-aramid fibers.

What are the key factors driving the fire-resistant fabric marketplace?

The growth of the fire-resistant fabric marketplace is commonly pushed by way of growing safety regulations and requirements across industries, growing awareness about worker safety, growing instances of fire injuries, and the want for protective garb in dangerous environments.

What are the different varieties of fire-resistant fabrics available?

There are several sorts of fire-resistant fabric available, along with handled cotton, flame-retardant polyester, aramid fibers, modacrylic, and blends of diverse flame-resistant substances. Each kind has specific benefits and applications, depending on the extent of safety required.

Which industries are the major consumers of fire-resistant fabric?

Major industries that utilize fire-resistant fabrics encompass oil and fuel, manufacturing, construction, electric utilities, firefighting, army and defense, and automotive. These industries regularly require defensive apparel from fire-resistant fabric, including coveralls, gloves, jackets, and trousers.

Is fire-resistant fabric comfortable to wear?

Yes, advancements in fabric technology have made fire-resistant fabric greater comfortable to wear. Manufacturers are conscious of developing light-weight, breathable fabric that provides flexibility and moisture-wicking properties. This helps ensure comfort while preserving the required level of fire resistance.

How are fire-resistant fabrics examined for their performance?

Fire-resistant fabrics undergo numerous tests to evaluate their performance, including flame resistance, heat resistance, thermal safety, and durability. Common testing methods encompass the ASTM D6413, NFPA 2112, and EN ISO 11612 requirements. These tests compare fabric reaction to heat, flame unfold, and the ability to self-extinguish.

What are the local developments inside the fire-resistant fabric marketplace?

The fire-resistant fabric market exhibits regional variations based on industry demand for safety policies and financial elements. Due to stringent safety requirements, areas including North America, Europe, and Asia Pacific are key markets. Meanwhile, emerging economies in Asia, inclusive of China and India, are witnessing big growth in adopting fire-resistant fabric.

What are the leading companies in the fire-resistant fabric marketplace?

Several outstanding businesses operate within the fire-resistant fabric marketplace, including Milliken & Company, TenCate Fabrics, Teijin Aramid, Solvay S.A., DuPont, and Westex using Milliken. These businesses are aware of product innovation, research and improvement, and collaborations to satisfy the evolving safety necessities of various industries.

Simulation Software Market

Published:
Report ID: 36908

Bioinformatics Market

Published:
Report ID: 14530

Fish Hook Sensor Market

Published:
Report ID: 36774

Big Data Services Market

Published:
Report ID: 3020

Saudi Arabia Managed Security Services Market

Published:
Report ID: 36393

Microwave Oven Market

Published:
Report ID: 36314

Inkjet Coders Market

Published:
Report ID: 6669

Rich Communication Services Market

Published:
Report ID: 35774

Middle East and Africa Real-Time Payments Market

Published:
Report ID: 35770

Vietnam Managed Security Services (MSS) Market

Published:
Report ID: 35766

Middle East and Africa EdTech and Smart Classroom Market

Published:
Report ID: 35756

Digital Business Support System (DBSS) Market

Published:
Report ID: 35732

Purchase Options

$2999
Delivery Format: Excel.
$4999
Designed for the individual purchaser.
$6999
Users located at a single corporate site or regional office.
$7999
Allowed for unlimited sharing globally within one company.
Smallform of Sample request

Have a question?

User Profile

Don’t settle for less – trust Mitul to help you find the best solution.

Report delivery within 24 to 48 hours

– Other Info –

What people say?-

User Review

I am very impressed with the information in this report. The author clearly did their research when they came up with this product and it has already given me a lot of ideas.

Jana Schmidt
CEDAR CX Technologies

– Connect with us –

Phone

+91 6232 49 3207


support

24/7 Research Support


sales@credenceresearch.com

– Research Methodology –

Going beyond the basics: advanced techniques in research methodology

– Trusted By –

Pepshi, LG, Nestle
Motorola, Honeywell, Johnson and johnson
LG Chem, SIEMENS, Pfizer
Unilever, Samsonite, QIAGEN