
Dubai-led dining faces a war dip before recovery
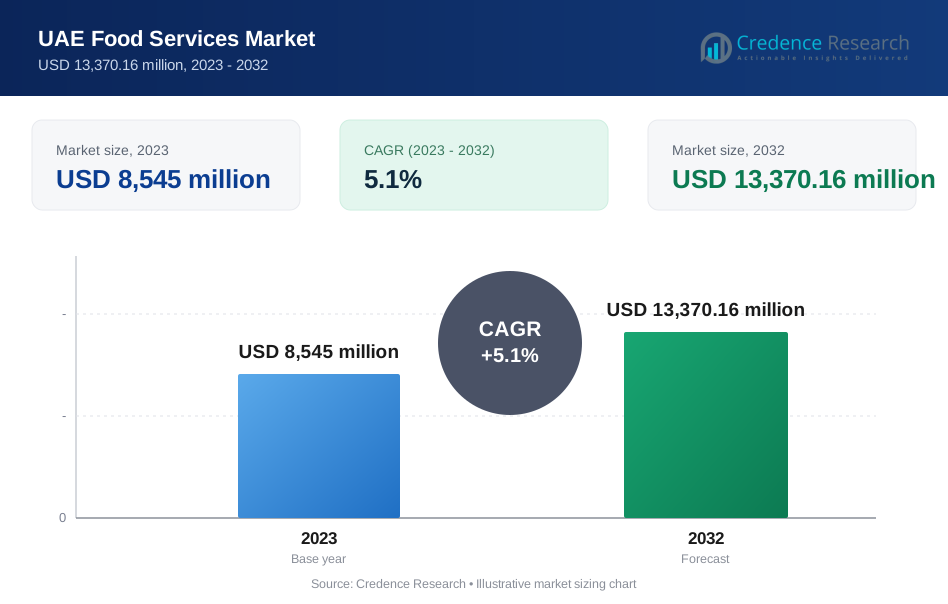
The UAE food services market was valued at USD 9.44 billion in 2025 and is projected to increase from USD 8.90 billion in 2026 to USD 13.93 billion by 2035, registering a CAGR of 5.10% during 2026–2035. Demand rests on a resident base that is almost 89% foreign nationals and on visitors, with Dubai alone receiving 19.59 million international overnight guests in 2025. Dubai held the largest share, 50.0% in 2025, while the Northern Emirates are the fastest-growing zone at 5.7% a year. The 2026 value sits below 2025 because the Iran war halted flights from Feb. 28, 2026, and dine-in orders in the Syrve restaurant sample fell by a third between January and March. Delivery absorbed part of that loss, rising to 29% of orders in the first quarter of 2026 from 25% a year earlier. Growth after 2026 depends on tourism returning, and Dubai hotel occupancy had recovered to 66% by August 2026.
How many restaurants does the UAE have and what does this market count?
The market counts consumer spending on prepared meals and drinks at full service restaurants, quick service restaurants, cafes and bars, and cloud kitchens across the seven emirates. The USDA Foreign Agricultural Service counted 17,361 outlets nationally in its December 2025 report, serving more than 200 nationalities. That report also carries Dubai Municipality figures of 8,617 restaurants and 5,240 coffee shops and cafeterias in Dubai. These come from separate counts, so they should not be added together or read as a national share.
The estimate excludes grocery retail, packaged food bought for home preparation and institutional meal contracts. The value chain starts with importers, because Reuters reported in May 2026 that the UAE imports more than 80% of its food. Distributors then supply operators, and delivery platforms such as Talabat, Noon, Careem and Keeta connect many of those outlets with customers.
UAE Food Services Market Insights
- The market stood at USD 9.44 billion in 2025, dips to USD 8.90 billion in 2026 on the Iran war and reaches USD 13.93 billion by 2035 at a 5.10% CAGR.
- Dubai held 50.0% of 2025 value, supported by 19.59 million international overnight visitors and 154,264 hotel rooms in that year.
- Full Service Restaurants led with 46.0% of 2025 value, while Cloud Kitchens grow fastest at 7.9% a year through 2035.
- Delivery reached 29% of orders in Syrve data for the first quarter of 2026, up from 25%, as dine-in orders fell during the war.
- Talabat UAE opened 100 rent-free cloud kitchen spaces to homegrown brands in March 2026, lowering the entry cost for delivery-led growth.
Full service dining leads as cloud kitchens gain fastest
Why full service restaurants lead and cloud kitchens grow fastest
Based on type, the market is categorized into full service restaurants, quick service restaurants, cafes and bars, and cloud kitchens. Full Service Restaurants led with 46.0% of 2025 value because table service carries the highest ticket, and Syrve data put average dine-in spend at AED 125.5 against AED 79.37 for a delivery order in the first quarter of 2026. Dubai Municipality also lists 8,617 restaurants in the emirate of Dubai alone. Cloud Kitchens grow fastest at 7.9% a year as Talabat UAE offered 100 rent-free kitchen spaces in March 2026, drawing hundreds of applications according to The National.
Independent outlets hold most sales while chains add stores
Based on outlet, the market is categorized into chained outlets and independent outlets. Independent Outlets led with 66.0% of 2025 value because the USDA Foreign Agricultural Service reported in December 2025 that independent operators hold the larger part of consumer sales across a market serving more than 200 nationalities. Chained Outlets grow faster at 5.7% a year as groups with scale keep opening. Americana Restaurants, the KFC and Pizza Hut operator, ran 2,746 restaurants across its markets on June 30, 2026, and expected 120 to 130 further openings by year-end, according to AGBI.
Standalone sites lead as airports lift travel locations
Based on location, the market is categorized into leisure, lodging, retail, standalone and travel sites. Standalone led with 44.0% of 2025 value because street and community sites serve daily resident demand, and a survey of 30 industry leaders reported by Reuters in May 2026 found residential venues more resilient than tourist districts. Travel sites grow fastest at 5.8% a year as passenger volumes build, with Dubai International handling a record 95.2 million passengers in 2025 and Abu Dhabi Airports more than 33 million, according to The National and Abu Dhabi Airports.
| Segment Group | Leading Sub-segment | Share, 2025 | Fastest-growing Sub-segment | CAGR, 2026–2035 |
|---|---|---|---|---|
| By Type | Full Service Restaurants | 46.0% | Cloud Kitchens | 7.9% |
| By Outlet | Independent Outlets | 66.0% | Chained Outlets | 5.7% |
| By Location | Standalone | 44.0% | Travel | 5.8% |
Request a Free Sample
Fill in your details and we'll send you a free sample report.
- Sample data tables & charts
- Research methodology
Visitors, residents and delivery apps carry UAE dining
Record 2025 visitor numbers set the base operators want back
Visitor spending is the largest swing factor in UAE dining, and 2025 set the level operators now want to regain. Dubai Department of Economy and Tourism data show 19.59 million international overnight visitors in 2025, up 5% on 2024, with 827 hotels offering 154,264 rooms at 80.7% average occupancy. The Department of Culture and Tourism in Abu Dhabi reported 5.9 million hotel guests at 81% occupancy for the same year. Ras Al Khaimah added a record 1.35 million overnight visitors, according to its tourism authority. Hotel restaurants, malls and beach venues depend on these arrivals, so their trade moves closely with visitor numbers. As a result, the largest share of 2025 value sits in the emirate with the deepest visitor base.
Resident population growth widens everyday restaurant demand
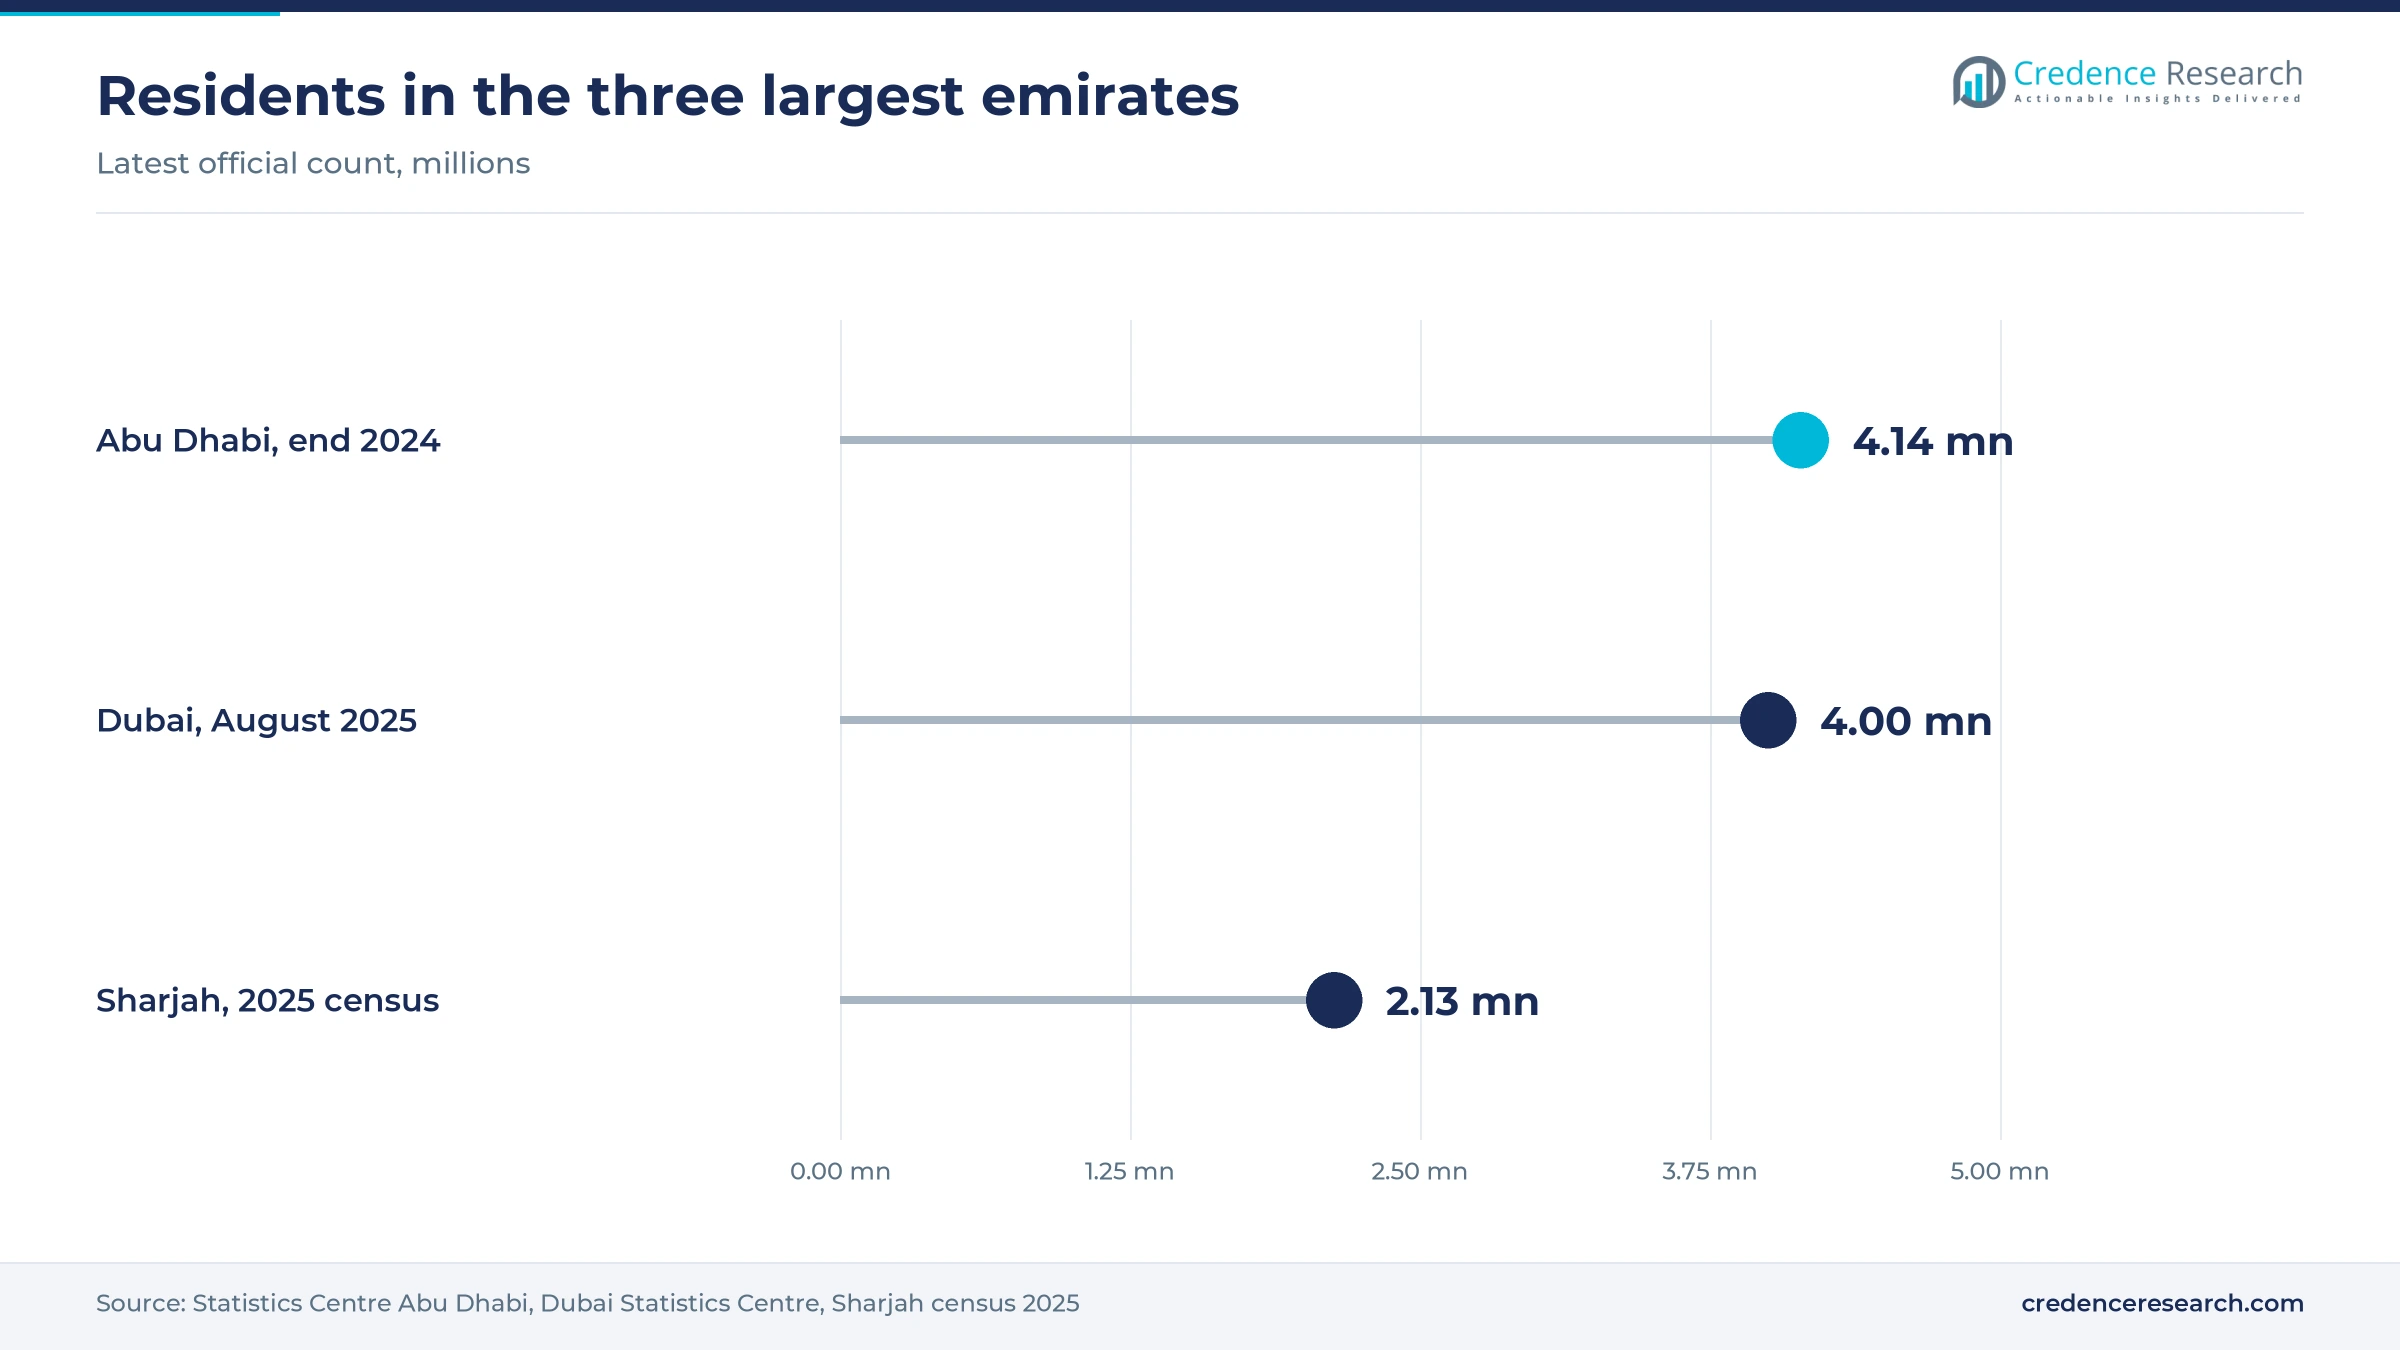
Resident growth gives operators a steadier customer than the visitor market can offer. The Statistics Centre in Abu Dhabi counted 4,135,985 residents at the end of 2024, a 7.5% increase in one year. The Dubai Statistics Centre population clock passed four million in August 2025, and the 2025 Sharjah census found 2.13 million people, up 51% in 10 years. Non-citizens make up nearly nine in 10 Sharjah residents, which matches the wider national pattern and explains the demand for many cuisines. This base proved its value in 2026, when operators told Reuters that residential sites held up better than business districts during the war. In turn, this resident base gives operators demand that does not depend on airline schedules or hotel bookings in the same way.
Delivery apps keep kitchens busy when dining rooms empty
Delivery now protects restaurant volume when dining rooms empty, which makes ordering apps central to operator planning. AGBI reported in May 2026 that delivery orders in the Syrve sample of 6.4 million UAE orders grew 18% to 1.9 million in the first quarter, reaching 29% of the total. Tashas Group said delivery orders at its community restaurants rose 15% as revenue at those sites fell by as much as 20%. Scale is already large, because Talabat reported more than 47 million burgers ordered across the UAE in 2025. Average delivery order value stayed nearly flat at AED 79.37 against AED 79.55, according to EnterpriseAM. Consequently, volume rather than ticket size drives this channel today.
New licenses and global concepts refresh the dining supply
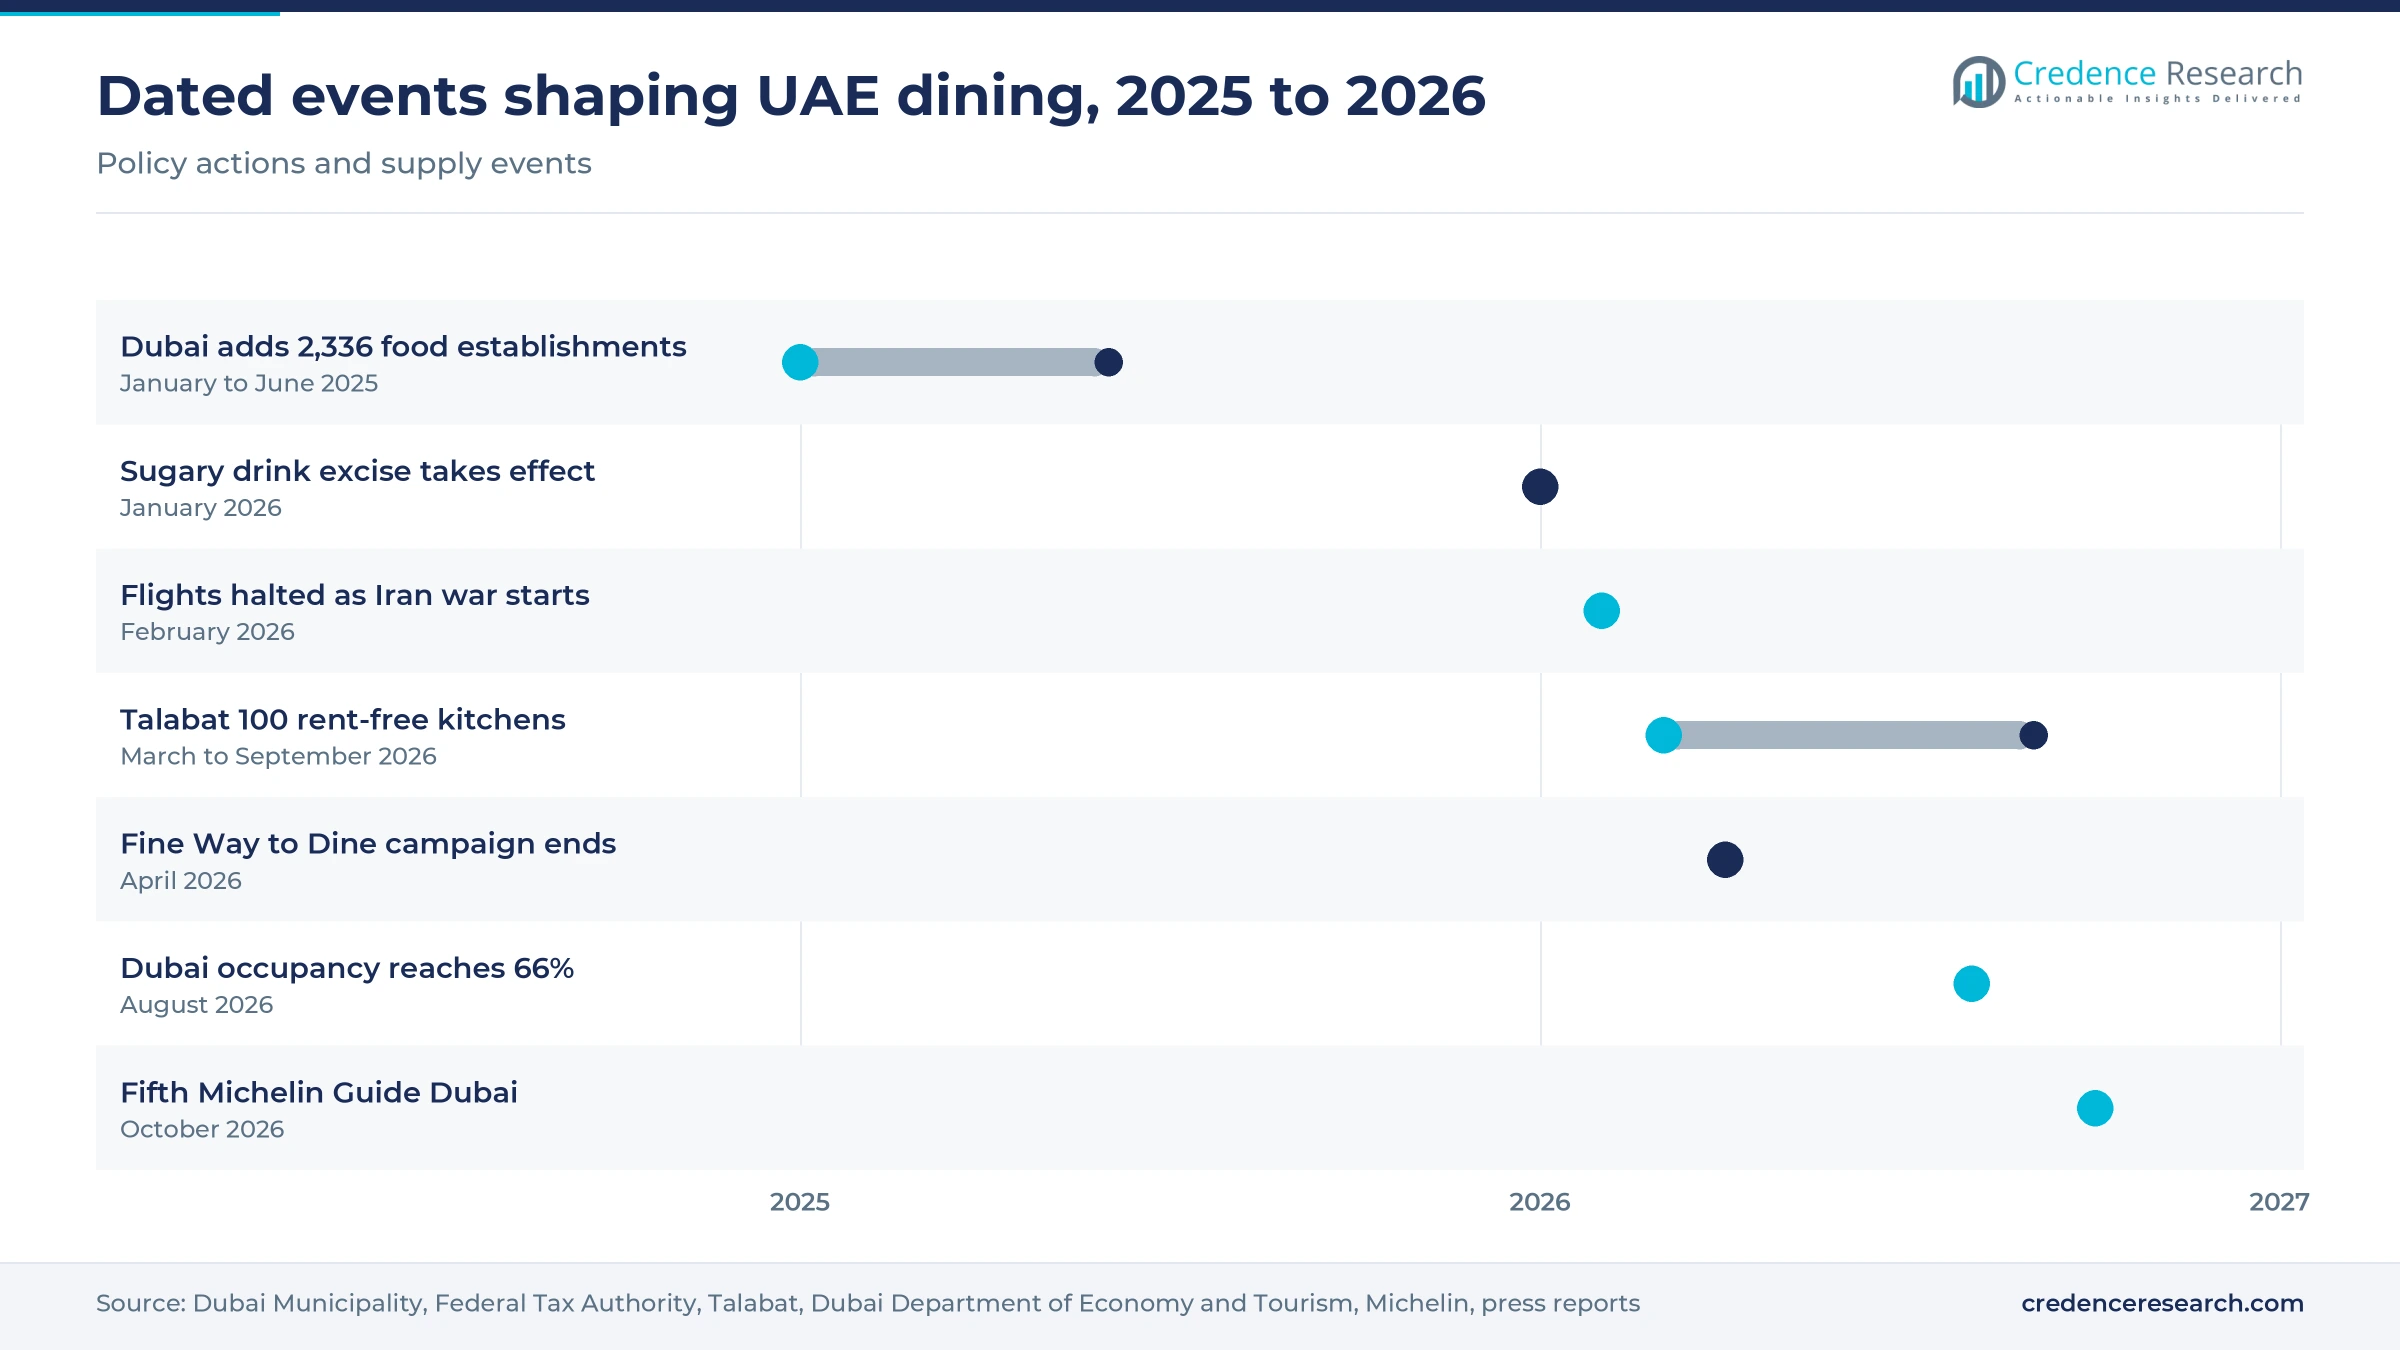
A steady stream of new concepts keeps residents and repeat visitors spending, even in a crowded market. Dubai Municipality reported about 2,336 new food establishments in the first half of 2025 alone, while it carried out 34,700 inspection visits. The fifth Michelin Guide Dubai, unveiled in October 2026, lists 122 restaurants, up 77% from 69 in the 2022 edition, and the 2026 Abu Dhabi guide lists 56. The National listed Nobu at One Za'abeel, L'Avenue at Dubai Mall and the first UAE site of Barrafina among openings planned for early 2026. These arrivals raise the ceiling on what diners will pay, and they extend the reasons tourists choose the UAE for short breaks.
Neighborhood venues and value menus reshape spending
Shift toward neighborhood dining away from tourist districts
Spending has moved from destination venues toward places close to home since the war began. A Reuters report of May 2026 cited a survey of 30 industry leaders running about 400 restaurants, which found demand down an average of 27% on a year earlier and worst in tourist and business districts. The National reported in April 2026 that Fundamental Hospitality saw its neighborhood venues La Maison Ani and Scalini Cucina hold up, while it moved staff to seasonal pop-ups abroad. Atelier House Hospitality told AGBI that some high-end venues lost as much as 90% of footfall. Average dine-in spend still rose to AED 125.5 from AED 124 in Syrve data, so the diners who stayed were not trading down evenly.
Rise of value menus at premium restaurants
Price has become a marketing tool at the top of the market for the first time in years. AGBI reported in April 2026 that Michelin-starred venues were cutting prices for the first time, and that spending per customer at Atelier House restaurants had fallen 10% to 20%. Jun's in Dubai introduced a six-course menu at AED 225, according to Reuters, using more local fish to control costs. Dubai authorities ran the Fine Way to Dine campaign with discounts of up to 50% until April 19, 2026. These moves protect covers but narrow margins that were already 8% to 11% before the disruption. As a result, operators are simplifying menus and tightening purchasing, so lower prices do not simply erase profit.
Opening for homegrown brands in shared cloud kitchens
Homegrown restaurants have an unusual chance to expand without signing another lease. Talabat UAE announced on March 18, 2026, that it would offer 100 fully equipped cloud kitchen spaces rent-free until September 2026 to brands founded in the UAE with at least 24 months of trading. The company received hundreds of applications for those places, according to The National. Noon also waived commission for restaurants newly joining its platform until April 30, 2026, leaving only a 2% payment gateway fee. Tashas Group listed high-end venues on Deliveroo and described the gain as similar to having another restaurant. Therefore, brands that use this window to build order data can enter a recovering market with a lower fixed-cost base than a dining room allows.
Opening for restaurant brands in retail and local sourcing
Restaurants that sell beyond their own dining rooms now have new routes to customers and cheaper supply. Spinneys launched The Chef's Counter in 2026, selling rotating dishes from local chefs in its stores, and it started with dishes from Jun's. Lila Molino in Dubai moved toward fajita kits and a grocery line, according to Reuters in May 2026. The USDA Foreign Agricultural Service reported that the UAE imported USD 16.2 billion of consumer-oriented products in 2024, so even a small move to local produce or Gulf-caught fish shortens a long supply line. Because menu items sold through retail need no table or server, this income also carries less exposure to tourist footfall.
War, import costs and rents squeeze restaurant margins
Slow tourism recovery after the Iran war
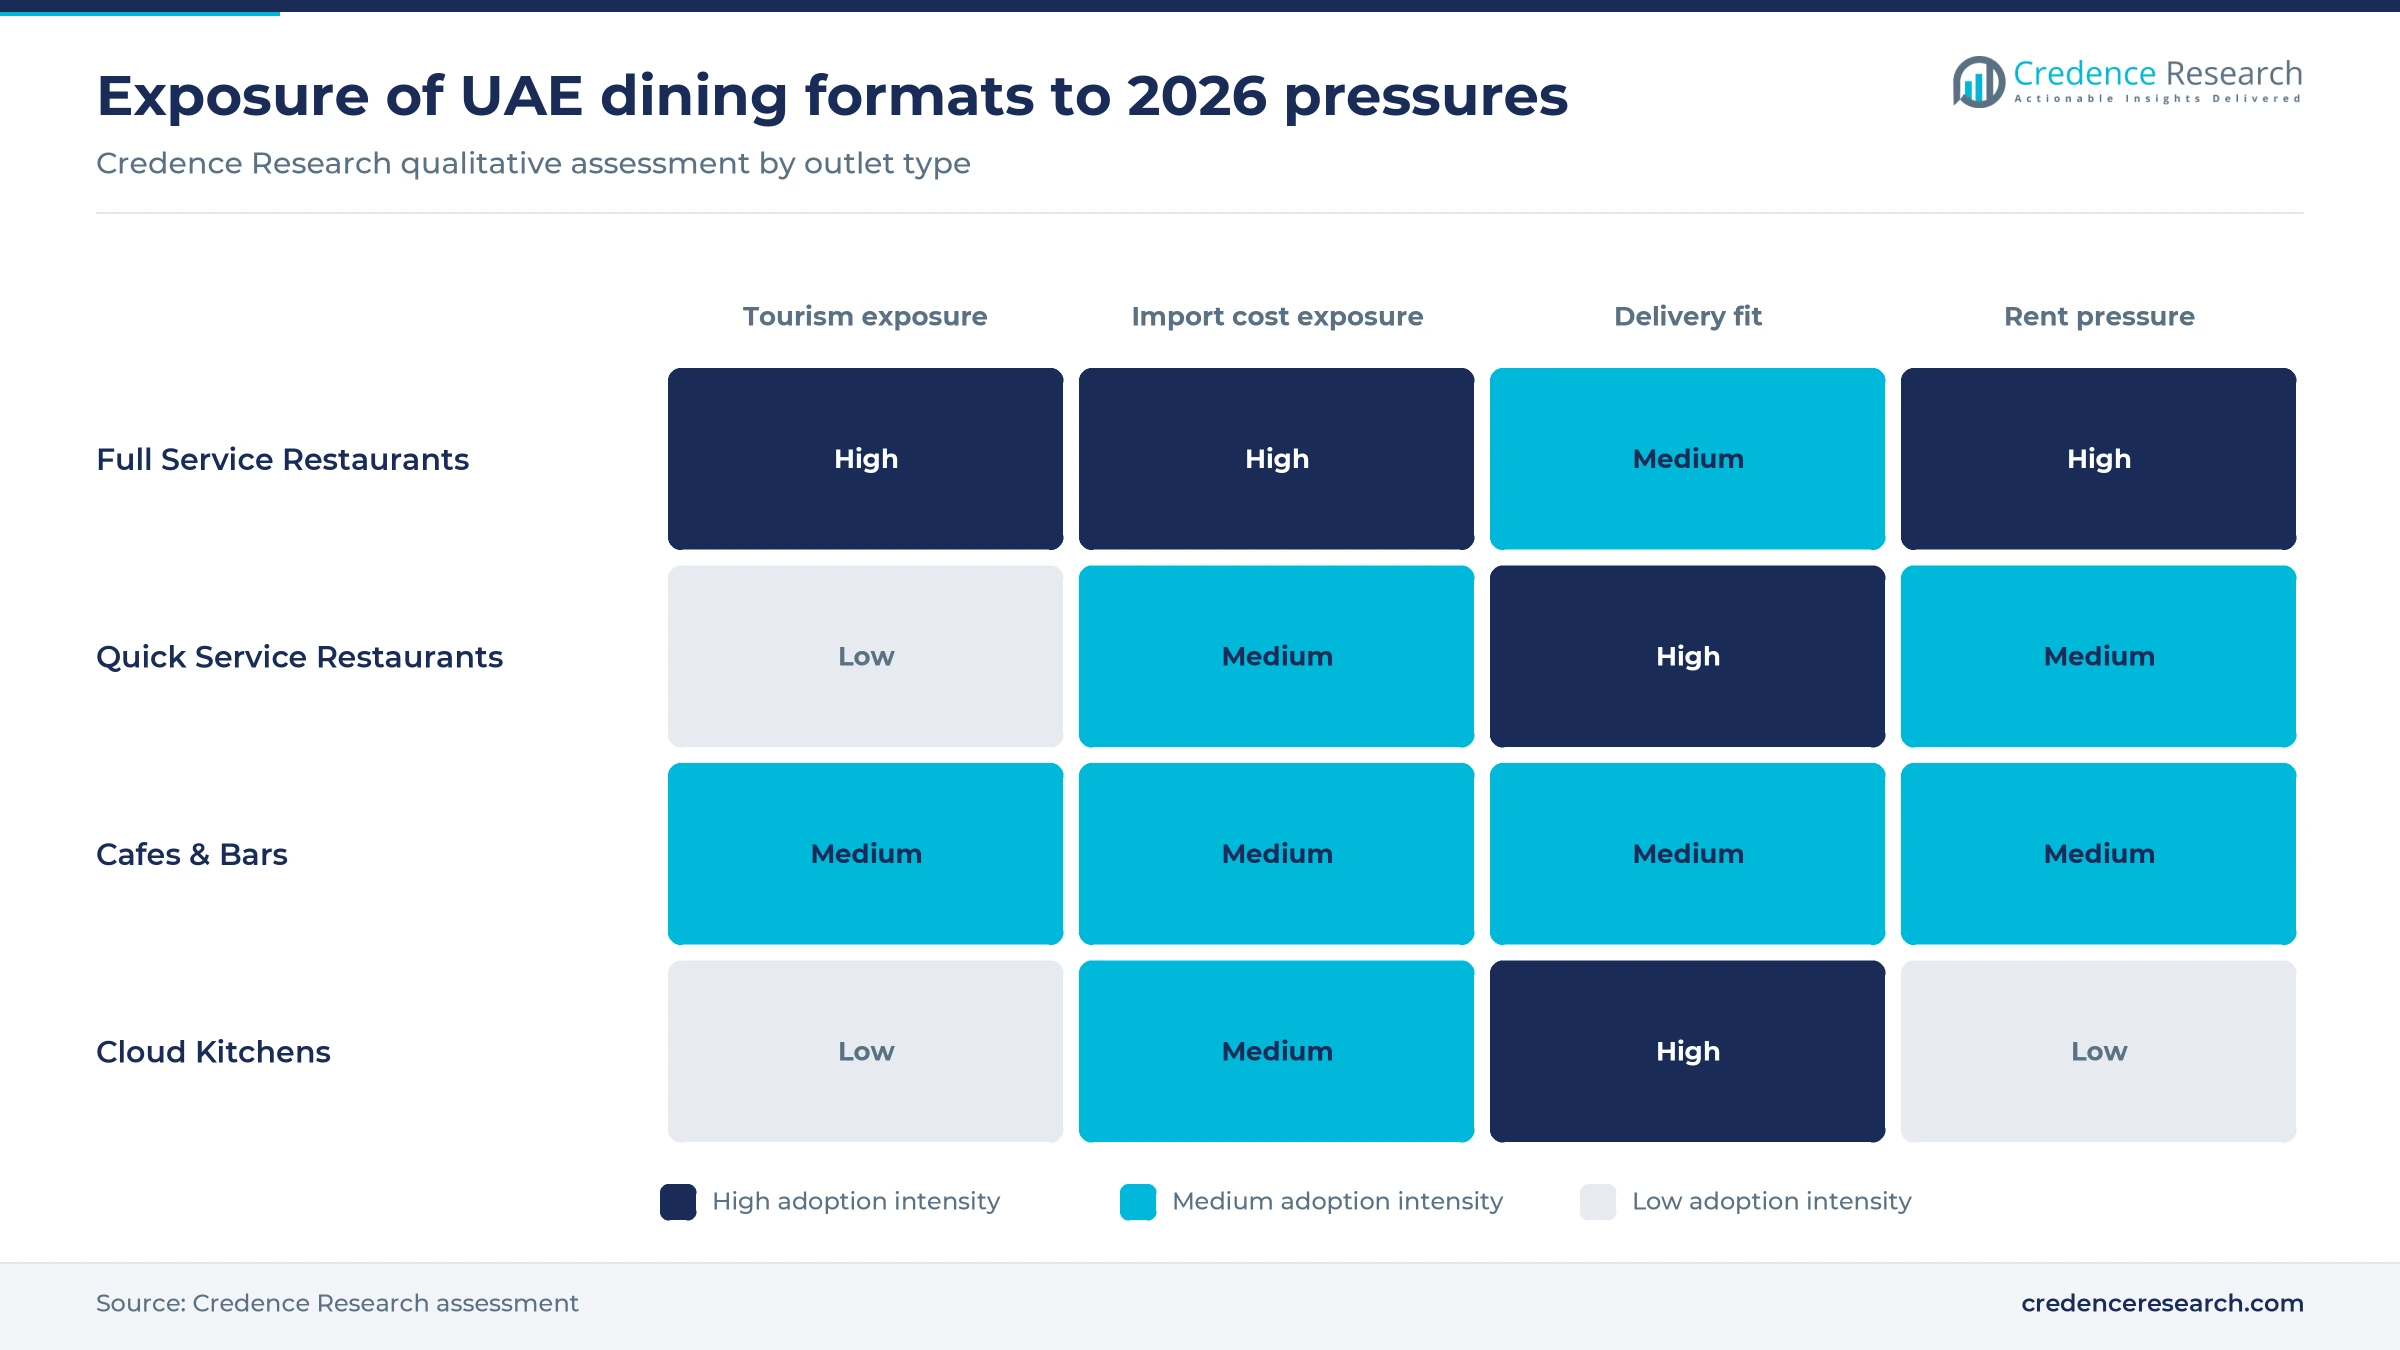
Tourist-dependent venues remain exposed because arrivals have not returned to earlier levels. Gulf News reported 6.97 million international visitors to Dubai from January to August 2026, against 19.59 million for all of 2025. Hotel occupancy fell to 36% in March before reaching 66% in August, which was still below the level a year earlier. Hotels, beach clubs and mall restaurants carry most of this risk, so many have reduced hours, and operators are moving marketing toward residents until flights recover.
Import dependence raises supplier and freight costs
The UAE imports more than 80% of its food, so disruption to shipping feeds straight into kitchen costs. Reuters reported on May 1, 2026, that the Strait of Hormuz remained effectively closed and that air freight rates had risen by as much as 70% on some routes. The same report cited supplier costs up 13% on average for surveyed operators. Chefs responded by shrinking menus and switching to local fish, although specialty cuisines have fewer substitutes and face the sharpest cost pressure.
High rents leave thin margins for independent operators
Prime locations leave restaurants little room to absorb weak trading. Atelier House Hospitality told AGBI in April 2026 that restaurant margins run at 8% to 11%, and that some prime rents had reached AED 400 per square foot before the war. The Associated Press reported in 2025 that almost 1,200 new restaurant licenses were issued in Dubai the previous year, which adds competition for the same diners. Independent outlets without group buying power are most exposed, because a weak month quickly consumes margins of that size.
Platform commissions and new rules add operating cost
Delivery growth brings its own cost, because aggregator commissions can reach 30% according to one Dubai food hall operator quoted by AGBI in April 2026. Regulation adds to this, since a tiered excise of up to AED 1.09 per liter on sugary drinks took effect on Jan. 1, 2026. Gulf News also reported that single-use plastic cups, cutlery and food containers face bans from the same date, which pushes outlets toward costlier compostable packaging. Smaller brands feel these costs most, because they spread them over fewer orders and fewer sites.
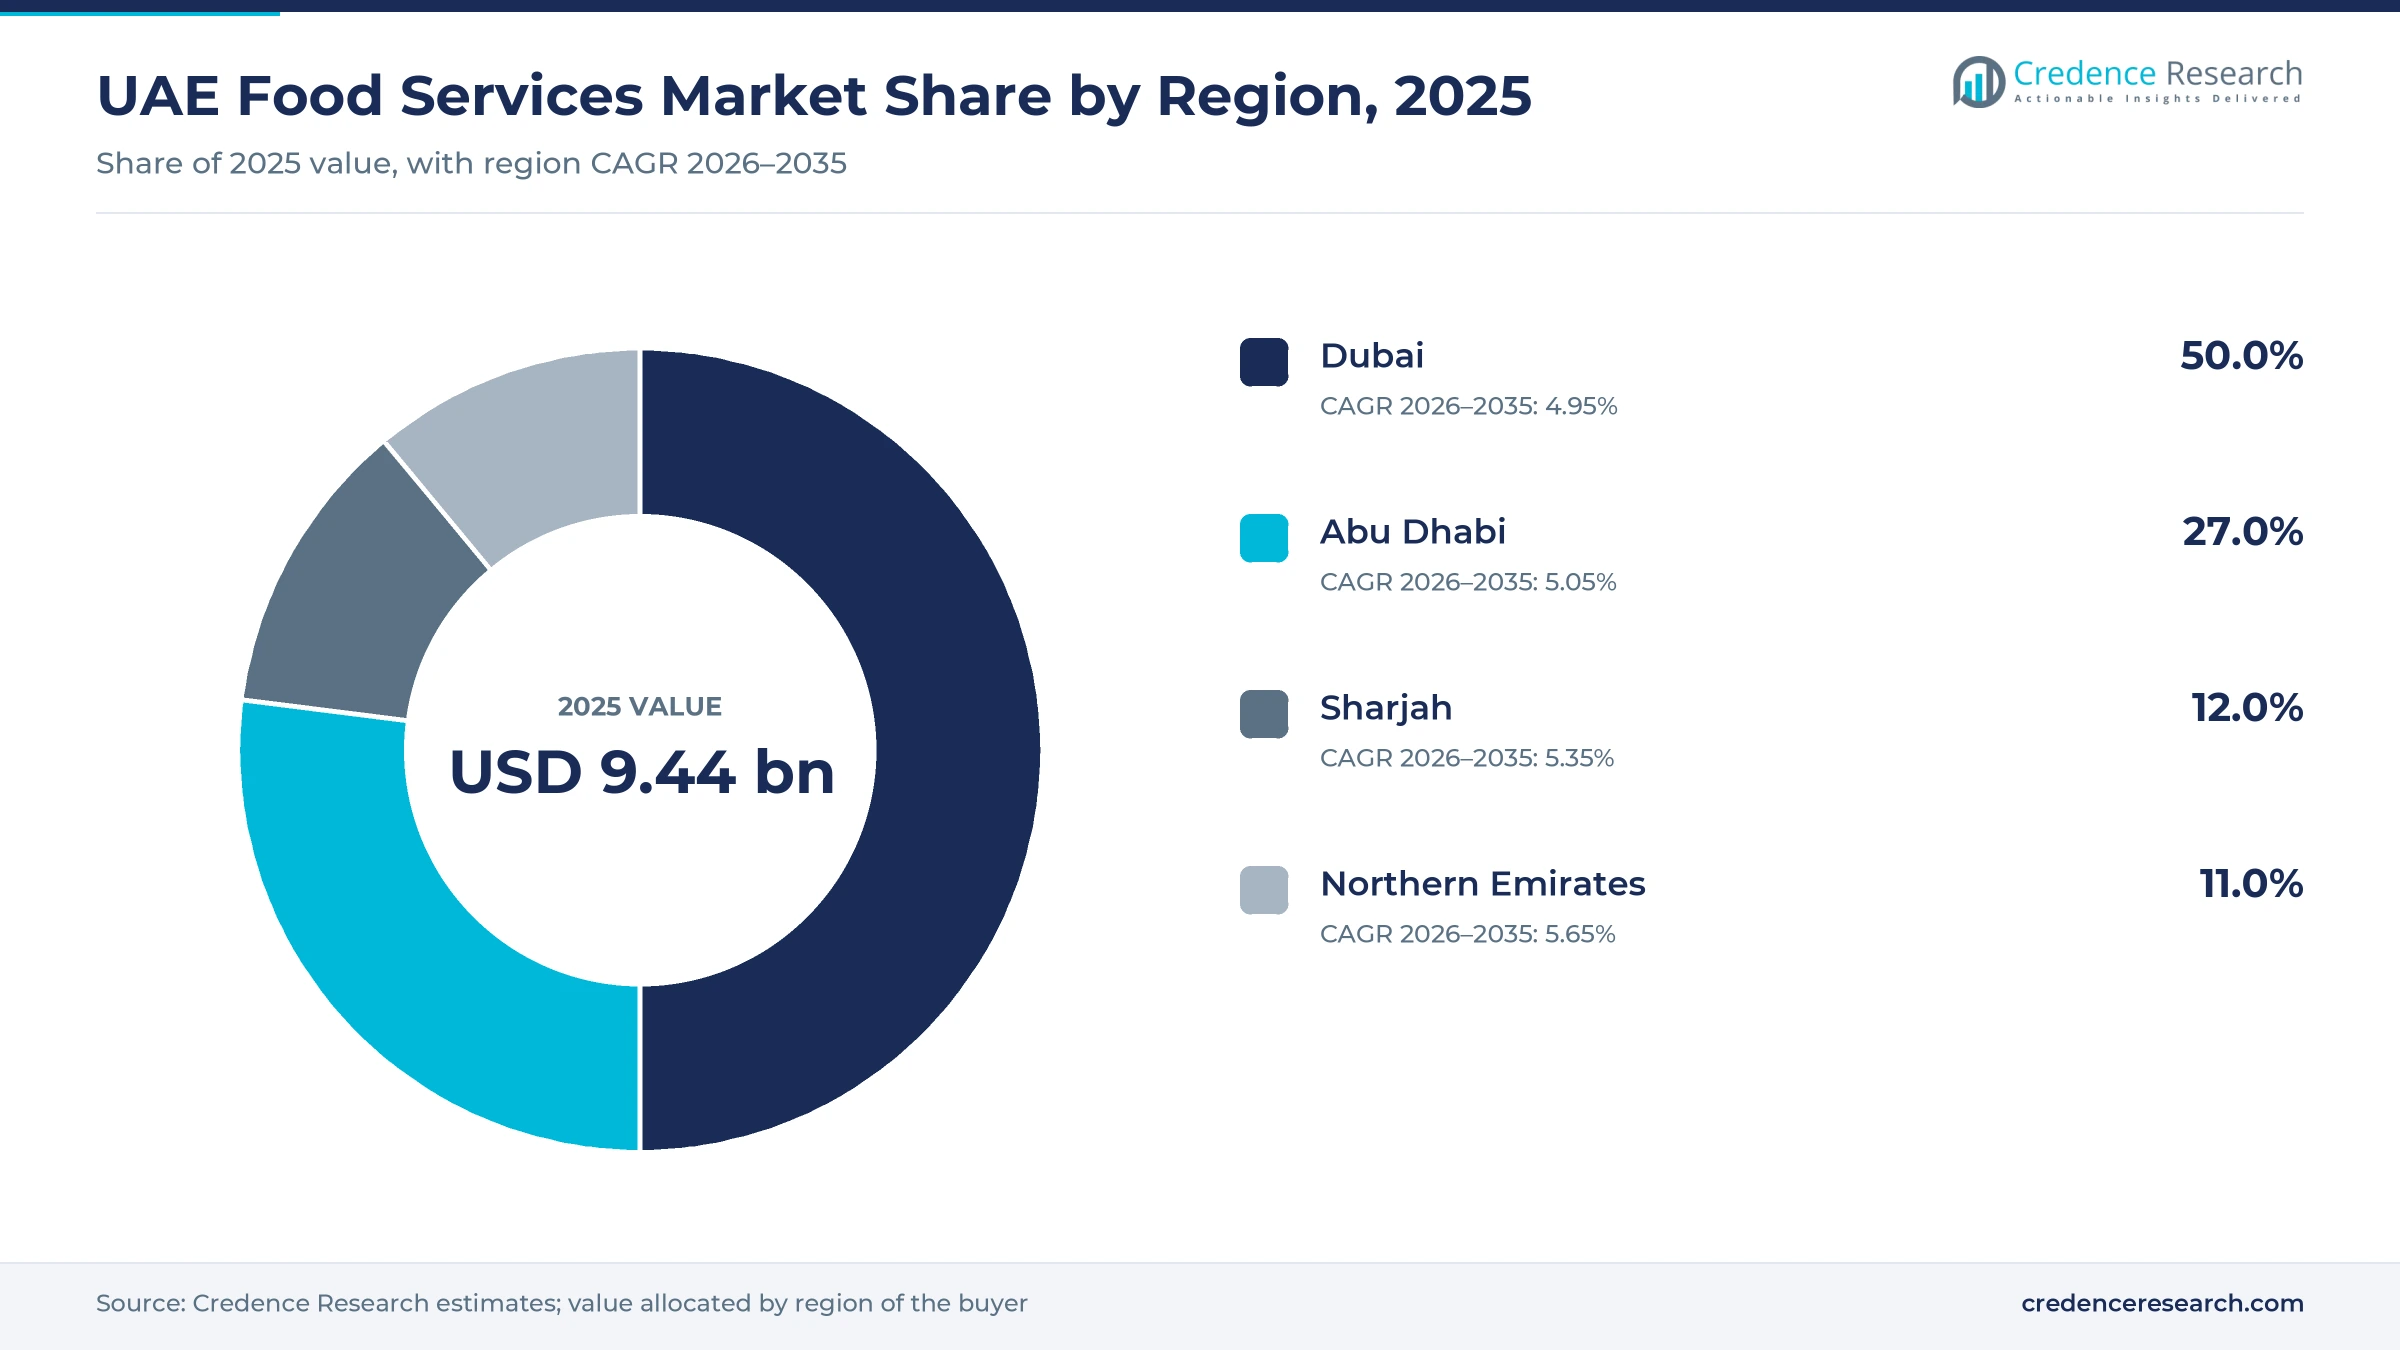
Dubai holds half of spending, Northern Emirates grow fastest
| Region | Value, 2025 (USD billion) | Share, 2025 | CAGR, 2026–2035 |
|---|---|---|---|
| Dubai | 4.72 | 50.0% | 5.0% |
| Abu Dhabi | 2.55 | 27.0% | 5.0% |
| Sharjah | 1.13 | 12.0% | 5.3% |
| Northern Emirates | 1.04 | 11.0% | 5.7% |
Dubai holds half of spending but felt the sharpest visitor shock
Dubai held 50.0% of 2025 value and grows at 5.0% a year, the slowest rate among the zones because it starts from the largest base. Municipality figures show 8,617 restaurants and 5,240 coffee shops and cafeterias, and its Michelin guide now covers 122 restaurants. Its reliance on visitors made it the most exposed zone in 2026, when the emirate received 6.97 million international visitors in eight months. The August occupancy recovery shows that demand is returning, although the visitor count still has some distance to run.
Abu Dhabi gains from residents and events
Abu Dhabi held 27.0% of 2025 value and grows at 5.0% a year. Its 4,135,985 residents at the end of 2024 and a workforce of 2.76 million give operators a large everyday customer base. The emirate recorded 5.9 million hotel guests in 2025, and its Michelin guide for 2026 includes 56 restaurants, among them Erth, Hakkasan and Talea. Isabel Mayfair, the first international site of the London restaurant, opened in Abu Dhabi during 2026 despite the disruption, according to Reuters.
Sharjah adds family demand as platforms expand north
Sharjah held 12.0% of 2025 value and grows at 5.3% a year, helped by a population that reached 2.13 million in the 2025 census. That base grew 51% in 10 years, which adds everyday demand for meals and deliveries close to home. Delivery has followed this demand, as Keeta launched in Sharjah after establishing itself in Dubai and Abu Dhabi. Michelin guides so far cover only Dubai and Abu Dhabi, so Sharjah competes on everyday dining rather than on destination restaurants.
Northern Emirates grow fastest from a small base
The Northern Emirates of Ajman, Ras Al Khaimah, Umm Al Quwain and Fujairah held 11.0% of 2025 value and grow fastest at 5.7% a year. Ras Al Khaimah leads this zone, with a record 1.35 million overnight visitors in 2025, up 6% on 2024, according to its tourism authority. Cloud kitchens can serve these towns without a full dining room, which suits a zone with a far smaller resident base than Dubai. Credence Research expects growth here to come mainly from new sites, because the zone starts from the smallest share of value.
Rent-free kitchens and new guides mark 2026 for operators
| Development | Status and market relevance |
|---|---|
| In October 2026, Michelin unveiled its fifth Dubai guide at Atlantis The Royal, listing 122 restaurants, including two with three stars. | Published. It shows that premium dining supply kept growing during the 2026 disruption. |
| In September 2026, Dubai Department of Economy and Tourism data showed about 869,000 international overnight visitors for August, the highest monthly total since February. | Reported. Hotel occupancy reached 66%, which points to gradual recovery in visitor dining. |
| In July 2026, Americana Restaurants reported 2,746 restaurants at June 30 and said it expected to open 120 to 130 new stores by year-end. | Ongoing. Chain expansion continued despite higher input costs from the conflict. |
| In March 2026, Talabat UAE launched 100 rent-free cloud kitchen spaces for homegrown restaurant brands until September 2026. | Completed term. The program lowered delivery entry costs for local brands during the downturn. |
| In January 2026, the UAE tiered excise on sweetened drinks took effect at up to AED 1.09 per liter, replacing the earlier flat approach. | In force. Beverage costs and menu pricing changed for cafes and quick service outlets. |
Order data and shared kitchens change how outlets trade
- Point-of-sale analytics give operators weekly order and spend data, and Syrve figures covering 6.4 million UAE orders in the first quarter of 2026 are now widely quoted by the industry.
- Delivery super-apps combine meals, groceries and subscriptions, and Talabat says more than a quarter of its monthly active users across its markets hold a Talabat Pro subscription.
- Shared cloud kitchens let a brand test a neighborhood without a dining room, which reduces the fixed rent that makes prime sites risky for independent operators.
- Direct ordering tools help restaurants keep customer data and avoid commissions of up to 30%, although they depend on the brand already having loyal repeat customers.
Need a Custom Version of This Report?
Tailor the scope, geography, or segments to your exact requirements.
- Custom geography or segment scope
- Direct access to our analyst team
Regional franchise groups compete with homegrown brands
Competition splits between regional franchise groups, global brand owners, delivery platforms and homegrown restaurant companies. In its December 2025 report, the USDA Foreign Agricultural Service stated that Yum! Brands held the largest share of the UAE market in 2024. Americana Restaurants operates KFC and Pizza Hut among other brands, and it ran 2,749 restaurants across 12 markets at the end of 2025 after opening 216 gross new stores that year. Alshaya Group runs Starbucks, Shake Shack and other franchised brands across the UAE, while Apparel Group runs Tim Hortons in the UAE through AG Cafe, in a space shared with other coffee chains. Alamar Foods opened its 50th Domino's store in the UAE in 2022, and Galadari Ice Cream remains master licensee for Baskin-Robbins, which opened its first UAE shop in 1979. Talabat, Noon and Keeta compete for restaurant partners with commission offers and kitchen space. Tashas Group and Fundamental Hospitality represent local groups that adjusted quickly in 2026 by moving premium venues onto delivery or shifting staff to seasonal sites.
Companies profiled and their roles in this market
| Company | Type | Role in the market |
|---|---|---|
| Americana Restaurants International PLC | Regional franchise operator | Operates KFC, Pizza Hut and other brands, with 2,746 restaurants across its markets at June 30, 2026 |
| Yum! Brands | Global brand owner | Held the largest UAE market share in 2024, according to the USDA report of December 2025 |
| Alshaya Group | Regional franchise operator | Runs Starbucks, Shake Shack and other franchised restaurant brands in the UAE |
| Apparel Group | Retail and cafe group | Runs Tim Hortons in the UAE through AG Cafe, with UAE menu launches in July 2025 |
| Alamar Foods Company | Master franchisee | Operates Domino's in the UAE and opened its 50th store there in 2022 |
| Galadari Ice Cream Co. LLC | Master licensee | Runs Baskin-Robbins across the Middle East and passed 1,000 stores in March 2022 |
| Talabat | Delivery platform | Largest market is the UAE, offered 100 rent-free cloud kitchen spaces in March 2026 |
| Noon | Delivery platform | Waived commission for restaurants joining until April 30, 2026 |
| Keeta | Delivery platform | Launched in Dubai, Abu Dhabi and then Sharjah, adding competition among apps |
| Tashas Group | Homegrown restaurant group | Moved Flamingo Room, Avli and Bungalo34 onto Deliveroo in 2026 |
| Fundamental Hospitality | Homegrown restaurant group | Runs La Maison Ani and Scalini Cucina in Dubai and redeployed staff to seasonal pop-ups in 2026 |
Recovery favors operators with delivery and local supply
Credence Research's view is that the 2026 dip is a sharp interruption rather than a change in the structure of UAE dining. Population growth in Abu Dhabi, Dubai and Sharjah gives operators a larger resident base than they had before the war, and that base held up better than tourism. The main risk is timing, because recovery in premium venues depends on flights and hotel demand that are still below 2025 levels. Operators with delivery capability, local supply and neighborhood sites should regain volume earliest, while heavily leased premium venues need more time to rebuild margins.
How the 2025 estimate and its splits were built
The report uses 2025 as the base year and 2026 to 2035 as the forecast period. The market value comes from the Credence Research model, which brought the earlier 2023 estimate forward at its 5.1% growth rate and then set 2026 about 5.7% lower, reflecting an Iran war that halted flights from Feb. 28, operators reporting demand down 27% in a survey cited by Reuters in May 2026, and Dubai hotel occupancy back to 89% of its year-earlier level by August. The estimate was checked against outlet counts, visitor statistics and published operator data. Segment and regional splits are Credence Research estimates built from these public sources. Sources include government statistics, regulator and tourism authority releases, USDA reports, company announcements and named press coverage. No interviews or primary surveys were conducted by Credence Research for this report.
Tourism return sets the pace of growth through 2035
The market is expected to rise from USD 8.90 billion in 2026 to USD 13.93 billion by 2035 at a 5.10% CAGR, with the strongest gains in the early recovery years as flights and hotel demand normalize. Full service dining should keep the largest share, although cloud kitchens and travel sites will add share from their smaller bases. Dubai should still hold close to half of UAE food services demand by 2035, based on current Credence Research zone estimates. Supply security will stay on operator agendas, because the 2026 disruption showed how much of the menu depends on open shipping routes.
Frequently Asked Questions
How big is the UAE food services market?
How many restaurants are there in the UAE?
What is the average order value for food delivery in the UAE?
How large is food delivery within UAE restaurant orders?
Which are the main food service companies in the UAE?
Which segment leads the UAE food services market?
Which emirate has the largest food services market?
How has the Iran war affected UAE restaurants?
Table of Content
Chapter 1 Market Segmentation
- 1.1 Segmentation Framework
- 1.1.1 Product and Service Classification
- 1.1.2 Application and End-Use Classification
- 1.1.3 Technology and Solution Classification
- 1.1.4 Customer and Distribution Channel Classification
- 1.1.5 Geographic Segmentation
- 1.1.6 Market Segment Definitions and Boundaries
- 1.2 By Type
- 1.2.1 Full Service Restaurants
- 1.2.2 Quick Service Restaurants
- 1.2.3 Cafes & Bars
- 1.2.4 Cloud Kitchens
- 1.3 By Outlet
- 1.3.1 Independent Outlets
- 1.3.2 Chained Outlets
- 1.4 By Location
- 1.4.1 Standalone
- 1.4.2 Retail
- 1.4.3 Lodging
- 1.4.4 Leisure
- 1.4.5 Travel
Chapter 2 Introduction
- 2.1 Report Objectives and Scope
- 2.2 Product Definition and Industry Terminology
- 2.3 Market Inclusions and Exclusions
- 2.4 Research Process
- 2.4.1 Primary Research and Expert Interviews
- 2.4.2 Secondary Research and Source Review
- 2.4.3 Top-Down and Bottom-Up Estimation
- 2.4.4 Data Triangulation and Verification
- 2.5 Market Size Measurement Basis
- 2.5.1 2025: USD 9.44 billion → 2035: USD 13.93 billion
- 2.6 Historical and Forecast Reference Periods
- 2.6.1 Historical Period: 2018-2025
- 2.6.2 Base Year: 2025
- 2.6.3 Forecast Period: 2025-2035
- 2.7 Research Assumptions and Limitations
Chapter 3 Executive Summary
- 3.1 Market Snapshot and Key Findings
- 3.2 Base-Year Market Size, 2025
- 3.3 Forecast Market Size, 2035
- 3.4 Revenue and Volume Growth Outlook
- 3.5 Key Demand and Supply Indicators
- 3.6 Leading Market Segments
- 3.7 Fastest-Growing Market Opportunities
- 3.8 Regional Performance Highlights
- 3.9 Technology and Industry Transformation
- 3.10 Competitive Landscape Summary
- 3.11 Analyst View and Strategic Implications
Chapter 4 UAE Food Services Market Trends and Developments
- 4.1 Historical Industry Development, 2018-2025
- 4.2 Recent Market Trends and Developments
- 4.3 Demand and Customer Behavior Trends
- 4.4 Technology and Product Innovation
- 4.5 Artificial Intelligence, Automation and Digitalization
- 4.6 Local Manufacturing and Supply Chain Realignment
- 4.7 Industry Partnerships, Mergers and Acquisitions
- 4.8 Sustainability and Circular Economy Developments
- 4.9 Government and Private Sector Investment Trends
- 4.10 Emerging Business Models and Commercialization
- 4.11 Industry Developments and Announcements
Chapter 5 UAE Food Services Market Supply and Demand Analysis
- 5.1 Demand Trend and Consumption Analysis, 2018-2025
- 5.2 Demand Forecast, 2025-2035
- 5.3 Supply Chain Structure and Procurement Trends
- 5.4 Supply-Demand Gap and Bottlenecks
- 5.5 Import Dependence and Sourcing Structure
- 5.6 Regional Supply and Demand Concentration
Chapter 6 UAE Food Services Market Pricing Analysis
- 6.1 Pricing Structure and Measurement
- 6.2 Historical Pricing Trends, 2018-2025
- 6.3 Pricing Outlook, 2025-2035
- 6.4 Pricing by Product and Market Segment
- 6.5 Geographic Pricing Differences
- 6.6 Key Input, Energy, Labor and Logistics Costs
- 6.7 Contract Pricing and Purchasing Models
- 6.8 Pricing Sensitivity and Competitive Positioning
- 6.9 Price, Margin and Profitability Implications
Chapter 7 UAE Food Services Market Dynamics
- 7.1 Market Growth Drivers
- 7.1.1 Demand-Side Drivers
- 7.1.2 Technology and Innovation Drivers
- 7.1.3 Infrastructure and Investment Drivers
- 7.1.4 Regulatory and Policy Drivers
- 7.2 Market Restraints
- 7.2.1 Cost and Affordability Constraints
- 7.2.2 Technology and Adoption Barriers
- 7.2.3 Supply Chain and Operational Constraints
- 7.3 Market Challenges
- 7.3.1 Competitive Pressure and Margin Erosion
- 7.3.2 Skills, Infrastructure and Implementation Gaps
- 7.4 Emerging Market Opportunities
- 7.5 Market Dynamics Impact and Time-Horizon Assessment
Chapter 8 UAE Food Services Value Chain Analysis
- 8.1 Industry Value Chain Overview
- 8.2 Upstream Suppliers and Critical Inputs
- 8.3 Technology and Component Providers
- 8.4 Manufacturing or Service Delivery
- 8.5 Distribution, Channel Partners and Integrators
- 8.6 Downstream Applications and End Users
- 8.7 Value Addition and Profit Pools
- 8.8 Vertical Integration and Outsourcing
- 8.9 Supplier Concentration and Risk
- 8.10 Supply Chain Localization and Resilience
Chapter 9 UAE Food Services Market Regulations and Policies
- 9.1 Relevant Laws, Standards and Compliance Frameworks
- 9.2 Product, Service, Safety and Quality Requirements
- 9.3 Government Policies, Incentives and Subsidies
- 9.4 Imports, Exports and Trade Barriers
- 9.5 Public Procurement and Local Content Requirements
- 9.6 Data Protection, AI and Cybersecurity Compliance
- 9.7 Upcoming Policy Changes and Market Implications
Chapter 10 UAE Food Services Market Hotspots and Opportunities
- 10.1 Market Opportunity Mapping and Growth Hotspots
- 10.2 High-Growth Applications and Customer Groups
- 10.3 Underserved Markets and White-Space Opportunities
- 10.4 Emerging Technology and Product Opportunities
- 10.5 New Capacity and Investment Hotspots
- 10.6 Market Entry and Expansion Opportunities
- 10.7 Distribution and Partnership Opportunities
- 10.8 Near-Term and Long-Term Commercial Potential
- 10.9 Opportunity Attractiveness and Execution Risks
Chapter 11 UAE Food Services Market Outlook, 2025-2035
- 11.1 Market Size and Analysis
- 11.1.1 Revenue (Market Measurement: 2025: USD 9.44 billion → 2035: USD 13.93 billion)
- 11.1.2 Historical Market Size, 2018-2025
- 11.1.3 Base-Year Market Size, 2025
- 11.2 Market Forecast, 2025-2035
- 11.2.1 Revenue Forecast to 2035
- 11.2.2 CAGR and Year-on-Year Growth
- 11.2.3 Incremental Revenue Opportunity
- 11.3 Forecast Assumptions and Scenario Analysis
- 11.3.1 Base-Case Forecast
- 11.3.2 Optimistic and Conservative Scenarios
- 11.3.3 Technology, Pricing and Policy Sensitivities
- 11.4 Market Attractiveness and Growth Outlook
Chapter 12 UAE Food Services Market Segmentation and Outlook
- 12.1 Segmentation Summary and Market Shares, 2025
- 12.2 Largest and Fastest-Growing Segments
- 12.3 By Type - Market Size and Forecast, 2025-2035
- 12.3.1 Segment Definition and Scope
- 12.3.2 Historical Market Size, 2018-2025
- 12.3.3 Revenue Forecast, 2025-2035
- 12.3.4 Base-Year Market Share, 2025
- 12.3.5 Segment CAGR and Growth Drivers
- 12.3.6 Subsegment Market Size and Forecast
- 12.3.6.1 Full Service Restaurants
- 12.3.6.2 Quick Service Restaurants
- 12.3.6.3 Cafes & Bars
- 12.3.6.4 Cloud Kitchens
- 12.3.7 Subsegment Pricing and Adoption Trends
- 12.3.8 Leading Suppliers and Competition
- 12.3.9 Regional Demand and Opportunities
- 12.4 By Outlet - Market Size and Forecast, 2025-2035
- 12.4.1 Segment Definition and Scope
- 12.4.2 Historical Market Size, 2018-2025
- 12.4.3 Revenue Forecast, 2025-2035
- 12.4.4 Base-Year Market Share, 2025
- 12.4.5 Segment CAGR and Growth Drivers
- 12.4.6 Subsegment Market Size and Forecast
- 12.4.6.1 Independent Outlets
- 12.4.6.2 Chained Outlets
- 12.4.7 Subsegment Pricing and Adoption Trends
- 12.4.8 Leading Suppliers and Competition
- 12.4.9 Regional Demand and Opportunities
- 12.5 By Location - Market Size and Forecast, 2025-2035
- 12.5.1 Segment Definition and Scope
- 12.5.2 Historical Market Size, 2018-2025
- 12.5.3 Revenue Forecast, 2025-2035
- 12.5.4 Base-Year Market Share, 2025
- 12.5.5 Segment CAGR and Growth Drivers
- 12.5.6 Subsegment Market Size and Forecast
- 12.5.6.1 Standalone
- 12.5.6.2 Retail
- 12.5.6.3 Lodging
- 12.5.6.4 Leisure
- 12.5.6.5 Travel
- 12.5.7 Subsegment Pricing and Adoption Trends
- 12.5.8 Leading Suppliers and Competition
- 12.5.9 Regional Demand and Opportunities
- 12.6 Segment Growth Comparison
- 12.7 Segment Attractiveness and Priority Matrix
Chapter 13 UAE Food Services Geographic Market Outlook, 2025-2035
- 13.1 Domestic Market Distribution and Demand Clusters
- 13.2 State- or Province-Wise Market Size and Forecast, 2025-2035
- 13.3 City and Metropolitan Market Outlook
- 13.4 Industrial, Manufacturing and Commercial Clusters
- 13.5 Geographic Concentration of Key End Users
- 13.6 Local Pricing and Purchasing Differences
- 13.7 Domestic Production Facilities and Capacity Map
- 13.8 Local Infrastructure and Project Pipeline
- 13.9 State-Level Policy and Incentive Differences
- 13.10 Subnational Investment Hotspots and Opportunities
- 13.11 Distribution and Logistics Networks
- 13.12 Domestic Competitive Footprint
Chapter 14 UAE Food Services Technology, Innovation and Sustainability Outlook
- 14.1 Technology Landscape and Maturity
- 14.2 Product, Process and Service Innovation
- 14.3 AI, Automation and Digital Tools in the Industry
- 14.4 Technology Adoption and Performance Benchmarking
- 14.5 Innovation Pipeline and R&D Investment
- 14.6 Energy Efficiency and Resource Management
- 14.7 Sustainability, Recycling and Circularity
- 14.8 Technology Roadmap, 2025-2035
- 14.9 Risks of Obsolescence and Technology Substitution
Chapter 15 UAE Food Services Market Key Strategic Imperatives
- 15.1 Growth and Market Entry Priorities
- 15.2 High-Return Products and Segments
- 15.3 Pricing, Profitability and Cost Optimization
- 15.4 Technology Investment and Product Differentiation
- 15.5 Supply Chain Localization and Resilience
- 15.6 Distribution and Customer Acquisition
- 15.7 Partnership, Acquisition and Capacity Strategy
- 15.8 Regional Expansion Priorities
- 15.9 Short-, Medium- and Long-Term Actions
Chapter 16 Competition Outlook
- 16.1 Industry Competition Characteristics
- 16.2 Market Structure and Concentration
- 16.3 Market Share and Competitive Positioning, 2025
- 16.4 Company-Wise Revenue and Product Benchmarking
- 16.5 Production and Service Capacity Benchmarking
- 16.6 Technology, Pricing and Differentiation
- 16.7 Regional Footprint and Distribution Strength
- 16.8 Mergers, Acquisitions and Strategic Alliances
- 16.9 New Entrants and Competitive Threats
- 16.10 Porter's Five Forces and Industry Attractiveness
- 16.11 Competitive Outlook, 2025-2035
Chapter 17 Company Profiles
- 17.1 Company Coverage and Selection Criteria
- 17.2 Americana Restaurants International PLC
- 17.2.1 Business Description
- 17.2.2 Company Ownership and Geographic Presence
- 17.2.3 Product and Service Portfolio
- 17.2.4 Manufacturing and Operating Footprint
- 17.2.5 Financial Performance and Investment
- 17.2.6 Market Share and Competitive Position
- 17.2.7 Technology and Innovation Capabilities
- 17.2.8 Strategic Alliances or Partnerships
- 17.2.9 Recent Developments
- 17.2.10 Growth Strategy and Outlook
- 17.3 Yum! Brands
- 17.4 Alshaya Group
- 17.5 Apparel Group
- 17.6 Alamar Foods Company
- 17.7 Galadari Ice Cream Co. LLC
- 17.8 Talabat
- 17.9 Noon
- 17.10 Keeta
- 17.11 Tashas Group
- 17.12 Fundamental Hospitality
- 17.13 Other Relevant Market Participants
Note: Every listed company is profiled on the structure shown under the first company. The company list is preliminary and may change based on research findings, market developments, data availability and client requirements.
Chapter 18 Disclaimer
- 18.1 Research and Forecast Disclaimer
- 18.2 Data Source and Estimation Limitations
Note: The depth of individual sections depends on data availability for this market. Volume, capacity, trade and other unit-based metrics are included where applicable.

