
| REPORT ATTRIBUTE | DETAILS |
|---|---|
| Historical Period | 2020-2023 |
| Base Year | 2024 |
| Forecast Period | 2025-2032 |
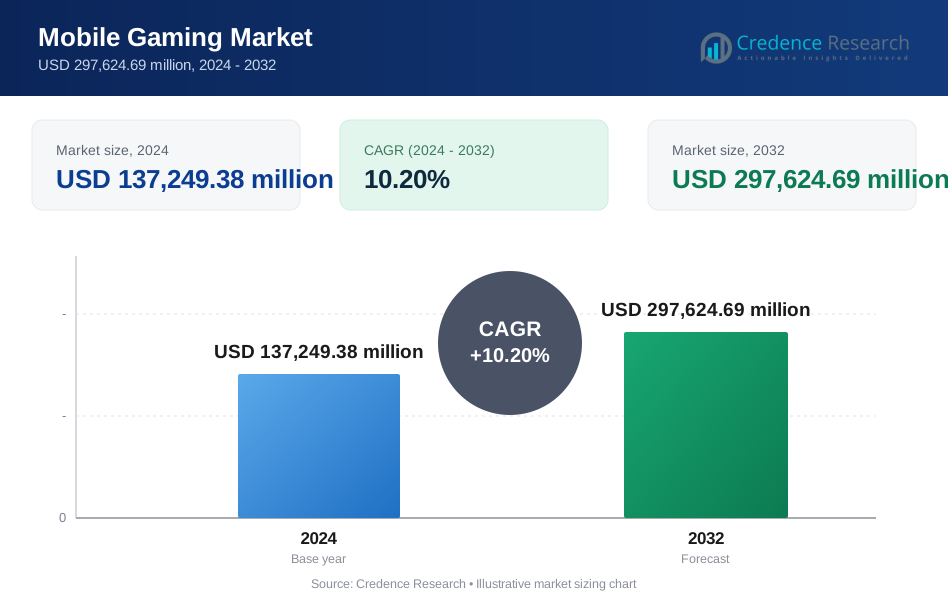
| Mobile Gaming Market Size 2024 | USD 137,249.38 million |
| Mobile Gaming Market, CAGR | 10.20% |
| Mobile Gaming Market Size 2032 | USD 297,624.69 million |
Market Overview:
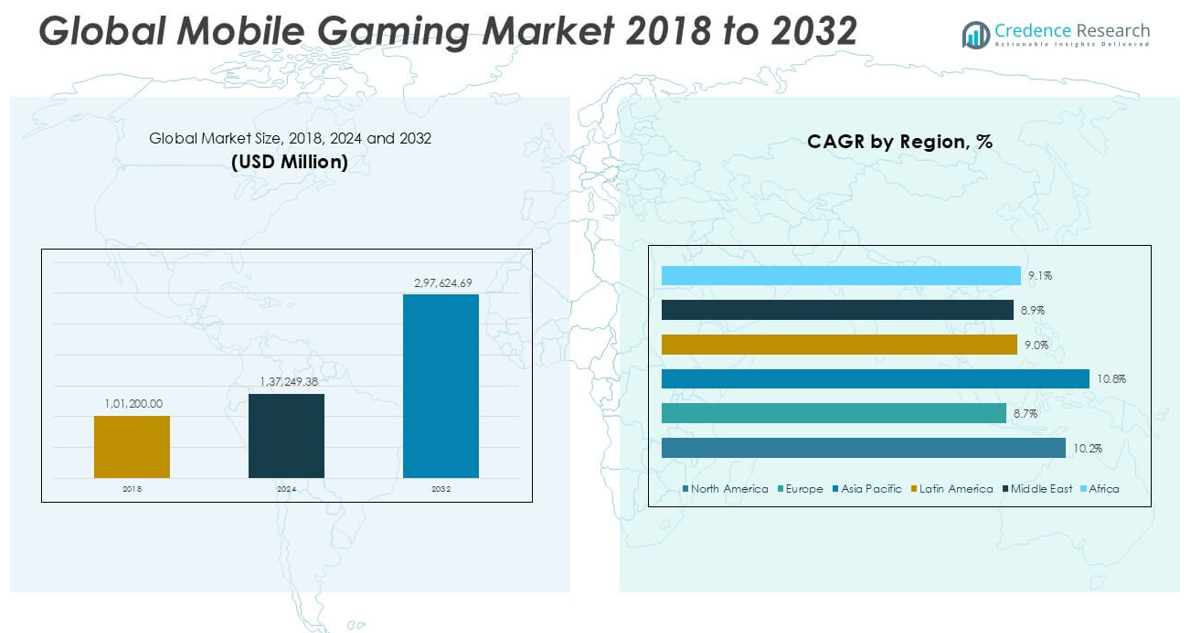
The Mobile Gaming market size was valued at USD 101,200.00 million in 2018, reached USD 137,249.38 million in 2024, and is anticipated to reach USD 297,624.69 million by 2032, at a CAGR of 10.20% during the forecast period.
The Mobile Gaming market is highly competitive, with key players such as Tencent Holdings Limited, Apple Inc., Google LLC, NetEase Inc., Activision Blizzard Inc., Electronic Arts Inc., Nintendo Co., Ltd., Roblox Corporation, Supercell Oy, Playrix Holding Ltd, and Niantic Inc. leading the industry through continuous innovation, strong game portfolios, and expansive global reach. These companies dominate the market by leveraging advanced technologies, multiplayer platforms, and diverse monetization models. Asia Pacific emerges as the leading region, commanding 53.4% of the global market share in 2024, driven by the massive smartphone user base, affordable internet access, and the growing popularity of mobile eSports. North America and Europe follow as significant contributors, supported by high consumer spending and rapid adoption of subscription-based gaming models.
Market Insights
- The Mobile Gaming market was valued at USD 101,200.00 million in 2018, reached USD 137,249.38 million in 2024, and is expected to hit USD 297,624.69 million by 2032, growing at a CAGR of 10.20% during the forecast period.
- Growing smartphone penetration, affordable mobile data, and increasing demand for interactive multiplayer games are key drivers boosting market expansion globally.
- Subscription-based gaming, play-to-earn models, and the rapid rise of mobile eSports are emerging trends transforming the mobile gaming landscape and offering new growth opportunities.
- The market faces restraints from high competition, user retention challenges, and rising regulatory restrictions concerning data privacy and in-game purchases.
- Asia Pacific dominates the market with 53.4% share in 2024, driven by large mobile user bases, followed by North America (21.2%) and Europe (13.3%), while the Action & Adventure genre holds the largest segment share.
Market Segmentation Analysis:
By Platform
Android holds the largest market share in the mobile gaming platform segment, driven by its wide user base, affordability, and availability of diverse gaming applications. The flexibility of the Android ecosystem allows developers to reach a broader audience, especially in emerging markets such as India, Southeast Asia, and Latin America. Its open-source nature and compatibility with a wide range of devices continue to support its dominance in the mobile gaming industry. iOS follows as a significant contributor, particularly in developed regions like North America and Europe. iOS users demonstrate higher spending power, which benefits premium and in-app purchase models. Hybrid/Cross-Platform games are gaining traction due to their ability to provide seamless gaming experiences across devices, reducing development costs. Progressive Web Apps (PWAs) are still emerging but offer growth potential as they improve user engagement without requiring app downloads.
- For instance, Google Play reported over 2.67 million apps available for download in 2024, with mobile games accounting for approximately 13.6% of the total, making it the largest gaming app distribution platform globally.
By Genre
The Action & Adventure segment dominates the mobile gaming genre, holding the largest market share due to its immersive gameplay, advanced graphics, and increasing popularity of multiplayer formats. This genre attracts a broad demographic, particularly younger users, and benefits from frequent updates and interactive storylines that drive long-term engagement. Role-Playing Games (RPG) and Strategy & Simulation games also contribute significantly, especially among dedicated gamers who invest considerable time and resources. Puzzle games maintain strong appeal among casual gamers for their simplicity and stress-relieving nature. Sports & Racing games continue to grow with the rise of mobile eSports, while other niche genres support market diversity and user retention.
- For instance, FIFA Mobile by Electronic Arts recorded over 100 million downloads on the Google Play Store alone, demonstrating sustained interest in sports-based mobile games.
By Monetization Model
Free-to-Play (F2P) games dominate the monetization model segment, capturing the largest market share due to their accessibility and ability to attract a vast user base. The F2P model effectively drives revenue through in-game advertisements and microtransactions, particularly in emerging markets where upfront payment barriers are high.. In-App Purchases are the second-largest revenue driver, especially in iOS markets where users display higher spending tendencies. Premium (Paid Games) hold a smaller but stable segment, often preferred for their ad-free experience and higher-quality gameplay. Play-to-Earn (P2E) models are rapidly expanding, attracting users with the prospect of earning digital assets, while Subscription-Based games gain momentum by offering exclusive content and seamless gaming experiences.
Market Overview
Expanding Smartphone Penetration
The rapid increase in global smartphone penetration significantly drives the mobile gaming market. Affordable smartphones with high-performance capabilities have enabled broader access to mobile games, especially in emerging markets like India, Brazil, and Southeast Asia. As smartphones become more technologically advanced, with larger screens and faster processors, they enhance the gaming experience, attracting more users across various demographics. The growing youth population and the rising availability of low-cost internet further accelerate the adoption of mobile gaming worldwide.
- For instance, Xiaomi shipped 145.8 million smartphones globally in 2023, with India alone accounting for over 40 million units, significantly contributing to the accessibility of mobile games in price-sensitive markets.
Rising Popularity of Multiplayer and Social Games
The surge in social and multiplayer mobile games has transformed the gaming landscape, fostering interactive and community-driven experiences. These games, often integrated with social media platforms, enable real-time interaction, competition, and collaboration among players globally. The popularity of battle royale and team-based games has substantially increased user engagement and retention. This trend is further supported by advancements in mobile connectivity, including 4G and 5G networks, which allow seamless online gameplay and contribute to the sustained growth of the mobile gaming market.
- For instance, Call of Duty: Mobile, developed by Activision, achieved over 650 million downloads worldwide by November 2022, driven by its real-time multiplayer gameplay and social engagement features.
Advancements in Mobile Gaming Technology
Continuous advancements in mobile gaming technology, such as augmented reality (AR), virtual reality (VR), and cloud gaming, are fueling market expansion. These innovations offer immersive experiences and high-quality graphics that rival traditional gaming platforms. Cloud gaming, in particular, reduces the need for high-end devices, making premium games more accessible. The integration of AI for personalized gaming experiences and improved game development tools has further enhanced game quality and diversity, driving user interest and spending in the mobile gaming ecosystem.
Key Trends & Opportunities
Growth of Subscription-Based and Play-to-Earn Models
Subscription-based gaming services and play-to-earn (P2E) models are emerging as significant growth opportunities in the mobile gaming market. Subscription models offer users access to exclusive content, ad-free experiences, and seamless cross-platform play, encouraging long-term loyalty. P2E games, leveraging blockchain technology, allow users to earn digital assets and real-world rewards, attracting a new segment of players. These monetization strategies provide developers with recurring revenue streams and enhance user retention, positioning them as crucial growth avenues in the evolving gaming landscape.
- For instance, Apple Arcade featured over 200 games as of 2024, while Axie Infinity, a leading P2E game, reached a peak of 2.7 million daily active users in November 2021 and generated over USD 4 billion in NFT transaction volume by early 2022.
Expansion of Mobile eSports Ecosystem
The rapid development of the mobile eSports ecosystem presents considerable growth potential. Competitive mobile games are gaining mainstream acceptance, with professional leagues, tournaments, and live-streaming platforms attracting large audiences. This trend is particularly prominent in Asia-Pacific, where mobile eSports dominate the gaming scene. The expansion of sponsorships, advertising opportunities, and dedicated eSports platforms for mobile gamers is creating new revenue streams and boosting market visibility. This growing ecosystem not only enhances player engagement but also elevates mobile gaming to a professional competitive arena.
- For instance, the PUBG Mobile Global Championship (PMGC) 2023 Grand Finals attracted a peak viewership of 851,308 concurrent viewers, according to Esports Charts, highlighting the expanding scale and global appeal of mobile eSports tournaments.
Key Challenges
High Competition and Market Saturation
The mobile gaming market faces intense competition and increasing saturation, making it challenging for new entrants to gain visibility. Thousands of games are launched each month, leading to fierce rivalry among developers to capture user attention. This crowded environment results in higher marketing costs and shorter product life cycles. Moreover, sustaining user interest in the face of numerous alternatives demands continuous innovation, regular content updates, and substantial investment in user acquisition strategies, posing a significant challenge for developers and publishers.
Monetization and User Retention Difficulties
Achieving consistent monetization and maintaining long-term user retention remain critical hurdles for mobile game developers. While free-to-play games attract large user bases, converting these users into paying customers is challenging due to the low percentage of players who make in-app purchases. Additionally, users can easily abandon games with unsatisfactory experiences, leading to high churn rates. Striking a balance between monetization strategies, such as ads and microtransactions, and delivering a seamless, enjoyable user experience is essential but difficult to achieve in this competitive market.
Regulatory and Data Privacy Constraints
Increasing regulatory scrutiny and data privacy concerns pose substantial challenges for the mobile gaming industry. Governments worldwide are implementing stricter data protection laws and in-game purchase regulations, particularly those targeting minors and preventing addictive behaviors. Compliance with diverse regional regulations, such as the General Data Protection Regulation (GDPR) in Europe and similar frameworks elsewhere, adds operational complexities and limits certain monetization practices. Navigating these legal restrictions while maintaining user trust is a persistent challenge for global mobile gaming companies.
Regional Analysis
North America
North America accounted for approximately 21.2% of the global mobile gaming market share in 2024, with the market size growing from USD 22,365.20 million in 2018 to USD 29,727.39 million in 2024. The region is anticipated to reach USD 64,317.23 million by 2032, expanding at a CAGR of 10.2% during the forecast period. The growth is primarily driven by high smartphone penetration, advanced mobile internet infrastructure, and the widespread popularity of multiplayer and subscription-based games. The United States remains a key contributor, supported by increased consumer spending on premium content and strong adoption of emerging gaming technologies.
Europe
Europe captured 13.3% of the global mobile gaming market share in 2024, with the market size rising from USD 14,491.84 million in 2018 to USD 18,250.41 million in 2024. The market is projected to reach USD 35,403.25 million by 2032, growing at a CAGR of 8.7%. The region benefits from a mature mobile user base, increasing demand for premium gaming experiences, and growing investment in augmented and virtual reality-based mobile games. Countries like Germany, the UK, and France lead market growth, supported by robust digital ecosystems and the increasing popularity of cloud-based mobile gaming platforms.
Asia Pacific
Asia Pacific dominates the mobile gaming market, holding 53.4% of the global market share in 2024. The market expanded from USD 52,927.60 million in 2018 to USD 73,270.00 million in 2024 and is expected to reach USD 166,087.31 million by 2032, growing at the fastest CAGR of 10.8%. The region's growth is driven by massive smartphone adoption, affordable internet access, and a large young population highly engaged in mobile eSports and social gaming. China, Japan, South Korea, and India are the primary revenue contributors, with significant user engagement in both free-to-play and in-app purchase models.
Latin America
Latin America represented 5.1% of the global mobile gaming market share in 2024, with the market size increasing from USD 5,262.40 million in 2018 to USD 7,053.24 million in 2024. The market is forecast to reach USD 13,949.67 million by 2032, advancing at a CAGR of 9.0%. The region’s growth is fueled by rising smartphone accessibility, the popularity of casual and free-to-play games, and increasing social connectivity. Countries such as Brazil and Mexico lead market expansion, supported by improving digital infrastructure and the growing influence of mobile eSports and interactive gaming communities.
Middle East
The Middle East held 3.7% of the global mobile gaming market share in 2024, with the market progressing from USD 4,027.76 million in 2018 to USD 5,132.23 million in 2024. It is expected to reach USD 10,091.11 million by 2032, growing at a CAGR of 8.9%. The region's market growth is driven by increasing smartphone adoption, the rising youth population, and growing demand for Arabic-language mobile games. The Gulf Cooperation Council (GCC) countries, particularly Saudi Arabia and the UAE, are leading this growth, supported by rising investments in the gaming sector and the expansion of mobile eSports platforms.
Africa
Africa accounted for 2.8% of the global mobile gaming market share in 2024, with the market size growing from USD 2,125.20 million in 2018 to USD 3,816.09 million in 2024. The market is anticipated to reach USD 7,776.11 million by 2032, expanding at a CAGR of 9.1% during the forecast period. Market growth in Africa is supported by increasing mobile phone penetration, expanding internet connectivity, and the rising popularity of affordable, lightweight gaming apps. Key growth countries include South Africa, Nigeria, and Kenya, where social and multiplayer gaming formats are gaining popularity among the region’s rapidly growing young population.
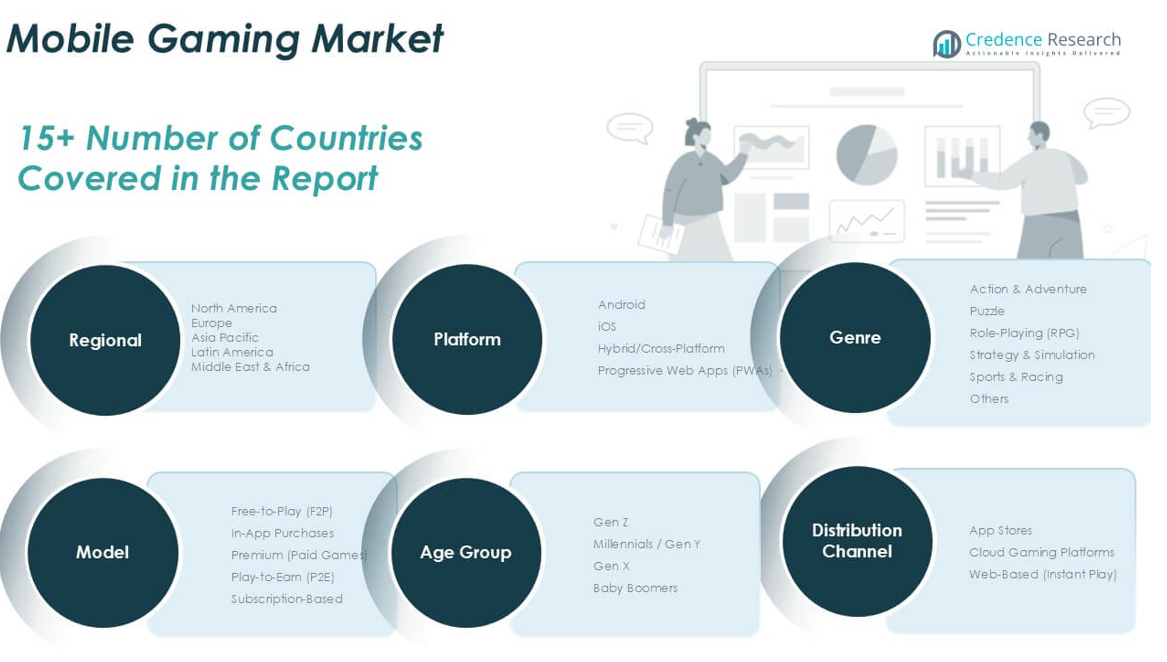
Market Segmentations:
By Platform
- Android
- iOS
- Hybrid/Cross-Platform
- Progressive Web Apps (PWAs)
By Genre
- Action & Adventure
- Puzzle
- Role-Playing (RPG)
- Strategy & Simulation
- Sports & Racing
- Others
By Monetization Model
- Free-to-Play (F2P)
- In-App Purchases
- Premium (Paid Games)
- Play-to-Earn (P2E)
- Subscription-Based
By Age Group
- Gen Z
- Millennials / Gen Y
- Gen X
- Baby Boomers
By Distribution Channel
- App Stores
- Cloud Gaming Platforms
- Web-Based (Instant Play)
By Geography
- North America
- U.S.
- Canada
- Mexico
- Europe
- Germany
- France
- U.K.
- Italy
- Spain
- Rest of Europe
- Asia Pacific
- China
- Japan
- India
- South Korea
- South-east Asia
- Rest of Asia Pacific
- Latin America
- Brazil
- Argentina
- Rest of Latin America
- Middle East & Africa
- GCC Countries
- South Africa
- Rest of the Middle East and Africa
Competitive Landscape
The mobile gaming market is highly competitive, characterized by the presence of several global and regional players striving to enhance their market share through innovation, strategic partnerships, and mergers. Leading companies such as Tencent Holdings Limited, Apple Inc., Google LLC, NetEase Inc., and Activision Blizzard Inc. dominate the landscape, leveraging vast distribution networks and strong content portfolios. These players continuously invest in advanced gaming technologies, including cloud gaming, augmented reality, and blockchain integration, to differentiate their offerings. Smaller developers focus on niche markets and innovative gameplay to gain user traction. The rise of subscription-based gaming services and play-to-earn models has intensified competition, as companies aim to attract and retain loyal users through exclusive content and interactive features. Additionally, the increasing popularity of mobile eSports and multiplayer games is pushing companies to expand their social gaming ecosystems, creating opportunities for further user engagement and sustained revenue growth.
Key Player Analysis
- Tencent Holdings Limited
- Apple Inc.
- Google LLC
- NetEase Inc.
- Activision Blizzard Inc.
- Electronic Arts Inc.
- Nintendo Co., Ltd.
- Roblox Corporation
- Supercell Oy
- Playrix Holding Ltd
- Niantic Inc.
Recent Developments
- In June 2025, At WWDC 2025, Apple introduced a dedicated Games app for iOS, iPadOS, macOS, and Apple TV. This app centralizes gaming experiences, offering features like a launcher, achievement tracking, leaderboards, and social play via the "Play Together" tab. It will be preinstalled on Apple devices later in 2025.
- In March 2025, Scopely acquired Niantic’s gaming division, including Pokémon GO and other AR games, for USD 3.5 billion. The acquisition also includes Niantic’s AR platforms and companion apps, with Niantic spinning off its geospatial technology division into a separate entity, Niantic Spatial. Scopely plans to keep the development teams and long-term game plans intact to ensure continued updates and support for the acquired titles.
- In February 2025, Xsolla partnered with Pocket Gamer Connects (PGC) to support mobile game developers by sponsoring key events in San Francisco, Dubai, Barcelona, Shanghai, and Helsinki. At these conferences, Xsolla will share expertise on direct‑to‑consumer monetization, user acquisition strategies, and cross‑platform analytics. Through its AppsFlyer integration, developers can now track Web Shop purchases as in‑app events, attribute Web Shop revenue to mobile campaigns, and optimize ad spending across platforms without any additional coding.
- In January 2025, Apple Arcade launched ten new titles, including the first licensed PGA TOUR game, Skate City: New York, and FINAL FANTASY+, further strengthening its premium gaming subscription.
- In October 2024, NetEase Games and Marvel have partnered to release a new mobile tactical RPG called Marvel Mystic Mayhem, globally, for iOS and Android devices. The game takes players into the Nightmare Dimension where they can choose teams of three Marvel heroes like Doctor Strange, Scarlet Witch, and Moon Knight to fight against the evil Nightmare. With turn-based battles and class-based strategy, the game is currently available for pre-registration with exclusive milestone rewards.
Market Concentration & Characteristics
The Mobile Gaming Market shows moderate to high market concentration, dominated by a few global leaders such as Tencent Holdings, Apple Inc., Google LLC, and NetEase Inc. These companies control a significant portion of the market through strong brand recognition, extensive content libraries, and advanced technological capabilities. It features rapid product cycles, intense price competition, and strong user demand for innovation. Consumer preferences shift quickly, pushing developers to release frequent updates and new features. The market is highly dynamic, with companies constantly working to improve user engagement through better graphics, multiplayer formats, and immersive experiences. It is also characterized by diverse monetization models, including free-to-play, in-app purchases, subscriptions, and play-to-earn mechanisms. The growing influence of mobile eSports and social gaming further shapes its competitive structure. It benefits from high scalability, as mobile platforms provide developers with immediate global reach. Regulatory oversight regarding data privacy and in-game spending continues to influence market practices. The Mobile Gaming Market remains driven by the need for continuous content innovation and seamless user experiences across devices.
Report Coverage
The research report offers an in-depth analysis based on Platform, Genre, Monetization Model, Age Group, Distribution Channel and Geography. It details leading market players, providing an overview of their business, product offerings, investments, revenue streams, and key applications. Additionally, the report includes insights into the competitive environment, SWOT analysis, current market trends, as well as the primary drivers and constraints. Furthermore, it discusses various factors that have driven market expansion in recent years. The report also explores market dynamics, regulatory scenarios, and technological advancements that are shaping the industry. It assesses the impact of external factors and global economic changes on market growth. Lastly, it provides strategic recommendations for new entrants and established companies to navigate the complexities of the market.
Future Outlook
- The mobile gaming market is expected to witness steady growth driven by increasing smartphone adoption across emerging and developed markets.
- Cloud gaming will become more accessible, reducing the need for high-end devices and expanding the player base.
- Subscription-based gaming services are likely to gain significant traction, offering users exclusive content and ad-free experiences.
- Play-to-earn models and blockchain-based games are anticipated to attract new users seeking financial rewards and digital asset ownership.
- Augmented reality and virtual reality technologies will enhance mobile gaming experiences and increase user engagement.
- Mobile eSports will continue to grow, with expanding tournament ecosystems and rising sponsorship and viewership opportunities.
- Developers will focus on cross-platform integration to offer seamless gaming experiences across mobile, console, and PC devices.
- User data privacy and in-game spending regulations will shape game development and monetization strategies.
- Social and multiplayer games will remain popular as players seek more interactive and community-driven experiences.
- Companies will increasingly adopt artificial intelligence to personalize gaming content and improve player retention.
Request a Free Sample
Fill in your details and we'll send you a free sample report.
- Sample data tables & charts
- Research methodology
Need a Custom Version of This Report?
Tailor the scope, geography, or segments to your exact requirements.
- Custom geography or segment scope
- Direct access to our analyst team
Frequently Asked Questions
What is the current size of the Mobile Gaming Market?
What factors are driving the growth of the Mobile Gaming Market?
What are some challenges faced by the Mobile Gaming Market?
Who are the major players in the Mobile Gaming Market?
Table of Content
Chapter 1. Report Introduction
- 1.1 Report Description & Purpose
- 1.1.1 Report Title & Market Definition
- 1.1.2 Unique Selling Propositions (USP) & Key Differentiators
- 1.1.3 Value Proposition for Stakeholders
- 1.2 Research Objectives
- 1.2.1 Market Sizing Objectives (Volume & Revenue)
- 1.2.2 Segmentation Objectives
- 1.2.3 Competitive Intelligence Objectives
- 1.2.4 Forecast & Scenario Objectives
- 1.3 Report Scope
- 1.3.1 Mobile Gaming Scope – Types & Subtypes Covered
- 1.3.2 Geographic Scope – Regions & Countries Covered
- 1.3.3 Historical Period, Base Year & Forecast Period (2024; forecast to 2032)
- 1.3.4 Inclusions & Exclusions
- 1.4 HS Code & Classification Framework
- 1.5 Currency, Units & Pricing Basis
- 1.6 Target Stakeholders
- 1.7 Limitations & Assumptions
Chapter 2. Executive Summary
- 2.1 Global Mobile Gaming Market Snapshot
- 2.1.1 Market Size – Historical (2024) & Forecast (2024-2032) (2024: USD 137,249.38 million → 2032: USD 297,624.69 million)
- 2.1.2 Volume & Revenue – Global Totals
- 2.1.3 Key Market Highlights – Top Five Facts
- 2.2 Mobile Gaming Market Segmentation Snapshot
- 2.2.1 Market Split by Region – 2024 vs. 2032
- 2.3 Competitive Snapshot
- 2.3.1 Top 10 Players by Revenue Share – 2024
- 2.3.2 Top 10 Players by Volume Share – 2024
- 2.3.3 Recent Strategic Developments (18-Month Summary)
- 2.4 Key Investment Highlights & Strategic Conclusions
Chapter 3. Mobile Gaming Market Dynamics & Industry Analysis
- 3.1 Market Overview & Context
- 3.1.1 Mobile Gaming Market Position in the Broader Automotive Value Chain
- 3.1.2 OEM vs. Replacement Market Dynamics
- 3.1.3 Market Maturity & Development Stage by Region
- 3.2 Mobile Gaming Market Drivers
- 3.3 Mobile Gaming Market Restraints & Challenges
- 3.4 Mobile Gaming Market Opportunities
- 3.5 Porter's Five Forces Analysis
- 3.5.1 Threat of New Entrants
- 3.5.2 Bargaining Power of Suppliers
- 3.5.3 Bargaining Power of Buyers
- 3.5.4 Threat of Substitutes
- 3.5.5 Competitive Rivalry – Intensity Assessment
- 3.6 Mobile Gaming Value Chain Analysis
- 3.6.1 Upstream – Raw Material/Input Suppliers
- 3.6.1.1 Raw Material/Input 1
- 3.6.1.2 Raw Material/Input 2
- 3.6.1.3 Raw Material/Input 3
- 3.6.2 Midstream – Production/Manufacturing/Service Delivery
- 3.6.2.1 Production/Process Overview
- 3.6.2.2 Key Facility Locations & Capacity by Manufacturer
- 3.6.3 Downstream – Distribution & End Consumer
- 3.6.3.1 Primary Channel – B2B/OEM
- 3.6.3.2 Secondary Channels – Dealer, Retail, Online, Direct
- 3.6.4 Value Chain Profitability Analysis
- 3.6.1 Upstream – Raw Material/Input Suppliers
- 3.7 PESTEL Analysis
- 3.7.1 Political Factors
- 3.7.2 Economic Factors
- 3.7.3 Social Factors
- 3.7.4 Technological Factors
- 3.7.5 Environmental Factors
- 3.7.6 Legal Factors
- 3.8 Mobile Gaming Supply Chain Analysis
- 3.8.1 Raw Material/Input Supply Risk Assessment
- 3.8.2 Manufacturing Concentration Risk (Geographic Exposure)
- 3.8.3 Trade Disruption Impact Analysis
- 3.9 Regulatory & Policy Landscape
Note: The regulatory and policy landscape section covers regulations based on their applicability to the market, Mobile Gaming category, geography, and scope of the study. Only regulatory frameworks with a material impact on operations, compliance, trade, sustainability, or market access are analyzed in detail.
Chapter 4. Key Investment Pockets & Opportunity Analysis
- 4.1 Mobile Gaming Market Attractiveness Analysis
- 4.1.1 By Region – Investment Attractiveness Matrix (Volume × CAGR)
- 4.2 Absolute Revenue Growth Opportunity
- 4.2.1 By Region – Absolute USD Growth Through 2032
- 4.3 Incremental Volume Opportunity
- 4.3.1 By Region – Incremental Volume Through 2032
- 4.3.2 Segment – Incremental Volume
- 4.4 Emerging Submarket Opportunity Deep Dive (Subject to Applicability)
- 4.5 Emerging Market Opportunity Scorecards
- 4.5.1 United States
- 4.5.2 Europe
- 4.5.3 Asia
- 4.5.4 Middle East & Africa
Note: Emerging Market Opportunity Scorecards will be included based on relevance and strategic importance. Regions listed are indicative and may vary depending on data availability and market dynamics.
Chapter 5. Mobile Gaming Import-Export Analysis & Trade Flows
- 5.1 Global Trade Overview
- 5.1.1 Global Export Value by Country (2024)
- 5.1.2 Global Export Volume by Country (2024)
- 5.1.3 Global Import Value by Country (2024)
- 5.1.4 Global Import Volume by Country (2024)
- 5.1.5 Net Trade Balance by Country (2024)
- 5.2 Export Analysis – Segment
- 5.2.1 Type 1 (HS Code)
- 5.2.2 Type 2 (HS Code)
- 5.2.3 Type 3 (HS Code)
- 5.2.4 Type 4 (HS Code)
- 5.2.5 Type 5 (HS Code)
- 5.3 Import Analysis – Segment
- 5.3.1 Type 1 (HS Code)
- 5.3.2 Type 2 (HS Code)
- 5.3.3 Type 3 (HS Code)
- 5.3.4 Type 4 (HS Code)
- 5.3.5 Type 5 (HS Code)
- 5.4 Average Unit Trade Prices
- 5.4.1 Average Export Price – Segment & Country
- 5.4.2 Average Import Price – Segment & Source Country
- 5.4.3 Price Trends (2024)
- 5.5 Key Trade Route Analysis
- 5.5.1 Trade Route 1
- 5.5.2 Trade Route 2
- 5.5.3 Trade Route 3
- 5.5.4 Trade Route 4
- 5.5.5 Trade Route 5
- 5.6 Trade Policy Impact Assessment
- 5.6.1 US Anti-Dumping & Section 301 Tariffs
- 5.6.2 EU Customs Union Impact
- 5.6.3 Major Free Trade Agreements
- 5.6.4 USMCA Rules of Origin
Note: Trade policy analysis will be included only where relevant to the Mobile Gaming market.
Chapter 6. Competitive Landscape & Company Benchmarking
- 6.1 Mobile Gaming Market Concentration & Structure
- 6.1.1 Herfindahl-Hirschman Index (HHI) – vs. 2024
- 6.1.2 Tier 1, Tier 2 & Tier 3 Market Structure
- 6.1.3 Global, Regional & Local Player Dynamics
- 6.2 Mobile Gaming Market Share Analysis – 2024
- 6.2.1 Global Revenue Share by Company
- 6.2.2 Global Volume Share by Company
- 6.2.3 Regional Revenue Share
- 6.2.4 Market Share Evolution ( vs. 2024)
- 6.2.5 OEM Segment Share by Company
- 6.2.6 Replacement Segment Share by Company
- 6.3 Production/Delivery Capacity & Facility Analysis
- 6.3.1 Global Installed Capacity
- 6.3.2 Capacity Utilization Rates
- 6.3.3 Production/Output Volume
- 6.3.4 Facility Locations & Capacity Map
- 6.3.5 Planned Capacity Additions
- 6.4 Mobile Gaming Competitive Benchmarking Matrix
- 6.4.1 Revenue, Volume, CAGR & Profitability Comparison
- 6.4.2 Channel Revenue Mix
- 6.4.3 Geographic Revenue Exposure
- 6.4.4 R&D Intensity
- 6.4.5 Sustainability Maturity
- 6.5 Strategic Developments in Mobile Gaming (Last 24 Months)
- 6.5.1 Mergers, Acquisitions & Divestments
- 6.5.2 New Mobile Gaming Launches
- 6.5.3 Facility Expansions
- 6.5.4 Strategic Alliances, Joint Ventures & Partnerships
- 6.5.5 Distribution Expansion & Market Entry
- 6.5.6 Sustainability & ESG Initiatives
- 6.6 Competitive Strategy Mapping
- 6.6.1 Leader, Challenger, Follower & Niche Classification
- 6.6.2 Pricing Strategy Comparison
- 6.6.3 Channel Strategy Matrix
Note: Strategic developments are included based on their materiality and the availability of reliable information.
Chapter 7. Global Mobile Gaming Market – By Distribution Channel
- 7.1 Segment Overview
- 7.1.1 Volume & Revenue Split by Channel (2024 & 2032)
- 7.1.2 Channel Mix Evolution (2024-2032)
Chapter 8. Regional Market Analysis – Global Overview
- 8.1 Global Regional Overview
- 8.1.1 Regional Volume Share
- 8.1.2 Regional Revenue Share
- 8.1.3 Regional Volume by Region
- 8.1.4 Regional Revenue by Region
- 8.1.5 Regional Forecast Through 2032
- 8.2 Cross-Regional Segment Analysis
- 8.2.1 By Distribution Channel
- 8.2.2 By Brand/Price Tier
Chapter 9. North America Mobile Gaming Market
- 9.1 United States
- 9.2 Canada
- 9.3 Mexico
Chapter 10. Europe Mobile Gaming Market
- 10.1 Germany
- 10.2 France
- 10.3 Italy
- 10.4 United Kingdom
- 10.5 Spain
- 10.6 Poland
- 10.7 Russia
- 10.8 Netherlands
- 10.9 Belgium
- 10.10 Sweden
- 10.11 Denmark
- 10.12 Norway
- 10.13 Rest of Europe
Chapter 11. Asia Pacific Mobile Gaming Market
- 11.1 China
- 11.2 India
- 11.3 Japan
- 11.4 South Korea
- 11.5 Thailand
- 11.6 Indonesia
- 11.7 Vietnam
- 11.8 Malaysia
- 11.9 Australia
- 11.10 Rest of Asia Pacific
Chapter 12. Latin America Mobile Gaming Market
- 12.1 Brazil
- 12.2 Argentina
- 12.3 Colombia
- 12.4 Chile
- 12.5 Rest of Latin America
Chapter 13. Middle East Mobile Gaming Market
- 13.1 Saudi Arabia
- 13.2 United Arab Emirates
- 13.3 Turkey
- 13.4 Israel
- 13.5 Iran
- 13.6 Rest of the Middle East
Chapter 14. Africa Mobile Gaming Market
- 14.1 South Africa
- 14.2 Egypt
- 14.3 Nigeria
- 14.4 Morocco
- 14.5 Rest of Africa
Chapter 15. Mobile Gaming Company Profiles
- 15.1 [Company 01]
- 15.1.1 Company Overview
- 15.1.2 Key Management Personnel
- 15.1.3 Products & Services Portfolio
- 15.1.4 Financial Performance
- 15.1.5 Key Market Focus & Geographic Presence
- 15.1.6 Recent Developments & Strategic Initiatives
Note: The company profile list is preliminary and may change based on research findings, market developments, data availability, and client requirements.
Chapter 16. Appendices
- Appendix A – List of Abbreviations & Acronyms
- Appendix B – Industry Classification Code Reference – Full Series
- Appendix C – Production & Capacity Data Tables
- Appendix D – End-Use & Demand Base Tables
- Appendix E – Consumption & Replacement Rate Assumptions
- Appendix F – ASP Reference Tables
- Appendix G – Manufacturing & Facility Database
- Appendix H – Import-Export Data Tables
- Appendix I – Regulatory Summary Tables
- Appendix J – Primary Research Participant List (Anonymized)
- Appendix K – Primary Research Questionnaire Framework
- Appendix L – Data Sources & Bibliography
- Appendix M – Market Size Divergence & Source Comparison
Chapter 17. Research Methodology
- 17.1 Research Framework & Philosophy
- 17.2 Secondary Research – Sources, Hierarchy & Data Extraction
- 17.3 Data Modeling – Bottom-Up & Top-Down Market Sizing
- 17.4 Primary Research – Stakeholder Framework, LOI & Sample Sizes
- 17.5 Forecast Methodology – Regression, Scenario & Sensitivity Analysis
- 17.6 Quality Control – Four-Layer Validation Framework
- 17.7 Limitations & Standard Assumptions
- 17.8 Disclaimer
