
| REPORT ATTRIBUTE | DETAILS |
|---|---|
| Historical Period | 2019-2022 |
| Base Year | 2023 |
| Forecast Period | 2024-2032 |
| Refurbished Smartphone Market Size 2024 | USD 80,421.5 million |
| Refurbished Smartphone Market, CAGR | 12.7% |
| Refurbished Smartphone Market Size 2032 | USD 28,898.92 million |
Market Overview
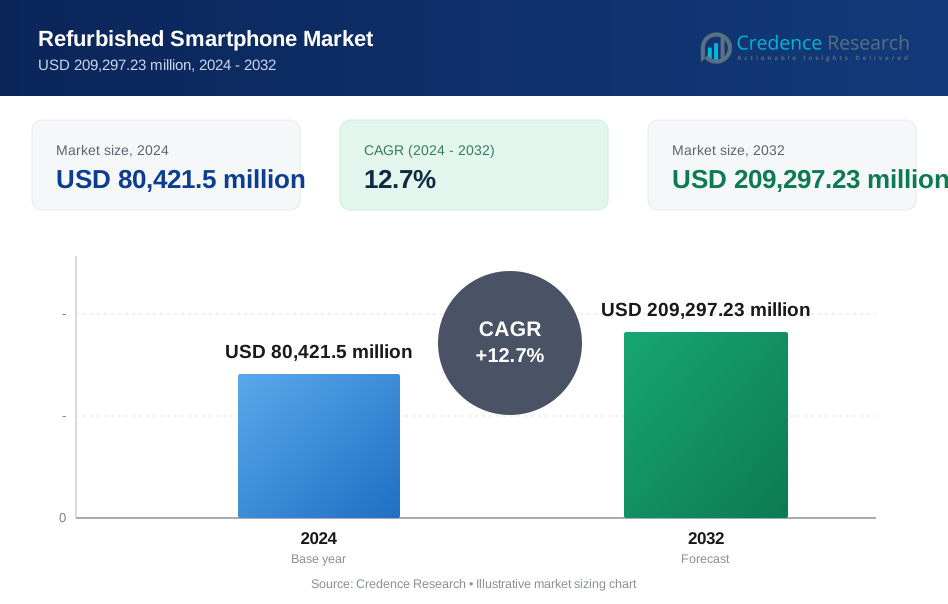
The refurbished smartphone market is expected to grow from USD 80,421.5 million in 2024 to USD 209,297.23 million by 2032, at a compound annual growth rate (CAGR) of 12.7%.
The refurbished smartphone market is driven by increasing consumer demand for affordable yet high-quality devices, as well as growing environmental awareness, which promotes sustainable electronics consumption. Technological advancements, such as improved refurbishing processes and warranty offerings, enhance product reliability, further boosting market growth. Additionally, rising smartphone adoption in emerging markets and the shift towards e-commerce platforms contribute to market expansion. The trend of eco-conscious purchasing, coupled with the rising popularity of trade-in programs, supports the growth of the refurbished smartphone sector, making it a significant player in the global mobile device market.
The refurbished smartphone market is experiencing growth across various regions, with North America and Asia Pacific leading in demand. In North America, key players such as Amazon Renewed, Gazelle, and Best Buy Outlet drive market expansion through trusted e-commerce platforms and trade-in programs. In Asia Pacific, companies like Back Market and Swappa are gaining popularity, capitalizing on the cost-sensitive consumer base and the growing trend of sustainable purchasing. Other significant players like Apple Certified Refurbished, Samsung Certified Pre-Owned, and Decluttr are making their mark globally, offering certified products and warranties to enhance consumer trust.
Market Drivers
Growing Online Marketplaces
The rise of online marketplaces has greatly expanded access to refurbished smartphones, providing consumers with convenience and choice. E-commerce platforms allow users to easily browse, compare, and purchase refurbished phones from the comfort of their homes. These platforms often provide transparent information about the refurbishment process, further building customer trust. For instance, the launch of Amazon Renewed has made it easier for consumers to access refurbished smartphones with detailed product descriptions and guarantees. As online retail continues to grow, the refurbished smartphone market benefits from increased visibility and accessibility to a broader consumer base.
Environmental Sustainability
The growing emphasis on environmental sustainability plays a key role in the refurbished smartphone market. Consumers who opt for refurbished devices contribute to the reduction of electronic waste, thus helping to minimize the environmental impact of the tech industry. Refurbishing extends the lifespan of existing devices, fostering a more sustainable approach to consumer electronics. For instance, a report by the United Nations University found that extending the life of smartphones by just one year can save as much CO2 emissions as taking two million cars off the road annually. This trend aligns with global efforts to reduce e-waste and encourages a shift toward more eco-conscious consumption patterns.
Cost-Effectiveness
Refurbished smartphones provide a budget-friendly alternative to new devices, attracting cost-conscious consumers seeking quality at a lower price. These phones undergo rigorous testing and refurbishing processes, ensuring they deliver high performance and features comparable to brand-new models. By offering significant savings without sacrificing functionality, refurbished smartphones present an appealing solution for those wanting premium features at a fraction of the cost, making them a popular choice in today’s price-sensitive market.
Increased Consumer Trust
Increased consumer trust is another significant driver of the refurbished smartphone market. Reputable refurbishers follow strict quality control standards, ensuring that refurbished devices meet high performance and reliability benchmarks. Additionally, many refurbished smartphones come with warranties, offering customers peace of mind. These reassurances help mitigate concerns about buying second-hand devices, making refurbished smartphones a more trusted and viable option for a growing number of consumers.
Market Trends
Growing Focus on Quality, Affordability, and Consumer Trust
The refurbished smartphone market benefits from increasing consumer awareness around quality and cost-effectiveness. Reputable refurbishers are implementing stringent quality control measures to ensure that refurbished devices meet high performance and reliability standards, thus reducing skepticism about their durability. For instance, Pro QC International outlines a comprehensive quality control checklist that includes functional and performance tests to ensure refurbished smartphones meet high standards. Additionally, many refurbished phones come with warranties, offering consumers peace of mind and boosting trust in the products. As consumers seek budget-friendly alternatives, refurbished devices provide significant savings compared to new models, enabling access to premium features at a fraction of the price. This balance of high-quality, low-cost options has made refurbished smartphones an attractive choice for cost-conscious buyers. With the rise in online marketplaces, consumers now have easy access to a wide selection of refurbished phones. Online platforms also offer transparency, detailing the refurbishment process to build further trust and provide a sense of security for potential buyers.
Environmental Sustainability and Evolving Consumer Preferences
Environmental sustainability is another driving force behind the growing demand for refurbished smartphones. As electronic waste continues to rise, refurbishment helps reduce e-waste by extending the lifespan of devices, fostering a more sustainable approach to consumer electronics. This eco-conscious trend appeals to environmentally aware consumers, many of whom prefer to purchase refurbished devices to support sustainable consumption. Brands are also capitalizing on the eco-friendly image of refurbished phones to attract this demographic. Furthermore, as consumers prioritize brands they trust, many are willing to invest in refurbished models from well-known manufacturers. Some companies offer loyalty programs and discounts, further boosting brand preference and encouraging repeat purchases. The evolving consumer preference for environmentally conscious and high-value purchases has spurred significant growth in the refurbished smartphone market, making it a key player in the global electronics sector.
Market Challenges Analysis
Perception, Data Privacy, and Consumer Education Challenges
One of the key challenges facing the refurbished smartphone market is the persistent negative perception of quality. Some consumers associate refurbished devices with lower quality or potential defects, making them hesitant to consider such products. The lack of standardized grading systems for refurbished devices further exacerbates this issue, leading to confusion and inconsistency in product offerings. In addition, data privacy concerns present a significant barrier, as consumers worry about residual personal data left on refurbished devices. Ensuring complete data erasure requires specialized techniques, which can be costly and complex for refurbishers to implement. This challenge is compounded by a lack of consumer awareness, as many buyers remain unfamiliar with the benefits and reliability of refurbished smartphones. Misinformation or misleading reviews can further hinder market growth by reinforcing misconceptions, thereby reducing potential customer interest in refurbished models.
Warranty, Supply Chain, and Regulatory Obstacles
Refurbished smartphones often come with shorter warranty periods compared to new devices, which may deter some consumers who value the security of long-term support. For example, Cashify offers up to six-month warranty periods for refurbished phones, which is shorter than the typical one-year warranty for new devices. Additionally, fewer service centers are available for refurbished models, making repairs and replacements less convenient for customers. Supply chain challenges also pose difficulties for refurbishers, as sourcing high-quality replacement parts especially for older models can be a complex and costly process. Efficient inventory management is also crucial for maintaining a steady supply of refurbished devices, which can be difficult to achieve. Regulatory hurdles such as import and export restrictions can impact pricing and availability by imposing tariffs or compliance costs, further complicating the logistics of refurbishment. Moreover, adhering to e-waste regulations is often both complex and expensive for large-scale refurbishers, adding to the operational challenges in this sector. These combined issues create significant barriers to the growth and consumer adoption of refurbished smartphones.
Market Segmentation Analysis:
By Product Type:
The refurbished smartphone market is divided into several key product types, each catering to different consumer needs and preferences. Refurbished Smartphones, which are typically refurbished by manufacturers or third-party refurbishers, form the largest segment. These devices undergo thorough testing and restoration processes, ensuring that they meet performance standards comparable to new models. The Company Owned category refers to devices refurbished and resold by manufacturers or major retailers, often with warranties and certifications. Consumer Owned devices, on the other hand, are refurbished by individuals or smaller refurbishers, usually sold through secondary markets. Used Smartphones are pre-owned devices that may not undergo extensive refurbishment, representing a more affordable, though riskier, option. Trade-ins and Buyback programs offer consumers the opportunity to return old smartphones in exchange for refurbished models or credit toward new purchases, further enhancing market growth and offering cost-effective alternatives to new phones.
By Application:
The refurbished smartphone market also sees segmentation based on application, with distinct demand patterns from Individual Users and Businesses. Individual consumers are typically motivated by affordability and environmental concerns, often seeking refurbished devices as a cost-effective alternative to new models. This segment includes students, budget-conscious buyers, and eco-conscious consumers who prefer purchasing sustainable products. On the other hand, businesses often purchase refurbished smartphones in bulk for employee use, favoring the economic benefits and reliability of certified refurbishers. Enterprises may also seek refurbished devices as part of their corporate sustainability initiatives, reducing e-waste while maintaining operational efficiency. This segment’s demand is driven by cost-saving objectives, environmental responsibility, and the desire for reliable devices without the high costs of new smartphones.
Segments:
Based on Product Type:
- Refurbished Smartphones
- Company Owned
- Consumer Owned
- Used Smartphones
- Trade-ins
- Buyback
Based on Application:
- Individual User
- Businesses
Based on Sales Channel:
- Thrift Stores/Resale Stores
- Online Market Places
- Other Channels
Based on the Geography:
- North America
- U.S.
- Canada
- Mexico
- Europe
- Germany
- France
- U.K.
- Italy
- Spain
- Rest of Europe
- Asia Pacific
- China
- Japan
- India
- South Korea
- South-east Asia
- Rest of Asia Pacific
- Latin America
- Brazil
- Argentina
- Rest of Latin America
- Middle East & Africa
- GCC Countries
- South Africa
- Rest of the Middle East and Africa
Regional Analysis
North America
North America dominates the refurbished smartphone market, holding a significant market share of approximately 35%. The region’s strong market position can be attributed to the high adoption rate of smartphones, a well-established e-commerce infrastructure, and an increasing consumer focus on sustainability. The United States, in particular, is a key player in driving the demand for refurbished devices, with both individuals and businesses recognizing the economic and environmental benefits of purchasing refurbished smartphones. Programs such as trade-ins, buybacks, and manufacturer-led refurbishing initiatives have gained popularity, particularly among budget-conscious consumers and environmentally conscious buyers. Furthermore, North American consumers show a high level of trust in the quality and reliability of refurbished devices, largely due to the stringent refurbishment processes and warranties provided by established refurbishers. The region’s growing interest in sustainable electronics and efforts to reduce e-waste further contribute to the demand for refurbished smartphones. Major e-commerce platforms, alongside specialized refurbishers, ensure easy access to these devices, strengthening their presence in the market.
Asia-Pacific
The Asia Pacific region is expected to witness rapid growth in the refurbished smartphone market, with its market share projected to reach approximately 30%. The demand for refurbished smartphones in this region is fueled by the high smartphone penetration rate, particularly in countries like India, China, and Southeast Asian markets. Cost-sensitive consumers in these regions are increasingly turning to refurbished devices as a more affordable option to access modern smartphone technology. In addition, the rise of online platforms and the expansion of trade-in programs have made refurbished phones more accessible. Furthermore, businesses in Asia Pacific are increasingly adopting refurbished smartphones as part of their corporate sustainability initiatives and to reduce operational costs. The region also faces increasing electronic waste challenges, and refurbishment helps mitigate the environmental impact by extending the lifecycle of devices. As consumer education and awareness about the quality of refurbished smartphones grow, Asia Pacific is poised to become a leading market for these devices.
Key Player Analysis
- MusicMagpie
- Gazelle
- Best Buy Outlet
- Back Market
- Swappa
- Apple Certified Refurbished
- Quick Mobile Fix
- Decluttr
- Glyde
- Samsung Certified Pre-Owned
- Blinq
- GameStop
- BuyBackWorld
- Amazon Renewed
Competitive Analysis
The refurbished smartphone market is competitive, with key players such as Amazon Renewed, Gazelle, Best Buy Outlet, Back Market, Apple Certified Refurbished, Samsung Certified Pre-Owned, Swappa, Decluttr, BuyBackWorld, GameStop, Blinq, Quick Mobile Fix, and MusicMagpie offering a variety of products and services. Companies in this space differentiate themselves by offering certified quality, warranties, and competitive pricing to build consumer trust. Some focus on providing a broad range of affordable, refurbished models with transparency in the refurbishment process, ensuring customers are informed about the quality and history of the devices. Others leverage brand loyalty by offering manufacturer-backed refurbished phones, which come with guarantees and high-quality assurance. User-friendly online platforms that facilitate easy purchasing and selling of refurbished phones are also gaining popularity. Furthermore, many companies emphasize environmental sustainability by promoting e-waste reduction, appealing to eco-conscious buyers. As the market grows, differentiation in customer service, product quality, and pricing strategies will remain key factors in driving consumer choice and fostering brand loyalty.
Recent Developments
- In March 2024, Orange Belgium launched a new webshop for refurbished smartphones in partnership with Recommerce. The company provides a 2-year warranty on its products. It aims to reduce CO2 emissions.
- In August 2023, ReFit Global launched an online marketplace for refurbished smartphones. The company sells its products at an astounding 50% lower prices.
- In November 2023, Cashify launched a new campaign in India featuring Bollywood star Rajkummar Rao. The campaign emphasizes that refurbished smartphones offer a smart and budget-friendly solution for consumers looking to upgrade to their dream phone. By highlighting the value and affordability of refurbished devices, the campaign aims to encourage consumers to make sustainable and cost-effective choices without compromising on quality.
- In September 2022, fairphone, a Dutch social enterprise creating a market for ethical smartphones, began selling refurbished smartphones, the fairphone 3, New Life Edition, through its website to encourage smartphone longevity, reduce e-waste, and conserve precious resources.
Market Concentration & Characteristics
Leading companies dominate the market share, offering a broad range of certified devices and establishing trust with consumers through warranties and quality guarantees. However, the market also sees participation from smaller refurbishers, online marketplaces, and trade-in platforms, creating a dynamic competitive landscape. Key characteristics of the market include high price sensitivity, with consumers seeking affordable alternatives to new smartphones while ensuring quality and reliability. Sustainability plays a significant role, as many consumers are motivated by eco-friendly considerations, contributing to the growing popularity of refurbished devices. The market is also characterized by increased online transactions, with platforms offering transparent refurbishment processes and easy access to a wide variety of models. Additionally, advancements in refurbishment technology and quality control processes continue to improve consumer confidence, further driving growth in the market.
Report Coverage
The research report offers an in-depth analysis based on Product Type, Application, Sales Channel and Geography. It details leading market players, providing an overview of their business, product offerings, investments, revenue streams, and key applications. Additionally, the report includes insights into the competitive environment, SWOT analysis, current market trends, as well as the primary drivers and constraints. Furthermore, it discusses various factors that have driven market expansion in recent years. The report also explores market dynamics, regulatory scenarios, and technological advancements that are shaping the industry. It assesses the impact of external factors and global economic changes on market growth. Lastly, it provides strategic recommendations for new entrants and established companies to navigate the complexities of the market.
Future Outlook
- The demand for refurbished smartphones is expected to grow steadily due to increased consumer awareness of cost savings and sustainability.
- Technological advancements in refurbishment processes will enhance the quality and reliability of refurbished devices.
- The market will witness expanded consumer trust as warranties and certified refurbishing standards become more common.
- E-commerce platforms will continue to dominate the distribution of refurbished smartphones, offering ease of access and convenience.
- The growing trend of environmental consciousness will drive more consumers to choose refurbished phones over new ones.
- Increased government regulations regarding e-waste management will encourage refurbishment as a sustainable solution.
- Major smartphone manufacturers may further embrace the refurbished market, offering brand-specific certified pre-owned devices.
- The rise of trade-in and buyback programs will continue to fuel the availability of high-quality refurbished smartphones.
- The expansion of refurbished smartphone markets in emerging economies will contribute to global market growth.
- Consumer preferences will shift towards premium brands in the refurbished smartphone segment, driven by affordability and quality.
Request a Free Sample
Fill in your details and we'll send you a free sample report.
- Sample data tables & charts
- Research methodology
Need a Custom Version of This Report?
Tailor the scope, geography, or segments to your exact requirements.
- Custom geography or segment scope
- Direct access to our analyst team
Frequently Asked Questions
What is the current size of the Refurbished Smartphone market?
What factors are driving the growth of the Refurbished Smartphone market?
What are the key segments within the Refurbished Smartphone market?
What are some challenges faced by the Refurbished Smartphone market?
Who are the major players in the Refurbished Smartphone market?
Table of Content
Chapter 1. Report Introduction
- 1.1 Report Description & Purpose
- 1.1.1 Report Title & Market Definition
- 1.1.2 Unique Selling Propositions (USP) & Key Differentiators
- 1.1.3 Value Proposition for Stakeholders
- 1.2 Research Objectives
- 1.2.1 Market Sizing Objectives (Volume & Revenue) (Volume Where Applicable)
- 1.2.2 Segmentation Objectives
- 1.2.3 Competitive Intelligence Objectives
- 1.2.4 Forecast & Scenario Objectives
- 1.3 Report Scope
- 1.3.1 Refurbished Smartphone Scope – Segments & Subsegments Covered
- 1.3.2 Geographic Scope – Regions & Countries Covered
- 1.3.3 Historical Period, Base Year & Forecast Period (2024; forecast to 2032)
- 1.3.4 Inclusions & Exclusions
- 1.4 Industry Classification & Applicable Codes
- 1.5 Currency, Measurement Units & Valuation Basis
- 1.6 Target Stakeholders
- 1.7 Limitations & Assumptions
Chapter 2. Executive Summary
- 2.1 Global Refurbished Smartphone Market Snapshot
- 2.1.1 Market Size – Historical (2024) & Forecast (2024-2032) (2024: USD 80,421.5 million → 2032: USD 209,297.23 million)
- 2.1.2 Volume & Revenue – Global Totals (Volume Where Applicable)
- 2.1.3 Key Market Highlights – Top Five Facts
- 2.2 Refurbished Smartphone Market Segmentation Snapshot
- 2.2.1 Market Split by Region – 2024 vs. 2032
- 2.3 Competitive Snapshot
- 2.3.1 Top 10 Players by Revenue Share – 2024
- 2.3.2 Top 10 Players by Volume Share – 2024 (Volume Where Applicable)
- 2.3.3 Recent Strategic Developments (18-Month Summary)
- 2.4 Key Investment Highlights & Strategic Conclusions
Chapter 3. Refurbished Smartphone Market Dynamics & Industry Analysis
- 3.1 Market Overview & Context
- 3.1.1 Refurbished Smartphone Market Position in the Broader Industry Value Chain
- 3.1.2 Demand Structure & Purchasing Dynamics
- 3.1.3 Market Maturity & Development Stage by Region
- 3.2 Refurbished Smartphone Market Drivers
- 3.3 Refurbished Smartphone Market Restraints & Challenges
- 3.4 Refurbished Smartphone Market Opportunities
- 3.5 Porter's Five Forces Analysis
- 3.5.1 Threat of New Entrants
- 3.5.2 Bargaining Power of Suppliers
- 3.5.3 Bargaining Power of Buyers
- 3.5.4 Threat of Substitutes
- 3.5.5 Competitive Rivalry – Intensity Assessment
- 3.6 Refurbished Smartphone Value Chain Analysis
- 3.6.1 Upstream – Key Inputs, Resources & Suppliers
- 3.6.1.1 Key Input/Resource 1
- 3.6.1.2 Key Input/Resource 2
- 3.6.1.3 Key Input/Resource 3
- 3.6.2 Midstream – Core Operations & Value Creation
- 3.6.2.1 Operating Model & Process Overview
- 3.6.2.2 Key Operating Locations & Capabilities by Company
- 3.6.3 Downstream – Market Channels & End Users
- 3.6.3.1 Direct Sales & Customer Engagement Channels
- 3.6.3.2 Indirect Sales, Intermediaries & Partner Channels
- 3.6.4 Value Chain Profitability Analysis
- 3.6.1 Upstream – Key Inputs, Resources & Suppliers
- 3.7 PESTEL Analysis
- 3.7.1 Political Factors
- 3.7.2 Economic Factors
- 3.7.3 Social Factors
- 3.7.4 Technological Factors
- 3.7.5 Environmental Factors
- 3.7.6 Legal Factors
- 3.8 Refurbished Smartphone Supply Chain Analysis
- 3.8.1 Critical Input & Resource Availability Risk Assessment
- 3.8.2 Supplier & Operational Concentration Risk (Geographic Exposure)
- 3.8.3 Supply & Service Disruption Impact Analysis
- 3.9 Regulatory & Policy Landscape
Note: The regulatory and policy landscape section covers regulations based on their applicability to the market, Refurbished Smartphone category, geography, and scope of the study. Only regulatory frameworks with a material impact on operations, compliance, trade, sustainability, or market access are analyzed in detail.
Chapter 4. Key Investment Pockets & Opportunity Analysis
- 4.1 Refurbished Smartphone Market Attractiveness Analysis
- 4.1.1 By Region – Investment Attractiveness Matrix (Market Size × CAGR)
- 4.2 Absolute Revenue Growth Opportunity
- 4.2.1 By Region – Absolute Revenue Growth Through 2032
- 4.3 Incremental Demand Opportunity
- 4.3.1 By Region – Incremental Demand Through 2032
- 4.3.2 Segment – Incremental Demand
- 4.4 Emerging Submarket Opportunity Deep Dive (Subject to Applicability)
- 4.5 Priority Market Opportunity Scorecards
- 4.5.1 United States
- 4.5.2 Europe
- 4.5.3 Asia
- 4.5.4 Middle East & Africa
Note: Priority market opportunity scorecards reflect the geographic scope and strategic relevance of the study. Listed markets are indicative and may be adapted to the industry.
Chapter 5. Refurbished Smartphone Cross-Border Trade & Market Access Analysis
- 5.1 International Trade & Cross-Border Activity Overview
- 5.1.1 Global Export Value by Country (2024)
- 5.1.2 Global Export Volume by Country (2024) (Volume Where Applicable)
- 5.1.3 Global Import Value by Country (2024)
- 5.1.4 Global Import Volume by Country (2024) (Volume Where Applicable)
- 5.1.5 Net Trade Balance by Country (2024)
- 5.2 Export Analysis – Segment
- 5.2.1 Category 1 (Applicable Classification Code)
- 5.2.2 Category 2 (Applicable Classification Code)
- 5.2.3 Category 3 (Applicable Classification Code)
- 5.2.4 Category 4 (Applicable Classification Code)
- 5.2.5 Category 5 (Applicable Classification Code)
- 5.3 Import Analysis – Segment
- 5.3.1 Category 1 (Applicable Classification Code)
- 5.3.2 Category 2 (Applicable Classification Code)
- 5.3.3 Category 3 (Applicable Classification Code)
- 5.3.4 Category 4 (Applicable Classification Code)
- 5.3.5 Category 5 (Applicable Classification Code)
- 5.4 Cross-Border Pricing & Transaction Benchmarks
- 5.4.1 Export Pricing – Segment & Country
- 5.4.2 Import Pricing – Segment & Source Country
- 5.4.3 Price Trends (2024)
- 5.5 Key Cross-Border Trade & Delivery Routes
- 5.5.1 Cross-Border Trade/Delivery Route 1
- 5.5.2 Cross-Border Trade/Delivery Route 2
- 5.5.3 Cross-Border Trade/Delivery Route 3
- 5.5.4 Cross-Border Trade/Delivery Route 4
- 5.5.5 Cross-Border Trade/Delivery Route 5
- 5.6 Trade Policy & Market Access Impact Assessment
- 5.6.1 Tariff & Non-Tariff Barriers
- 5.6.2 Regional Trade & Economic Integration Frameworks
- 5.6.3 Bilateral & Multilateral Trade Agreements
- 5.6.4 Cross-Border Operating, Licensing & Localization Requirements
Note: This chapter applies where cross-border trade or delivery is relevant to Refurbished Smartphone. Goods, services, and digital offerings are assessed using applicable classifications and transaction measures. Import-export volumes, trade balances, and route analyses are included only where meaningful to the market.
Chapter 6. Competitive Landscape & Company Benchmarking
- 6.1 Refurbished Smartphone Market Concentration & Structure
- 6.1.1 Herfindahl-Hirschman Index (HHI) – the historical period vs. 2024
- 6.1.2 Leading, Mid-Sized & Emerging Player Structure
- 6.1.3 Global, Regional & Local Player Dynamics
- 6.2 Refurbished Smartphone Market Share Analysis – 2024
- 6.2.1 Global Revenue Share by Company
- 6.2.2 Global Volume Share by Company (Volume Where Applicable)
- 6.2.3 Regional Revenue Share
- 6.2.4 Market Share Evolution (the historical period vs. 2024)
- 6.2.5 Company Market Share by Key Segment
- 6.2.6 Company Market Share by Customer Group
- 6.3 Operating Scale, Capacity & Infrastructure Analysis
- 6.3.1 Global Operating Scale & Supply Capacity
- 6.3.2 Resource Utilization & Operating Efficiency
- 6.3.3 Output, Service Delivery & Activity Metrics
- 6.3.4 Operating Footprint & Infrastructure Map
- 6.3.5 Planned Operational & Capacity Expansion
- 6.4 Refurbished Smartphone Competitive Benchmarking Matrix
- 6.4.1 Revenue, Growth, Profitability & Operating Metric Comparison
- 6.4.2 Channel Revenue Mix
- 6.4.3 Geographic Revenue Exposure
- 6.4.4 R&D Intensity
- 6.4.5 Sustainability Maturity
- 6.5 Strategic Developments in Refurbished Smartphone (Last 24 Months)
- 6.5.1 Mergers, Acquisitions & Divestments
- 6.5.2 New Products, Services & Solutions in Refurbished Smartphone
- 6.5.3 Operational & Infrastructure Expansions
- 6.5.4 Strategic Alliances, Joint Ventures & Partnerships
- 6.5.5 Distribution Expansion & Market Entry
- 6.5.6 Sustainability & ESG Initiatives
- 6.6 Competitive Strategy Mapping
- 6.6.1 Leader, Challenger, Follower & Niche Classification
- 6.6.2 Pricing Strategy Comparison
- 6.6.3 Channel Strategy Matrix
Note: Strategic developments are included based on their materiality and the availability of reliable information.
Chapter 7. Global Refurbished Smartphone Market – By Sales & Delivery Channel
- 7.1 Segment Overview
- 7.1.1 Volume & Revenue Split by Channel (2024 & 2032) (Volume Where Applicable)
- 7.1.2 Channel Mix Evolution (2024-2032)
Chapter 8. Regional Market Analysis – Global Overview
- 8.1 Global Regional Overview
- 8.1.1 Regional Volume Share (Volume Where Applicable)
- 8.1.2 Regional Revenue Share
- 8.1.3 Regional Volume by Region (Volume Where Applicable)
- 8.1.4 Regional Revenue by Region
- 8.1.5 Regional Forecast Through 2032
- 8.2 Cross-Regional Segment Analysis
- 8.2.1 By Sales & Delivery Channel
- 8.2.2 By Competitive Positioning & Price Tier
Chapter 9. North America Refurbished Smartphone Market
- 9.1 United States
- 9.2 Canada
- 9.3 Mexico
Chapter 10. Europe Refurbished Smartphone Market
- 10.1 Germany
- 10.2 France
- 10.3 Italy
- 10.4 United Kingdom
- 10.5 Spain
- 10.6 Poland
- 10.7 Russia
- 10.8 Netherlands
- 10.9 Belgium
- 10.10 Sweden
- 10.11 Denmark
- 10.12 Norway
- 10.13 Rest of Europe
Chapter 11. Asia Pacific Refurbished Smartphone Market
- 11.1 China
- 11.2 India
- 11.3 Japan
- 11.4 South Korea
- 11.5 Thailand
- 11.6 Indonesia
- 11.7 Vietnam
- 11.8 Malaysia
- 11.9 Australia
- 11.10 Rest of Asia Pacific
Chapter 12. Latin America Refurbished Smartphone Market
- 12.1 Brazil
- 12.2 Argentina
- 12.3 Colombia
- 12.4 Chile
- 12.5 Rest of Latin America
Chapter 13. Middle East Refurbished Smartphone Market
- 13.1 Saudi Arabia
- 13.2 United Arab Emirates
- 13.3 Turkey
- 13.4 Israel
- 13.5 Iran
- 13.6 Rest of the Middle East
Chapter 14. Africa Refurbished Smartphone Market
- 14.1 South Africa
- 14.2 Egypt
- 14.3 Nigeria
- 14.4 Morocco
- 14.5 Rest of Africa
Chapter 15. Refurbished Smartphone Company Profiles
- 15.1 [Company 01]
- 15.1.1 Company Overview
- 15.1.2 Key Management Personnel
- 15.1.3 Products & Services Portfolio
- 15.1.4 Financial Performance
- 15.1.5 Key Market Focus & Geographic Presence
- 15.1.6 Recent Developments & Strategic Initiatives
Note: The company profile list is preliminary and may change based on research findings, market developments, data availability, and client requirements.
Chapter 16. Appendices
- Appendix A – List of Abbreviations & Acronyms
- Appendix B – Industry Classification Code Reference – Full Series
- Appendix C – Supply, Output & Operating Capacity Data Tables
- Appendix D – End-Use & Demand Base Tables
- Appendix E – Demand, Adoption & Usage Assumptions
- Appendix F – Pricing & Revenue Metric Reference Tables
- Appendix G – Company Operations & Infrastructure Database
- Appendix H – Cross-Border Trade & Activity Data Tables (Where Applicable)
- Appendix I – Regulatory Summary Tables
- Appendix J – Primary Research Participant List (Anonymized)
- Appendix K – Primary Research Questionnaire Framework
- Appendix L – Data Sources & Bibliography
- Appendix M – Market Size Divergence & Source Comparison
Chapter 17. Research Methodology
- 17.1 Research Framework & Philosophy
- 17.2 Secondary Research – Sources, Hierarchy & Data Extraction
- 17.3 Data Modeling – Bottom-Up & Top-Down Market Sizing
- 17.4 Primary Research – Stakeholder Framework, LOI & Sample Sizes
- 17.5 Forecast Methodology – Regression, Scenario & Sensitivity Analysis
- 17.6 Quality Control – Four-Layer Validation Framework
- 17.7 Limitations & Standard Assumptions
- 17.8 Disclaimer
