Market Overview
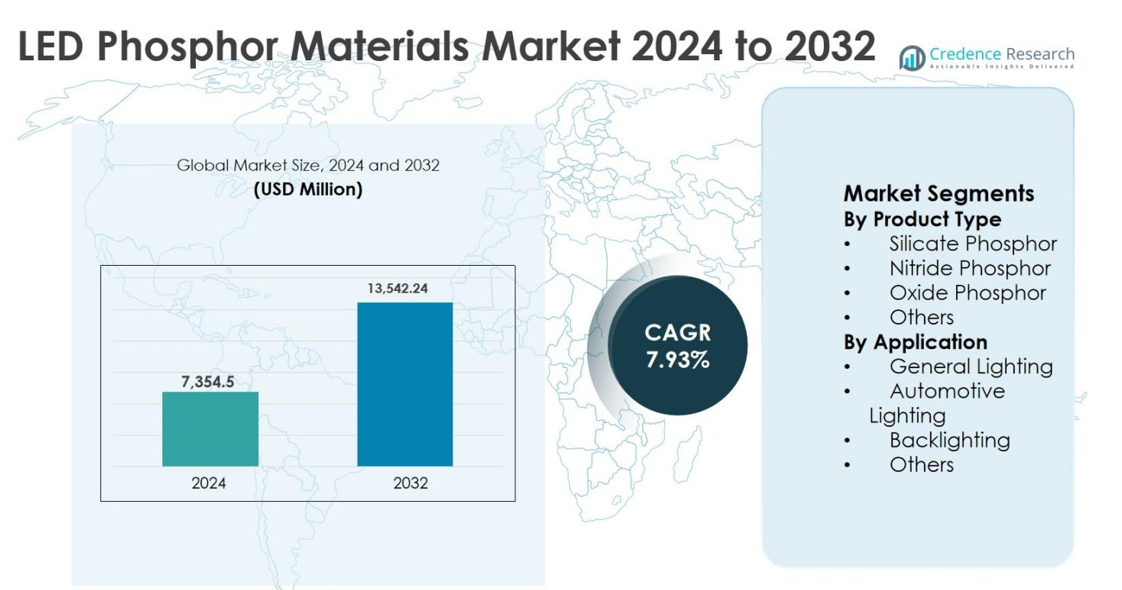
The LED phosphor materials market size was valued at USD 7,354.5 million in 2024 and is anticipated to reach USD 13,542.24 million by 2032, growing at a CAGR of 7.93% during the forecast period.
| REPORT ATTRIBUTE |
DETAILS |
| Historical Period |
2020-2023 |
| Base Year |
2024 |
| Forecast Period |
2025-2032 |
| LED Phosphor Materials Market Size 2024 |
USD 7,354.5 million |
| LED Phosphor Materials Market, CAGR |
7.93% |
| LED Phosphor Materials Market Size 2032 |
USD 13,542.24 million |
LED phosphor materials market is led by key players including Stanley Electric Co. Ltd., Avago Technologies, Osram Sylvania Inc. (OSRAM GmbH), General Electric Company, Edison Opto Corporation, Kingbright Electronic Co., Universal Display Corporation, Nichia Corporation, Epistar Corporation, and Philips Lumileds Lighting Company. These companies drive innovation in high-performance phosphor formulations, enabling superior luminous efficiency, thermal stability, and color rendering across general lighting, automotive, and display applications. Asia Pacific emerged as the leading region with 46.8% market share in 2024, supported by large-scale LED manufacturing and favorable government policies. North America and Europe accounted for 22.4% and 19.1% share, respectively, driven by strong adoption of energy-efficient lighting and automotive applications. The market growth is reinforced by increasing demand for smart lighting, mini-LED, and micro-LED technologies, positioning these top players to capitalize on expanding regional opportunities through 2032.
Market Insights
- LED phosphor materials market size was valued at USD 7,354.5 million in 2024 and is projected to reach USD 13,542.24 million by 2032, growing at a CAGR of 7.93%. Nitride phosphor led the product type segment with 48.6% share, and general lighting dominated the application segment with 55.2% share.
- Strong adoption of energy-efficient LEDs across residential, commercial, and industrial sectors is driving market growth. Government energy regulations, urbanization, and smart city projects are supporting continuous demand for high-performance phosphor materials.
- Emerging trends include increasing adoption of mini-LED and micro-LED displays, as well as the expansion of smart and human-centric lighting solutions. Advanced phosphors are critical for precise color conversion and consistent luminance.
- Key players such as Stanley Electric Co. Ltd., Osram Sylvania, Nichia Corporation, Universal Display Corporation, and Philips Lumileds focus on R&D, strategic collaborations, and capacity expansions to enhance product performance and market presence.
- Asia Pacific held the largest regional share at 46.8% in 2024, followed by North America (22.4%) and Europe (19.1%), driven by strong LED manufacturing, automotive lighting demand, and supportive policies.
Access crucial information at unmatched prices!
Request your sample report today & start making informed decisions powered by Credence Research Inc.!
Download Sample
Market Segmentation Analysis:
By Product Type
By product type, the LED phosphor materials market is led by nitride phosphor, which accounted for 48.6% market share in 2024. Nitride phosphors dominate due to their superior thermal stability, high luminous efficiency, and excellent color rendering, making them ideal for high-power and warm-white LED applications. Strong adoption in premium indoor lighting, automotive headlamps, and high-brightness LEDs continues to drive demand. Silicate and oxide phosphors collectively hold a significant share due to cost advantages, but limited performance under high temperatures keeps them secondary to nitride-based materials.
- For instance, Nichia’s high-power warm-white LED series (e.g., 757 and 219 platforms) relies on red nitride phosphors to achieve high color quality and stable output at elevated junction temperatures.
By Application
By application, general lighting emerged as the dominant sub-segment, holding 55.2% of the market share in 2024. This dominance is driven by the widespread replacement of conventional lighting with LED solutions across residential, commercial, and industrial infrastructure. Government-backed energy-efficiency regulations, rapid urbanization, and declining LED costs continue to accelerate adoption. Automotive lighting follows due to rising LED penetration in headlights and interior systems, while backlighting demand remains stable, supported by displays used in televisions, monitors, and consumer electronics.
- For instance, Signify (Philips Lighting) has reported that LEDs accounted for over 80% of its total sales in recent years, reflecting strong uptake of LED bulbs, luminaires, and connected lighting systems in homes and commercial buildings.
Key Growth Driver
Expanding Adoption of Energy-Efficient LED Lighting
The LED phosphor materials market is strongly driven by the global shift toward energy-efficient lighting solutions. Governments across major economies continue to phase out incandescent and fluorescent lamps through strict energy-efficiency regulations, accelerating LED adoption in residential, commercial, and industrial sectors. LED phosphor materials play a critical role in enhancing luminous efficacy, color rendering index, and thermal stability, making them indispensable to high-performance LED systems. Large-scale infrastructure projects, smart city initiatives, and the rapid expansion of commercial spaces further amplify demand. Additionally, declining LED prices and longer operational lifespans strengthen replacement cycles, sustaining consistent consumption of phosphor materials across mass-market and premium lighting applications.
- For instance, Signify reported that LED and connected lighting represented the vast majority of its 2023 lighting sales, reflecting the rapid replacement of conventional lamps in professional and consumer lighting portfolios.
Rising Demand from Automotive and Advanced Lighting Systems
Increasing penetration of LED technology in automotive lighting significantly fuels growth in the LED phosphor materials market. Automakers are rapidly integrating LEDs into headlights, daytime running lights, interior ambient lighting, and signaling systems due to their durability, design flexibility, and energy efficiency. High-performance phosphors, particularly nitride-based materials, are essential for achieving warm white tones, color uniformity, and stability under high operating temperatures. Growth in electric vehicles and autonomous driving technologies further boosts demand for advanced lighting solutions. As automotive OEMs prioritize safety, aesthetics, and energy optimization, phosphor material consumption continues to rise steadily.
- For instance, Signify reported that LED and connected lighting represented the vast majority of its 2023 lighting sales, reflecting the rapid replacement of conventional lamps in professional and consumer lighting portfolios.
Technological Advancements in LED and Phosphor Formulations
Continuous innovation in LED chip architecture and phosphor material chemistry remains a major growth driver. Manufacturers are investing heavily in developing phosphors with improved quantum efficiency, reduced thermal quenching, and enhanced color consistency. Advancements supporting mini-LED and micro-LED technologies require highly precise phosphor coatings, increasing material value per unit. Improved encapsulation techniques and remote phosphor designs further expand application potential. These technological upgrades enable LEDs to deliver superior performance across lighting, display, and specialty applications, reinforcing long-term demand for high-quality phosphor materials.
Key Trend & Opportunity
Growth of Mini-LED and Micro-LED Displays
The rapid emergence of mini-LED and micro-LED display technologies presents a significant growth opportunity for the LED phosphor materials market. These next-generation displays are increasingly adopted in televisions, smartphones, laptops, and high-end monitors due to superior brightness, contrast, and energy efficiency. Advanced phosphor materials are essential to achieve precise color conversion and uniform luminance at smaller pixel sizes. As consumer electronics brands scale production, demand for high-purity, high-performance phosphors is rising. This trend enables material suppliers to move toward premium formulations with higher margins and long-term supply agreements.
- For instance, Samsung’s “Neo QLED” TVs employ mini‑LED backlights with optimized phosphor‑converted white LEDs to enhance HDR performance and color accuracy at high luminance.
Expansion of Smart Lighting and Human-Centric Lighting
Smart lighting systems and human-centric lighting solutions are gaining strong traction across commercial and residential environments. These systems rely on tunable white and color-adjustable LEDs that require advanced phosphor blends to maintain consistent color output across varying intensities and temperatures. Increasing awareness of circadian rhythm-based lighting in offices, healthcare facilities, and educational institutions further strengthens demand. Integration with IoT platforms and building automation systems creates opportunities for customized phosphor solutions tailored to intelligent lighting controls, opening new revenue streams for manufacturers.
- For instance, Osram’s (ams OSRAM) human-centric lighting solutions integrate multichannel, phosphor‑converted LED modules with DALI and Bluetooth control, enabling dynamic scenes tied to building management and IoT platforms.
Key Challenge
High Production Costs and Raw Material Constraints
High production costs associated with advanced phosphor materials pose a notable challenge to market growth. Nitride and rare-earth-based phosphors require complex manufacturing processes and high-purity raw materials, increasing overall costs. Volatility in rare-earth element supply chains, coupled with geographic concentration of mining and processing, exposes manufacturers to pricing risks. These factors can limit adoption in cost-sensitive applications and emerging markets, pressuring suppliers to balance performance improvements with cost efficiency while maintaining stable supply networks.
Performance Degradation and Thermal Stability Issues
Maintaining long-term performance under high operating temperatures remains a critical technical challenge in the LED phosphor materials market. Phosphor degradation can lead to reduced brightness, color shift, and shortened LED lifespan, particularly in high-power and automotive applications. Ensuring thermal stability while achieving high luminous efficiency requires continuous material innovation and rigorous testing. Failure to address these issues may impact product reliability and customer confidence. As LED systems become more compact and powerful, overcoming thermal and durability constraints remains essential for sustained market expansion.
Regional Analysis
Asia Pacific
Asia Pacific dominated the LED phosphor materials market with a market share of 46.8% in 2024, supported by strong LED manufacturing ecosystems in China, Japan, South Korea, and Taiwan. The region benefits from large-scale production of LEDs for general lighting, displays, and automotive applications, along with cost-effective raw material availability. Rapid urbanization, smart city projects, and government-led energy-efficiency programs continue to accelerate LED adoption. Additionally, the presence of leading phosphor and LED manufacturers strengthens supply chains, making Asia Pacific the primary growth engine for the global market.
North America
North America accounted for 22.4% of the LED phosphor materials market in 2024, driven by high adoption of energy-efficient lighting across commercial, industrial, and residential sectors. Strict energy regulations, including building efficiency standards, support continuous LED retrofitting projects. Strong demand from automotive lighting, architectural lighting, and advanced display technologies further contributes to market growth. The region also benefits from active R&D investments focused on high-performance phosphor materials, particularly for smart lighting and human-centric lighting applications, sustaining steady demand across the United States and Canada.
Europe
Europe captured 19.1% market share in 2024, supported by aggressive sustainability targets and widespread replacement of conventional lighting with LED systems. EU regulations promoting low-carbon technologies have significantly boosted demand for high-quality LED lighting in public infrastructure, offices, and industrial facilities. Automotive lighting remains a key growth area, driven by strong vehicle production in Germany, France, and Italy. Additionally, Europe’s focus on premium lighting solutions with high color rendering and efficiency continues to drive demand for advanced phosphor materials across both lighting and display applications.
Latin America
Latin America held 6.5% of the LED phosphor materials market in 2024, with growth supported by gradual infrastructure modernization and rising adoption of energy-efficient lighting. Government initiatives aimed at reducing electricity consumption in public lighting and commercial buildings are encouraging LED penetration. Brazil and Mexico lead regional demand due to expanding construction activities and urban development projects. Although price sensitivity limits rapid adoption of advanced phosphors, improving economic conditions and increasing awareness of long-term energy savings continue to support steady market expansion.
Middle East & Africa
The Middle East & Africa region accounted for 5.2% market share in 2024, driven by infrastructure development and large-scale urban projects. LED lighting adoption is increasing across commercial buildings, hospitality, and public infrastructure, particularly in the Gulf countries. Government-led sustainability initiatives and smart city developments support demand for efficient lighting solutions. In Africa, gradual electrification and urban growth are contributing to LED adoption, although market growth remains moderated by cost constraints and limited local manufacturing, keeping demand comparatively lower than other regions.
Market Segmentations:
By Product Type
- Silicate Phosphor
- Nitride Phosphor
- Oxide Phosphor
- Others
By Application
- General Lighting
- Automotive Lighting
- Backlighting
- Others
By Geography
- North America
- Europe
- Germany
- France
- U.K.
- Italy
- Spain
- Rest of Europe
- Asia Pacific
- China
- Japan
- India
- South Korea
- South-east Asia
- Rest of Asia Pacific
- Latin America
- Brazil
- Argentina
- Rest of Latin America
- Middle East & Africa
- GCC Countries
- South Africa
- Rest of the Middle East and Africa
Competitive Landscape
The LED phosphor materials market is characterized by the presence of several well-established global and regional players, driving innovation and adoption across lighting and display applications. Key companies include Stanley Electric Co. Ltd., Avago Technologies, Osram Sylvania Inc. (OSRAM GmbH), General Electric Company, Edison Opto Corporation, Kingbright Electronic Co., Universal Display Corporation, Nichia Corporation, Epistar Corporation, and Philips Lumileds Lighting Company. These players focus on product development, strategic collaborations, and capacity expansion to enhance performance, color consistency, and thermal stability of phosphor materials. Continuous R&D efforts aim to support emerging technologies such as mini-LED, micro-LED, automotive headlamps, and smart lighting solutions. Companies are also leveraging regional manufacturing hubs, particularly in Asia Pacific, to optimize production costs and supply chains. Competitive strategies emphasize high-purity, high-efficiency phosphors that meet evolving global lighting standards, ensuring both technological leadership and sustained market share growth through 2032.
Shape Your Report to Specific Countries or Regions & Enjoy 30% Off!
Key Player Analysis
- Epistar Corporation
- Stanley Electric Co. Ltd.
- Universal Display Corporation
- Nichia Corporation
- General Electric Company
- Kingbright Electronic Co.
- Osram Sylvania Inc. (OSRAM GmbH)
- Avago Technologies
- Philips Lumileds Lighting Company
- Edison Opto Corporation
Recent Developments
- In September 2025, at ISAL 2025 (International Symposium on Automotive Lighting), Nichia launched new LED products the µPLS Mini and DominoPLS expanding its Pixelated Light Source family, which supports advanced automotive lighting systems that integrate phosphor elements for enhanced performance.
- In May 2025, Seaborough B.V. and Luminus Devices announced a strategic partnership to bring the world’s first LEDs with nano‑engineered Eu³⁺based phosphor to market, aimed at commercializing advanced phosphor technology for sustainable LED lighting applications
Report Coverage
The research report offers an in-depth analysis based on Product Type, Application and Geography. It details leading market players, providing an overview of their business, product offerings, investments, revenue streams, and key applications. Additionally, the report includes insights into the competitive environment, SWOT analysis, current market trends, as well as the primary drivers and constraints. Furthermore, it discusses various factors that have driven market expansion in recent years. The report also explores market dynamics, regulatory scenarios, and technological advancements that are shaping the industry. It assesses the impact of external factors and global economic changes on market growth. Lastly, it provides strategic recommendations for new entrants and established companies to navigate the complexities of the market.
Future Outlook
- Demand for nitride phosphors will continue to grow due to superior thermal stability and luminous efficiency.
- Mini-LED and micro-LED technologies will drive increased consumption of high-performance phosphor materials.
- Automotive LED applications, including headlights and interior lighting, will remain a major growth area.
- Smart lighting and human-centric lighting solutions will create new opportunities for advanced phosphors.
- R&D in phosphor formulations will focus on improved color rendering and reduced thermal degradation.
- Asia Pacific will maintain a leading position in market share due to large-scale LED manufacturing.
- North America and Europe will grow steadily driven by energy-efficiency regulations and retrofitting projects.
- Strategic collaborations and partnerships among key players will strengthen product portfolios and supply chains.
- Adoption of LEDs in commercial and industrial sectors will continue to expand globally.
- Increasing demand from display technologies, including televisions, monitors, and smartphones, will boost market growth.



