
| REPORT ATTRIBUTE | DETAILS |
|---|---|
| Historical Period | 2019-2022 |
| Base Year | 2023 |
| Forecast Period | 2024-2032 |
| Agricultural Micronutrients Market Size 2023 | USD 4815.2 Million |
| Agricultural Micronutrients Market, CAGR | 8.80% |
| Agricultural Micronutrients Market Size 2032 | USD 10286.6 Million |
Market Insights
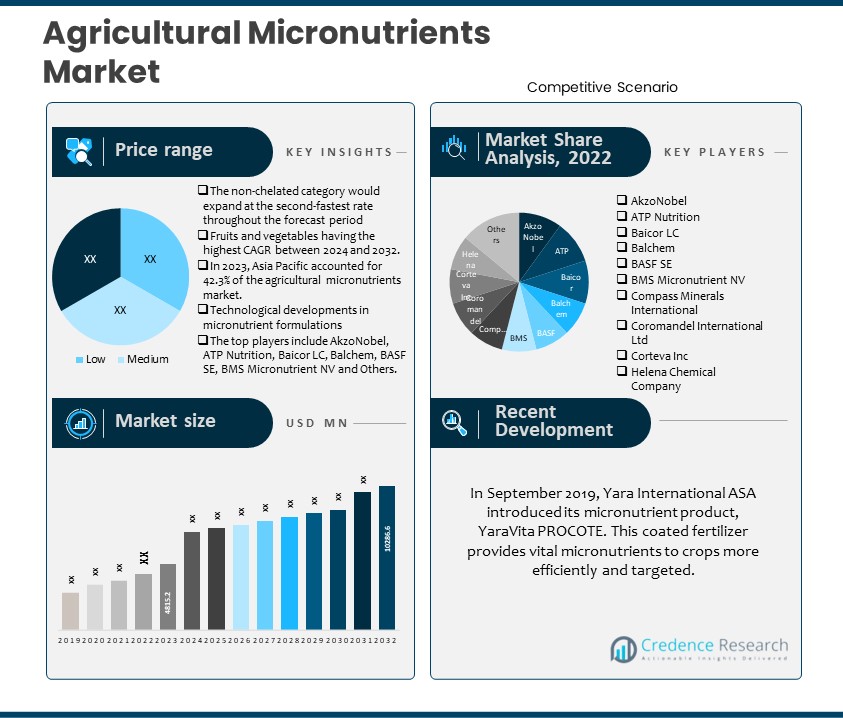
- The global demand for Agricultural Micronutrients was valued at USD 4815.2 Million in 2023 and is expected to reach USD 10286.6 Million in 2032, growing at a CAGR of 8.80% between 2024 and 2032.
- In 2023, the zinc sector is expected to dominate the global agricultural micronutrients market, while the boron category is expected to have the highest CAGR throughout the projected period.
- In 2023, the chelated form segment accounted for more than 70% of total market revenue, while the non-chelated category would grow at the second-fastest rate over the forecast period.
- In 2023, soil application accounted for nearly 65% of market value, while foliar application has the fastest rising CAGR throughout the forecast period.
- In 2023, cereals and grains are predicted to account for the majority of the agricultural micronutrients market, while the fruits and vegetables segment is expected to have the highest CAGR between 2024 and 2032.
- In 2023, Asia Pacific accounted for 42.3 percent of the agricultural micronutrients market.
- The Europe agricultural micronutrient market has the second-largest share.
- Growing population fuels the expansion of the agriculture micronutrient market.
- The organic fertilizer sector is expanding, which limits market growth.
Executive Summary
Market Definition
Micronutrients are necessary nutrients that plants need in trace amounts. Each micronutrient in a plant system serves a particular purpose. Even though these minerals are naturally found in soil, a number of processes, including leaching, monocropping, and soil erosion, can cause the soil to lose these nutrients. Micronutrient deficiencies in the soil can lead to anomalies in plants, slower crop growth, and lower crop yields overall. Foliar spraying, fertigation, and soil treatment all make use of micronutrients.
Market Overview
The global Agricultural micronutrient market has witnessed steady growth in recent years and is expected to grow at a CAGR of 8.80% between 2024 and 2032. The market was valued at USD 4815.2 million in 2023 and is expected to reach USD 10286.6 million in 2032.
Agricultural micronutrients promote plant growth and play an important role in balanced crop nutrition. These include zinc (Zn), copper (Cu), manganese (Mn), iron (Fe), boron (B), and molybdenum. A lack of any of these micronutrients in the soil might impede plant growth and cause crop loss.
Growing plant analysis and soil testing have revealed micronutrient insufficiency in many soils, which will increase the agricultural micronutrients market over the projection period. The growing usage of chemical fertilizer is also driving the rise of agricultural micronutrients, as it protects crops from UV radiation and insects while also improving production, which will benefit the overall development of the agricultural micronutrients market.
Segmentation By Type of Micronutrients
- In 2023, the zinc sector is predicted to dominate the worldwide agricultural micronutrients market. This segment's large market share is due to increased awareness of the wide range of functions that zinc plays in plant growth and how zinc deficiency in soils affects plants, as well as the growing demand to address food security issues and the rising demand for zinc-rich food products due to their health benefits.
- The boron category is predicted to have the greatest CAGR during the projection period. Boron is an essential element that promotes plant cell wall production and reproductive growth.
Segmentation By Formulation and Composition
- In 2023, the chelated form segment was responsible for more than 70% of total market revenue. Chelated micronutrients are commonly used in agriculture and are partially promoted by fertilizer manufacturers. They are organic compounds containing inorganic ingredients. In compared to their non-chelated cousins, they are more stable. As a result of these advantages, they are presently popular in farming, and this market is expected to grow in coming years.
- In addition, due to increased demand, the non-chelated category will expand at the second-fastest rate during the projected period.
Segmentation by Application Method
- In 2023, soil application accounted for approximately 65% of market revenue. Soil application is a common and popular way of administering micronutrients in agriculture. This component permits the uniform distribution of micronutrients to plants with standard fertilizer application equipment.
- Foliar application is increasingly popular among farmers due to its uniform administration of nutrients to crops, resulting in the fastest growing CAGR during the predicted period. The foliar application method provides additional feeding to complete soil fertilization and boost yield.
Segmentation By Crop Type
- In 2023, cereals and grains are estimated to account for the majority of the agricultural micronutrients market. This segment's large market share is attributed to rising demand for food grains as a result of global population growth, increased industrial application of cereals and grains, and massive production of staple crops such as wheat, maize, rice, and barley, which serve as the primary food source for a large portion of the world's population.
- However, the fruits and vegetables segment is expected to have the largest CAGR between 2024 and 2032. This segment's rapid expansion is being driven by increased fruit and vegetable production in response to rising consumption of nutritious foods, rising demand for organic fruits and vegetables, and micronutrient shortage in fruit and vegetable crops.
Segmentation by Region
- In 2023, Asia Pacific held the largest market share for agricultural micronutrients, accounting for 42. 3%.
- The Europe agricultural micronutrient market holds the second-largest share.
- The rest of the world, including Latin America, the Middle East, and Africa, supplies the remaining demand for Agricultural Micronutrients.
Asia Pacific had the greatest agricultural micronutrient market share in 2023, owing to the region's significant cereal/staple crop producers, including China and India. According to the FAO, China's agricultural sector accounts for roughly one-fourth of global grain production and feeds approximately one-fifth of the world's population. Furthermore, China's arable land accounts for only 10% of the total arable area worldwide.\
Furthermore, these countries are significant exporters of high-quality agricultural products. The size and amount of food produced impact the value of exports, and micronutrients have a substantial impact on the quality of plant development, as a lack of such elements might disrupt trade activities. For example, boron is a key micronutrient that reduces mango quality. According to statistics from the National Institute of Health, micronutrient deficiencies cause abnormalities in plant growth and decreased output.
The Europe agricultural Micronutrients Market has the second-largest market share due to increased agricultural production on land in the region and rising food demand. In addition, fertilizer usage in this area has increased significantly. Furthermore, the German Agricultural Micronutrients Market had the biggest market share, while the UK Agricultural Micronutrients Market was the fastest expanding in the European region.
Key Highlights of the Report
Type of Micronutrients, Formulation and Composition, Application Method, Crop Type, and region segment of the global Agricultural Micronutrients Market. In 2023, the zinc sector is expected to dominate the market, with the boron category expected to have the highest CAGR. However, the non-chelated category is expected to grow at the second-fastest rate during the projected time, with the Foliar application being the most popular segment. In addition, by 2023, cereals and grains are expected to account for the majority of the agricultural micronutrient market and Asia Pacific, leading the market growth.
Growing awareness of the need of micronutrients in agriculture, adoption of advanced farming techniques and technologies, and rising demand for high-quality crops and agricultural productivity are the market's primary drivers. Furthermore, farmers' lack of information about the benefits of micronutrients, difficulties with product distribution and availability in distant areas, and environmental concerns about excessive micronutrient application are major market limitations. In addition, the market's significant opportunities include expanding the agriculture sector in new economies, developing customized micronutrient solutions for specific crops, and integrating micronutrient management with digital farming technology for precision agriculture.
Asia Pacific had the largest agricultural micronutrients market share in 2023, thanks to the region's considerable cereal/staple crop producers, such as China and India. Furthermore, the European Agricultural Micronutrients Market has the second-largest market share due to increased agricultural production on regional land and rising food demand.
What Are The Main Drivers Of The Global Agricultural Micronutrients Market?
The Agricultural Micronutrients Market is being driven by farmers' growing knowledge of the critical function of micronutrients in improving crop yield and quality. Furthermore, the use of contemporary farming techniques and technology is driving up demand for micronutrient goods to improve plant growth and production. Furthermore, the growing emphasis on producing high-quality crops to meet rising food demand is driving the market ahead.
What Are The Major Challenges Faced By The Global Agricultural Micronutrients Market?
Despite the market's expansion, there are a few constraints to consider. Farmers' lack of awareness about the benefits of micronutrients hinders market expansion. Furthermore, the difficulty in shipping micronutrient items to remote agricultural areas limits their availability. Environmental worries about the abuse of micronutrients also limit the market's potential expansion.
What Are The Growth Opportunities In The Global Agricultural Micronutrients Market?
The Agricultural Micronutrients Market offers numerous chances for growth. The growing agricultural industry in emerging nations offers a great prospect for expanded usage of micronutrient products. The creation of tailored micronutrient solutions for individual crops can meet farmers' different needs, hence increasing the market potential. Furthermore, combining micronutrient management with digital farming technologies for precision agriculture provides an unparalleled potential to maximize crop nutrition and improve overall agricultural operations.
Market Drivers
Several factors drive the global Agricultural micronutrient market. The following are the key drivers of the global Agricultural Micronutrients Market:
Growing Population
The global population is expanding rapidly. According to the World Bank, the global population is expected to reach 9.7 billion by 2050, representing a 35% increase that will necessitate a 50% increase in agricultural production. Food demand rises in tandem with global population growth. Farmers must increase agricultural yields and maintain optimal plant growth to fulfill rising food demand. Micronutrients are critical for plants' health and productivity. As a result, the expanding population and the need to boost crop productivity drive up demand for agricultural micronutrients.
Market Restraints
The global Agricultural micronutrient market faces some challenges that may hinder its growth. These include the following:
Industry Of Organic Fertilizers Is Expanding
According to the European Parliament's "Megatrends in the Agri-Food Sector" research, food consumption in industrialized nations is mostly shifting toward better meals derived from healthy and safe sources. As a result, more people are becoming aware of agriculture's commercialization and the extensive use of artificial and chemical fertilizers, both of which are harmful to human health. Individuals tend to focus on the quality of their meals in countries where food output outpaces demand. Organic farming is implemented in around 181 countries. According to the 2017 "World Organic Agriculture- Statistics and Emerging Trends" report, organic farming is conducted on 69.8 million hectares of farmland, with Australia, Argentina, and China having the highest numbers at 35.6 million, 3.4 million, and 1.4 million, respectively (3 million hectares). This industry employs more than 2.9 million farmers, the majority of whom are in India, Uganda, and Mexico.
The organic market is quickly developing, particularly in industrialized nations. Key markets include the United States, Germany, and France, with an estimated market value of USD 97 billion in 2017. As the organic market expanded, the production of organic food increased. As organic food production rose, so did the demand for organic agriculture inputs such as organic fertilisers obtained from plants and animals. Organic fertilizer is becoming increasingly popular, making it a potential market competitor for enterprises producing micronutrients.
Opportunities
The global Agricultural micronutrient market offers significant growth opportunities. These include the following:
Declining Arable Land Globally
Arable land is one of the most valuable resources for agricultural production. Many agricultural technologies have evolved throughout the years, resulting in an overutilization of land resources. Due to rising consumption and persistent demand, land has been exploited, resulting in a decrease in quantity and a deterioration in land quality. According to the FAO's Global Land Assessment of Degradation, almost two billion hectares of land have been degraded since the 1950s. It is one of the world's most critical environmental issues, and if no action is taken soon, it will deteriorate. Approximately 25% of the world's land has been degraded. Land degradation contributes greatly to climate change by emitting soil carbon and nitrous oxide into the atmosphere.
Furthermore, the Global Environment Facility estimates that unsustainable agriculture processes waste around 24 billion tons of valuable soil each year, with 95% of land areas damaged by 2050. The use of agricultural micronutrients promotes sustainable agriculture by improving soil and plant health, lowering the demand for hazardous pesticides, and increasing production. Micronutrients help to preserve arable land production in the long run by providing the soil with the nutrients it requires.
Agricultural micronutrients help address this issue by promoting healthy soil and plant growth, increasing production, and supporting sustainable agriculture practices. Thus, rising demand for sustainable agriculture and shrinking arable land are projected to drive the global agricultural micronutrient market.
Competitive Landscape
Key Players
The global Agricultural micronutrient market is highly competitive, with several key players. Some of the major players in the market and their market share are as follows:
- AkzoNobel
- ATP Nutrition
- Baicor LC
- Balchem
- BASF SE
- BMS Micronutrient NV
- Compass Minerals International
- Coromandel International Ltd
- Corteva Inc
- Haifa Group
- Helena Chemical Company
- Nufarm
- Nutrien, Ltd
- Sapec SA
- Stoller Enterprises Inc
- The Mosaic Company
These organizations prioritize product innovation, Application Method expansion, and mergers and acquisitions to stay competitive.
The global Agricultural Micronutrients Market's key players continually seek to stay ahead by offering new products and developments.
In August 2021, BASF launched Basagran Zinc, a new micronutrient product. The product combines the herbicide Basagran with zinc, which promotes crop growth and development.
In May 2020, Nutrien Ltd. bought Agrible, Inc., a digital agriculture company that offers agronomic and environmental solutions to farms. This acquisition is intended to boost Nutrien's offerings in the agricultural micronutrient sector.
In May 2022, Coromandel International added five additional items to its product portfolio to supplement its crop protection offerings.
In February 2022, The Mosaic Company announced a collaboration with the Ethos Institute to help its supply chain partners address all of the implications.
In September 2021, Coromandel International Limited has created a new fertilizer brand, GroShakti Plus, for Indian farmers.
Summary of Key Findings
- Declining arable land globally promotes the rise of the agricultural micronutrient market.
- The market is segmented by Type of Micronutrients: Formulation and Composition, Application Method, Crop Type, and region.
- The zinc sector is expected to dominate the global agricultural micronutrients market in 2023
- Foliar application has the fastest rising CAGR throughout the projected period.
- Asia Pacific is leading in market growth; the market is highly competitive, with key players including AkzoNobel, ATP Nutrition, Baicor LC, Balchem, BASF SE, BMS Micronutrient NV and Others.
Future Outlook
- Precision farming techniques are increasingly being adopted.
- Rising demand for food security and sustainable agricultural techniques.
- Increased awareness regarding micronutrient deficits in crops
- Technological developments in micronutrient formulations
How CXOs Can Benefit from the Credence Research Agricultural Micronutrients Market Report
The Credence Research Agricultural Micronutrients Market Report provides CXOs with a comprehensive overview of the market, including:
- Market size and growth forecast: The report provides detailed estimates of the global Agricultural Micronutrients Market size, segmented By Type of Micronutrients, Formulation and Composition, Application Method, Crop Type and region. It also includes forecasts for the market through 2032 based on key trends and drivers.
- Market segmentation: The report segments the Agricultural Micronutrients Market By Type of Micronutrients, Formulation and Composition, Application Method, Crop Type and region. This segmentation provides CXOs with a granular understanding of the market and the opportunities in each segment.
- Competitive Landscape: The report profiles the key players in the Agricultural Micronutrients Market and provides insights into their strategies, product offerings, and financial performance. This information can help CXOs to identify and assess their competition.
- Key trends and drivers: The report identifies and analyzes the key trends and drivers that are shaping the Agricultural Micronutrients Market. This information can help CXOs to make informed decisions about their investments and strategies.
CXOs can use the insights from the Credence Research Agricultural Micronutrients Market Report to:
- Identify growth opportunities: The report can help CXOs to identify new growth opportunities in the Agricultural Micronutrients Market. For example, by analyzing the data and trends in the report, they can make informed decisions on where to invest and expand their business.
- Make informed investment decisions: The report can help CXOs make informed investment decisions about Agricultural Micronutrients. For example, it may provide useful insights into market trends, customer preferences, the competitive landscape, and growth prospects in the mobile accessories business..
- Develop competitive strategies: The report can help CXOs develop competitive strategies for their Agricultural Micronutrients businesses. For example, by analyzing market trends, client preferences, and the competitive environment mentioned in the report, CXOs can fine-tune their strategies, differentiate their offers, and effectively position their firms in the marketplace.
- Track market developments: The report can help CXOs monitor market developments and stay ahead of the curve. For example, it provides insights into the latest trends and innovations in the Agricultural Micronutrients Market.
Overall, the Credence Research Agricultural Micronutrients Market Report is a valuable resource for CXOs who are looking to gain a deeper understanding of the market and identify .opportunities for growth.
Segmentation
- By Type of Micronutrients:
- Boron (B)
- Copper (Cu)
- Iron (Fe)
- Manganese (Mn)
- Zinc (Zn)
- Molybdenum (Mo)
- Nickel (Ni)
- By Formulation and Composition:
- Chelated Micronutrients
- Non-Chelated Micronutrients
- By Application Method:
- Soil Application
- Foliar Spraying
- Fertigation
- By Crop Type:
- Cereals and Grains
- Oilseeds and Pulses
- Fruits and Vegetables
- Horticultural Crops
- By Region
- North America
- The U.S.
- Canada
- Mexico
- Europe
- Germany
- France
- The U.K.
- Italy
- Spain
- Rest of Europe
- Asia Pacific
- China
- Japan
- India
- South Korea
- South-east Asia
- Rest of Asia Pacific
- Latin America
- Brazil
- Argentina
- Rest of Latin America
- Middle East & Africa
- GCC Countries
- South Africa
- Rest of the Middle East and Africa
- North America

Request a Free Sample
Fill in your details and we'll send you a free sample report.
- Sample data tables & charts
- Research methodology
Market Dynamics
Growing Population and Food Security Needs
The rapid increase in global population is driving the need for higher agricultural productivity, making micronutrients essential for boosting crop yields and ensuring food security.
Micronutrient Deficiency in Soils
Widespread deficiencies of key micronutrients like zinc and boron in agricultural soils, identified through plant analysis and soil testing, are increasing the adoption of micronutrient products to restore soil fertility and crop health.
Adoption of Advanced Farming Techniques
The integration of precision agriculture and modern farming technologies is encouraging the use of tailored micronutrient solutions, enhancing nutrient management and crop performance.
Declining Arable Land and Soil Degradation
With global arable land decreasing due to overuse and degradation, farmers are turning to micronutrients to maintain soil productivity and support sustainable agriculture practices.
Rising Demand for High-Quality Crops
Consumers and food processors are increasingly demanding crops with higher nutritional value and quality, prompting farmers to use micronutrients to improve crop quality and meet market standards.
Need a Custom Version of This Report?
Tailor the scope, geography, or segments to your exact requirements.
- Custom geography or segment scope
- Direct access to our analyst team
Frequently Asked Questions
What is the current size of the global Agricultural Micronutrients Market?
What is the expected growth rate of the Agricultural Micronutrients Market between 2024 and 2032?
Which segment is leading the market share in terms of Formulation and Composition?
Which Crop Type segment governs the demand for Agricultural Micronutrients in the world?
Who are the major players in the global Agricultural Micronutrients Market?
Table of Content
Chapter 1 Market Segmentation
- 1.1 Segmentation Framework
- 1.1.1 Product and Service Classification
- 1.1.2 Application and End-Use Classification
- 1.1.3 Technology and Solution Classification
- 1.1.4 Customer and Distribution Channel Classification
- 1.1.5 Geographic Segmentation
- 1.1.6 Market Segment Definitions and Boundaries
- 1.2 By Crop Type
- 1.2.1 Cereals and Grains
- 1.2.2 Oilseeds and Pulses
- 1.2.3 Fruits and Vegetables
- 1.2.4 Horticultural Crops
- 1.3 By Application Method
- 1.3.1 Soil Application
- 1.3.2 Foliar Spraying
- 1.3.3 Fertigation
- 1.4 By Type of Micronutrients
- 1.4.1 Boron (B)
- 1.4.2 Copper (Cu)
- 1.4.3 Iron (Fe)
- 1.4.4 Manganese (Mn)
- 1.4.5 Zinc (Zn)
- 1.4.6 Molybdenum (Mo)
- 1.4.7 Nickel (Ni)
- 1.5 By Formulation and Composition
- 1.5.1 Chelated Micronutrients
- 1.5.2 Non-Chelated Micronutrients
Chapter 2 Introduction
- 2.1 Report Objectives and Scope
- 2.2 Product Definition and Industry Terminology
- 2.3 Market Inclusions and Exclusions
- 2.4 Research Process
- 2.4.1 Primary Research and Expert Interviews
- 2.4.2 Secondary Research and Source Review
- 2.4.3 Top-Down and Bottom-Up Estimation
- 2.4.4 Data Triangulation and Verification
- 2.5 Market Size Measurement Basis
- 2.5.1 2023: USD 4815.2 Million → 2032: USD 10,286.6 Million
- 2.6 Historical and Forecast Reference Periods
- 2.6.1 Base Year: 2023
- 2.6.2 Forecast Period: 2023-2032
- 2.7 Research Assumptions and Limitations
Chapter 3 Executive Summary
- 3.1 Market Snapshot and Key Findings
- 3.2 Base-Year Market Size, 2023
- 3.3 Forecast Market Size, 2032
- 3.4 Revenue and Volume Growth Outlook
- 3.5 Key Demand and Supply Indicators
- 3.6 Leading Market Segments
- 3.7 Fastest-Growing Market Opportunities
- 3.8 Regional Performance Highlights
- 3.9 Technology and Industry Transformation
- 3.10 Competitive Landscape Summary
- 3.11 Analyst View and Strategic Implications
Chapter 4 Global Agricultural Micronutrients Market Trends and Developments
- 4.1 Historical Industry Development
- 4.2 Recent Market Trends and Developments
- 4.3 Demand and Customer Behavior Trends
- 4.4 Technology and Product Innovation
- 4.5 Artificial Intelligence, Automation and Digitalization
- 4.6 Local Manufacturing and Supply Chain Realignment
- 4.7 Industry Partnerships, Mergers and Acquisitions
- 4.8 Sustainability and Circular Economy Developments
- 4.9 Government and Private Sector Investment Trends
- 4.10 Emerging Business Models and Commercialization
- 4.11 Industry Developments and Announcements
Chapter 5 Global Agricultural Micronutrients Market Production, Supply and Demand Analysis
- 5.1 Demand Trend and Consumption Analysis
- 5.2 Demand Forecast, 2023-2032
- 5.3 Production and Output Trend
- 5.4 Production and Output Forecast, 2023-2032
- 5.5 Installed Capacity and Capacity Utilization
- 5.6 Company-Wise Production Plants and Statistics
- 5.6.1 Installed Production Capacity
- 5.6.2 Actual Production
- 5.6.3 Planned Capacity and Expansion Targets
- 5.7 Supply Chain Structure and Procurement Trends
- 5.8 Supply-Demand Gap and Bottlenecks
- 5.9 Import Dependence and Sourcing Structure
- 5.10 Contract Manufacturing and Outsourcing
- 5.11 Regional Supply and Demand Concentration
Chapter 6 Global Agricultural Micronutrients Market Pricing Analysis
- 6.1 Pricing Structure and Measurement
- 6.2 Historical Pricing Trends
- 6.3 Pricing Outlook, 2023-2032
- 6.4 Average Selling Price and Unit Economics
- 6.5 Pricing by Product and Market Segment
- 6.6 Geographic Pricing Differences
- 6.7 Key Input, Energy, Labor and Logistics Costs
- 6.8 Contract Pricing and Purchasing Models
- 6.9 Pricing Sensitivity and Competitive Positioning
- 6.10 Price, Margin and Profitability Implications
Chapter 7 Global Agricultural Micronutrients Market Dynamics
- 7.1 Market Growth Drivers
- 7.1.1 Demand-Side Drivers
- 7.1.2 Technology and Innovation Drivers
- 7.1.3 Infrastructure and Investment Drivers
- 7.1.4 Regulatory and Policy Drivers
- 7.2 Market Restraints
- 7.2.1 Cost and Affordability Constraints
- 7.2.2 Technology and Adoption Barriers
- 7.2.3 Supply Chain and Operational Constraints
- 7.3 Market Challenges
- 7.3.1 Competitive Pressure and Margin Erosion
- 7.3.2 Skills, Infrastructure and Implementation Gaps
- 7.4 Emerging Market Opportunities
- 7.5 Market Dynamics Impact and Time-Horizon Assessment
Chapter 8 Global Agricultural Micronutrients Value Chain Analysis
- 8.1 Industry Value Chain Overview
- 8.2 Upstream Suppliers and Critical Inputs
- 8.3 Technology and Component Providers
- 8.4 Manufacturing or Service Delivery
- 8.5 Distribution, Channel Partners and Integrators
- 8.6 Downstream Applications and End Users
- 8.7 Value Addition and Profit Pools
- 8.8 Vertical Integration and Outsourcing
- 8.9 Supplier Concentration and Risk
- 8.10 Supply Chain Localization and Resilience
Chapter 9 Global Agricultural Micronutrients Market Regulations and Policies
- 9.1 Relevant Laws, Standards and Compliance Frameworks
- 9.2 Product, Service, Safety and Quality Requirements
- 9.3 Government Policies, Incentives and Subsidies
- 9.4 Imports, Exports and Trade Barriers
- 9.5 Public Procurement and Local Content Requirements
- 9.6 Environmental and Sustainability Compliance
- 9.7 Upcoming Policy Changes and Market Implications
Chapter 10 Global Agricultural Micronutrients Market Hotspots and Opportunities
- 10.1 Market Opportunity Mapping and Growth Hotspots
- 10.2 High-Growth Applications and Customer Groups
- 10.3 Underserved Markets and White-Space Opportunities
- 10.4 Emerging Technology and Product Opportunities
- 10.5 New Capacity and Investment Hotspots
- 10.6 Market Entry and Expansion Opportunities
- 10.7 Distribution and Partnership Opportunities
- 10.8 Near-Term and Long-Term Commercial Potential
- 10.9 Opportunity Attractiveness and Execution Risks
Chapter 11 Global Agricultural Micronutrients Market Outlook, 2023-2032
- 11.1 Market Size and Analysis
- 11.1.1 Revenue (Market Measurement: 2023: USD 4815.2 Million → 2032: USD 10,286.6 Million)
- 11.1.2 Market Volume and Quantity Sold
- 11.1.3 Historical Market Size
- 11.1.4 Base-Year Market Size, 2023
- 11.2 Market Forecast, 2023-2032
- 11.2.1 Revenue Forecast to 2032
- 11.2.2 Volume Forecast to 2032
- 11.2.3 CAGR and Year-on-Year Growth
- 11.2.4 Incremental Revenue Opportunity
- 11.3 Forecast Assumptions and Scenario Analysis
- 11.3.1 Base-Case Forecast
- 11.3.2 Optimistic and Conservative Scenarios
- 11.3.3 Technology, Pricing and Policy Sensitivities
- 11.4 Market Attractiveness and Growth Outlook
Chapter 12 Global Agricultural Micronutrients Market Segmentation and Outlook
- 12.1 Segmentation Summary and Market Shares, 2023
- 12.2 Largest and Fastest-Growing Segments
- 12.3 By Crop Type - Market Size and Forecast, 2023-2032
- 12.3.1 Segment Definition and Scope
- 12.3.2 Historical Market Size
- 12.3.3 Revenue Forecast, 2023-2032
- 12.3.4 Volume Forecast, 2023-2032
- 12.3.5 Base-Year Market Share, 2023
- 12.3.6 Segment CAGR and Growth Drivers
- 12.3.7 Subsegment Market Size and Forecast
- 12.3.7.1 Cereals and Grains
- 12.3.7.2 Oilseeds and Pulses
- 12.3.7.3 Fruits and Vegetables
- 12.3.7.4 Horticultural Crops
- 12.3.8 Subsegment Pricing and Adoption Trends
- 12.3.9 Leading Suppliers and Competition
- 12.3.10 Regional Demand and Opportunities
- 12.4 By Application Method - Market Size and Forecast, 2023-2032
- 12.4.1 Segment Definition and Scope
- 12.4.2 Historical Market Size
- 12.4.3 Revenue Forecast, 2023-2032
- 12.4.4 Volume Forecast, 2023-2032
- 12.4.5 Base-Year Market Share, 2023
- 12.4.6 Segment CAGR and Growth Drivers
- 12.4.7 Subsegment Market Size and Forecast
- 12.4.7.1 Soil Application
- 12.4.7.2 Foliar Spraying
- 12.4.7.3 Fertigation
- 12.4.8 Subsegment Pricing and Adoption Trends
- 12.4.9 Leading Suppliers and Competition
- 12.4.10 Regional Demand and Opportunities
- 12.5 By Type of Micronutrients - Market Size and Forecast, 2023-2032
- 12.5.1 Segment Definition and Scope
- 12.5.2 Historical Market Size
- 12.5.3 Revenue Forecast, 2023-2032
- 12.5.4 Volume Forecast, 2023-2032
- 12.5.5 Base-Year Market Share, 2023
- 12.5.6 Segment CAGR and Growth Drivers
- 12.5.7 Subsegment Market Size and Forecast
- 12.5.7.1 Boron (B)
- 12.5.7.2 Copper (Cu)
- 12.5.7.3 Iron (Fe)
- 12.5.7.4 Manganese (Mn)
- 12.5.7.5 Zinc (Zn)
- 12.5.7.6 Molybdenum (Mo)
- 12.5.7.7 Nickel (Ni)
- 12.5.8 Subsegment Pricing and Adoption Trends
- 12.5.9 Leading Suppliers and Competition
- 12.5.10 Regional Demand and Opportunities
- 12.6 By Formulation and Composition - Market Size and Forecast, 2023-2032
- 12.6.1 Segment Definition and Scope
- 12.6.2 Historical Market Size
- 12.6.3 Revenue Forecast, 2023-2032
- 12.6.4 Volume Forecast, 2023-2032
- 12.6.5 Base-Year Market Share, 2023
- 12.6.6 Segment CAGR and Growth Drivers
- 12.6.7 Subsegment Market Size and Forecast
- 12.6.7.1 Chelated Micronutrients
- 12.6.7.2 Non-Chelated Micronutrients
- 12.6.8 Subsegment Pricing and Adoption Trends
- 12.6.9 Leading Suppliers and Competition
- 12.6.10 Regional Demand and Opportunities
- 12.7 Segment Growth Comparison
- 12.8 Segment Attractiveness and Priority Matrix
Chapter 13 Global Agricultural Micronutrients End-Use and Application Market Outlook
- 13.1 End-Use Industry and Customer Demand Structure
- 13.2 Leading Applications and Customer Groups
- 13.3 End-Use Market Size, Share and Forecast
- 13.4 Major End-Use Industry Deep Dives
- 13.4.1 Customer Requirements and Use Cases
- 13.4.2 Demand and Replacement Cycles
- 13.4.3 Technical and Regulatory Considerations
- 13.4.4 Purchasing and Procurement Models
- 13.4.5 Leading Vendors and Distribution Channels
- 13.4.6 Forecast and Commercial Opportunities
- 13.5 Emerging Applications and Cross-Segment Demand
- 13.6 End-Use Industry Investment Priorities
Chapter 14 Global Agricultural Micronutrients Geographic Market Outlook, 2023-2032
- 14.1 Regional Market Size and Share, 2023
- 14.2 Regional Market Forecast, 2023-2032
- 14.3 Regional Pricing, Production and Demand Differences
- 14.4 North America
- 14.4.1 United States
- 14.4.2 Canada
- 14.4.3 Mexico
- 14.5 Europe
- 14.5.1 Germany
- 14.5.2 France
- 14.5.3 Italy
- 14.5.4 United Kingdom
- 14.5.5 Spain
- 14.5.6 Poland
- 14.5.7 Russia
- 14.5.8 Netherlands
- 14.5.9 Belgium
- 14.5.10 Sweden
- 14.5.11 Denmark
- 14.5.12 Norway
- 14.5.13 Rest of Europe
- 14.6 Asia Pacific
- 14.6.1 China
- 14.6.2 India
- 14.6.3 Japan
- 14.6.4 South Korea
- 14.6.5 Thailand
- 14.6.6 Indonesia
- 14.6.7 Vietnam
- 14.6.8 Malaysia
- 14.6.9 Australia
- 14.6.10 Rest of Asia Pacific
- 14.7 Latin America
- 14.7.1 Brazil
- 14.7.2 Argentina
- 14.7.3 Colombia
- 14.7.4 Chile
- 14.7.5 Rest of Latin America
- 14.8 Middle East
- 14.8.1 Saudi Arabia
- 14.8.2 United Arab Emirates
- 14.8.3 Turkey
- 14.8.4 Israel
- 14.8.5 Iran
- 14.8.6 Rest of the Middle East
- 14.9 Africa
- 14.9.1 South Africa
- 14.9.2 Egypt
- 14.9.3 Nigeria
- 14.9.4 Morocco
- 14.9.5 Rest of Africa
- 14.10 Regional Investment, Policy and Supply Chain Differences
- 14.11 Regional Competitive Landscape
- 14.12 Geographic Growth Hotspots
Chapter 15 Global Agricultural Micronutrients Technology, Innovation and Sustainability Outlook
- 15.1 Technology Landscape and Maturity
- 15.2 Product, Process and Service Innovation
- 15.3 AI, Automation and Digital Tools in the Industry
- 15.4 Technology Adoption and Performance Benchmarking
- 15.5 Innovation Pipeline and R&D Investment
- 15.6 Patent and Intellectual Property Trends
- 15.7 Energy Efficiency and Resource Management
- 15.8 Sustainability, Recycling and Circularity
- 15.9 Technology Roadmap, 2023-2032
- 15.10 Risks of Obsolescence and Technology Substitution
Chapter 16 Global Agricultural Micronutrients Market Key Strategic Imperatives
- 16.1 Growth and Market Entry Priorities
- 16.2 High-Return Products and Segments
- 16.3 Pricing, Profitability and Cost Optimization
- 16.4 Technology Investment and Product Differentiation
- 16.5 Supply Chain Localization and Resilience
- 16.6 Distribution and Customer Acquisition
- 16.7 Partnership, Acquisition and Capacity Strategy
- 16.8 Regional Expansion Priorities
- 16.9 Short-, Medium- and Long-Term Actions
Chapter 17 Competition Outlook
- 17.1 Industry Competition Characteristics
- 17.2 Market Structure and Concentration
- 17.3 Market Share and Competitive Positioning, 2023
- 17.4 Company-Wise Revenue and Product Benchmarking
- 17.5 Production and Service Capacity Benchmarking
- 17.6 Technology, Pricing and Differentiation
- 17.7 Regional Footprint and Distribution Strength
- 17.8 Mergers, Acquisitions and Strategic Alliances
- 17.9 New Entrants and Competitive Threats
- 17.10 Porter's Five Forces and Industry Attractiveness
- 17.11 Competitive Outlook, 2023-2032
Chapter 18 Company Profiles
- 18.1 Company Coverage and Selection Criteria
- 18.2 BASF SE
- 18.2.1 Business Description
- 18.2.2 Company Ownership and Geographic Presence
- 18.2.3 Product and Service Portfolio
- 18.2.4 Manufacturing and Operating Footprint
- 18.2.5 Production Capacity and Expansion Plans
- 18.2.6 Financial Performance and Investment
- 18.2.7 Market Share and Competitive Position
- 18.2.8 Technology and Innovation Capabilities
- 18.2.9 Strategic Alliances or Partnerships
- 18.2.10 Recent Developments
- 18.2.11 Growth Strategy and Outlook
- 18.3 The Mosaic Company
- 18.4 Nutrien Ltd.
- 18.5 Coromandel International Ltd.
- 18.6 AkzoNobel
- 18.7 Compass Minerals International
- 18.8 Haifa Group
- 18.9 Stoller Enterprises Inc.
- 18.10 BMS Micronutrient NV
- 18.11 Balchem
- 18.12 Other Relevant Market Participants
Note: Every listed company is profiled on the structure shown under the first company. The company list is preliminary and may change based on research findings, market developments, data availability and client requirements.
Chapter 19 Disclaimer
- 19.1 Research and Forecast Disclaimer
- 19.2 Data Source and Estimation Limitations
Note: The depth of individual sections depends on data availability for this market. Volume, capacity, trade and other unit-based metrics are included where applicable.

