
Market Overview
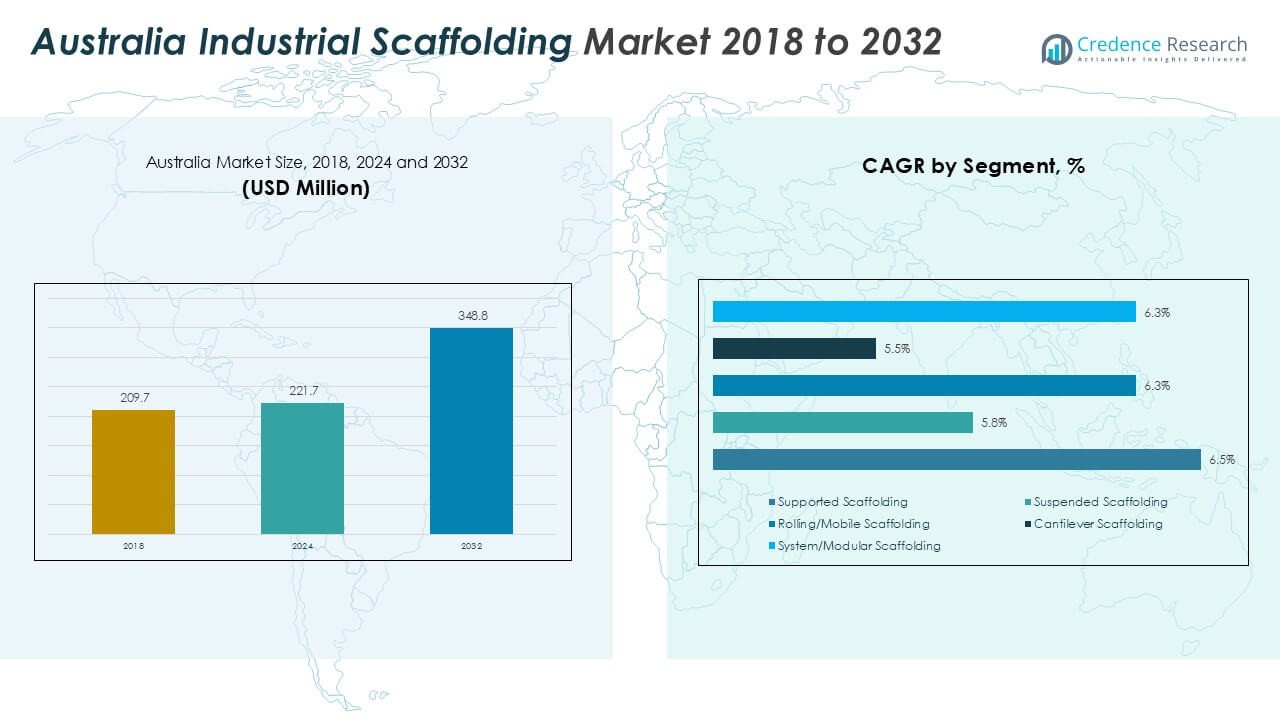
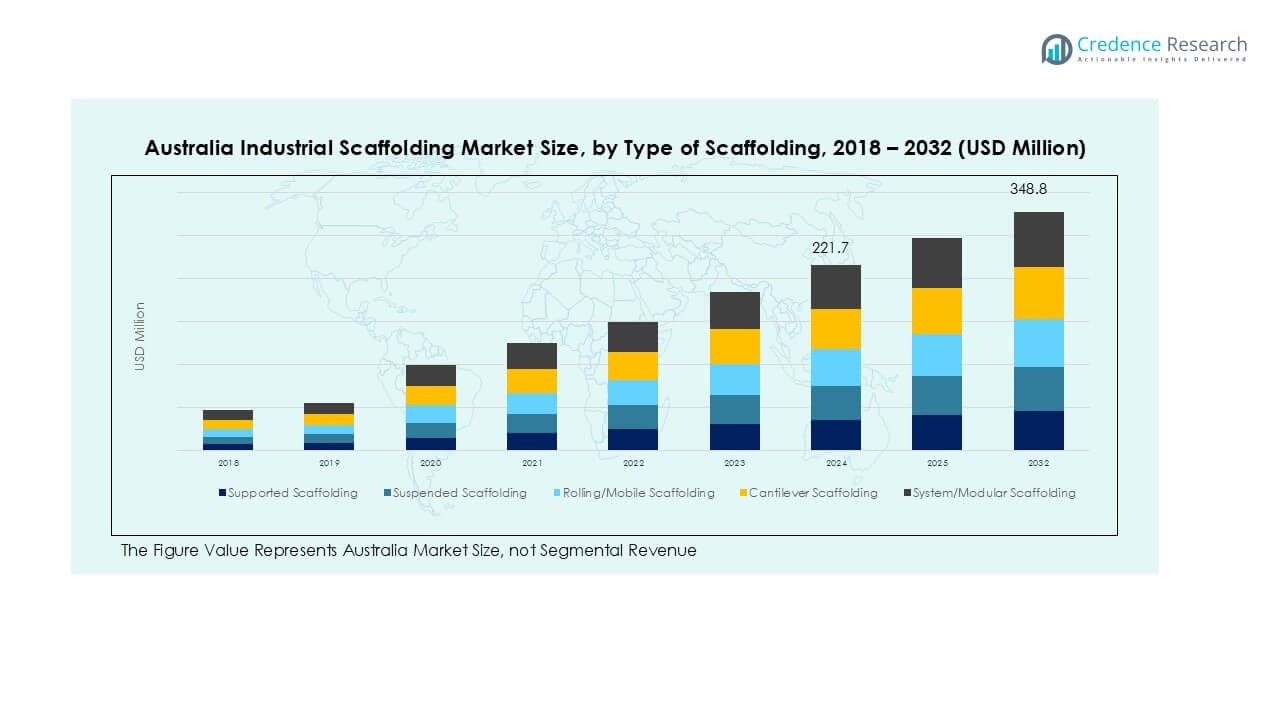
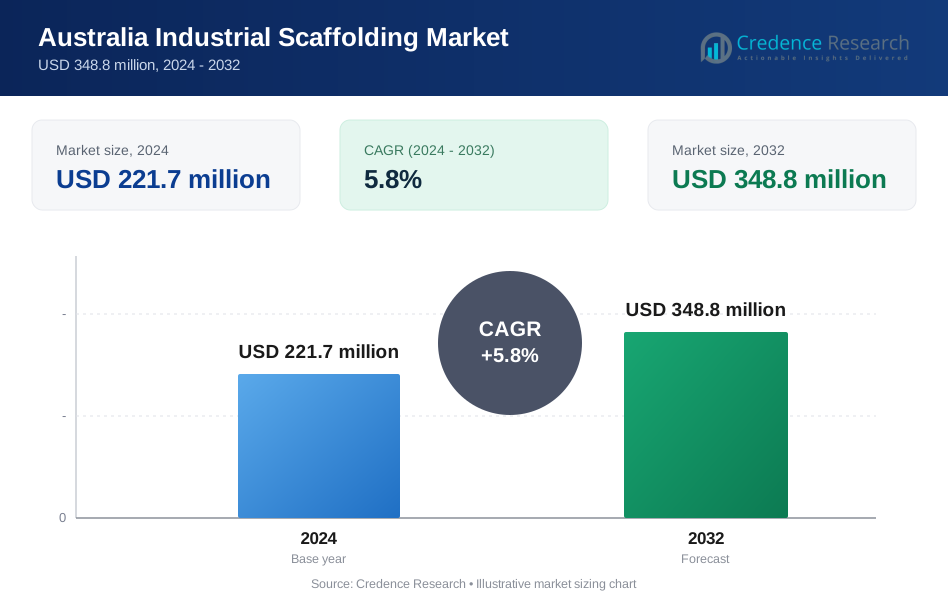
Australia Industrial Scaffolding market size was valued at USD 209.7 million in 2018 to USD 221.7 million in 2024 and is anticipated to reach USD 348.8 million by 2032, at a CAGR of 5.8% during the forecast period.
| REPORT ATTRIBUTE | DETAILS |
|---|---|
| Historical Period | 2020-2023 |
| Base Year | 2024 |
| Forecast Period | 2025-2032 |
| Australia Industrial Scaffolding Market Size 2024 | USD 221.7 Million |
| Australia Industrial Scaffolding Market, CAGR | 5.8% |
| Australia Industrial Scaffolding Market Size 2032 | USD 348.8 Million |
The Australia industrial scaffolding market is led by key players such as Caledonia Group, KJ Industrial Scaffolding, Mr Scaffold, FAB Industrial Scaffolding, KwikUp, Turbo Aluminium, Oceania Access, Western Scaffold Pty Ltd, AZL Holdings Pty Ltd, and Integral Scaffolding. These companies dominate through strong rental networks, modular system offerings, and turnkey project services across construction, energy, and mining sectors. New South Wales emerges as the leading region, accounting for 30% of the total market share, driven by extensive infrastructure projects, power generation assets, and refinery maintenance programs. Victoria and Queensland follow with significant shares, supported by manufacturing plants, LNG facilities, and mining operations. Competitive strategies focus on expanding equipment fleets, adopting digital project planning tools, and maintaining strict WHS compliance. Leading players continue to invest in workforce training and sustainable solutions to strengthen their market position and capture growing opportunities in infrastructure and industrial maintenance projects.
Market Insights
- The Australia industrial scaffolding market was valued at USD 7 million in 2024 and is projected to grow at a CAGR of 5.8% through 2032, driven by infrastructure expansion and industrial maintenance demand.
- Key drivers include rising investment in oil & gas, mining, and power generation projects, along with strict WHS compliance pushing demand for modular and supported scaffolding systems.
- Trends highlight growing adoption of lightweight aluminum and modular scaffolding for faster assembly, as well as digital tools for planning, inspection, and project monitoring.
- The market is moderately fragmented with players like Caledonia Group, Mr Scaffold, KwikUp, and Oceania Access focusing on rental fleet expansion, skilled workforce training, and safety certifications to stay competitive.
- New South Wales holds 30% share, followed by Victoria at 20% and Queensland at 18%; by type, supported scaffolding leads with over 40% share, followed by system/modular scaffolding.
Market Segmentation Analysis:
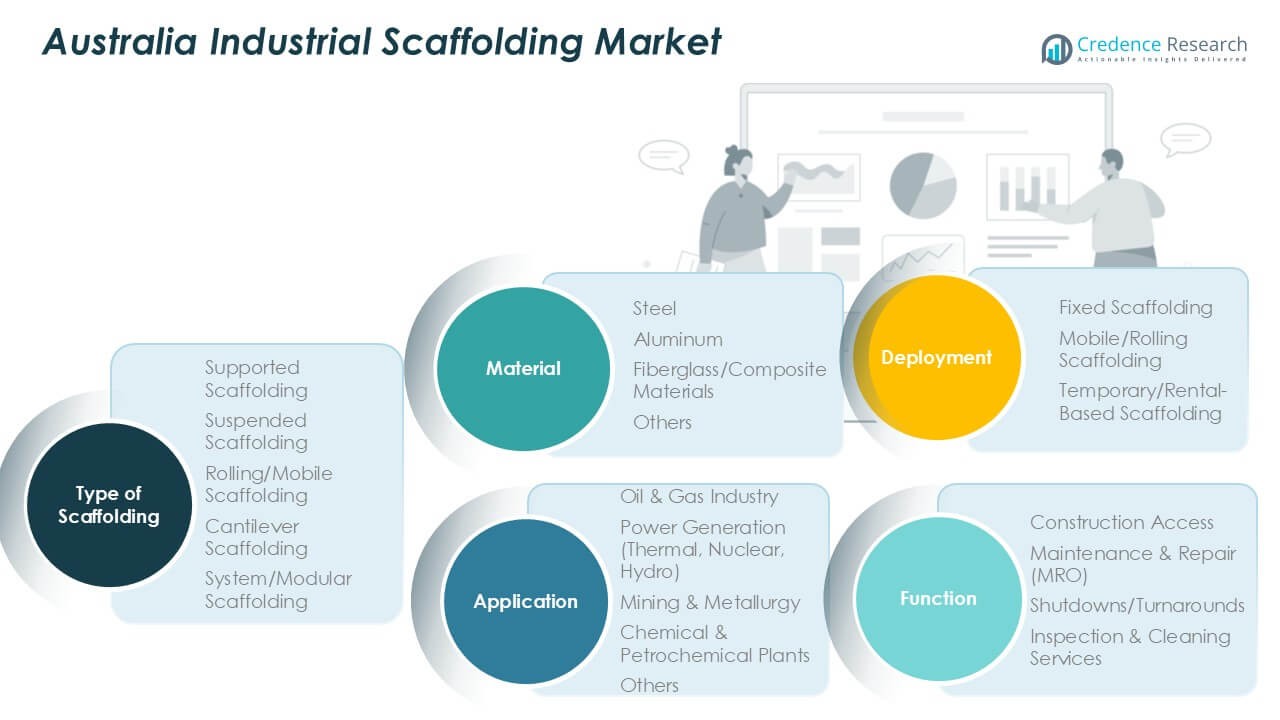
By Type of Scaffolding
Supported scaffolding holds the largest share of the Australia industrial scaffolding market, accounting for over 40% of total demand. Its dominance is driven by ease of assembly, high load-bearing capacity, and suitability for large construction and maintenance projects. System and modular scaffolding follow closely, gaining traction due to their standardization and faster installation, reducing downtime. Rolling scaffolding sees demand in power and mining projects for mobility advantages. Cantilever and suspended types serve niche applications, particularly in projects with limited ground access, supporting safety compliance and productivity.
- For instance, APS Industrial Services, an Australian company, owns over 10,000 tons of Layher supported scaffolding systems and is equipped to handle heavy-duty industrial projects with high static loads.
By Application
The oil and gas industry is the leading application segment, representing more than 30% of market share. Continuous maintenance and turnaround projects in refineries and LNG facilities drive demand for durable scaffolding systems. Power generation, including thermal and hydro plants, also contributes significantly, with a focus on safe access solutions during overhauls. Mining and metallurgy projects add steady demand, especially for modular scaffolding used in difficult terrains. Chemical and petrochemical facilities rely on corrosion-resistant materials, ensuring operational efficiency and reducing downtime during plant shutdowns.
- For instance, Layher’s Lightweight system increased truck payload volume from about 6,400 m³ to 7,200 m³ for birdcage scaffolding under a 23-tonne payload limit.
By Material
Steel dominates the material segment with a share exceeding 60%, favored for its durability, load capacity, and compliance with Australian safety standards. Aluminum is the fastest-growing sub-segment, driven by its lightweight structure and ease of transportation, reducing labor costs. Fiberglass and composite materials are increasingly adopted in chemical and petrochemical plants where non-conductive and corrosion-resistant properties are critical. The shift toward modular steel systems and hybrid materials supports higher safety, longer lifecycle use, and improved cost-effectiveness for contractors and plant operators across industrial sectors.
Key Growth Drivers
Expanding Infrastructure and Industrial Projects
Australia’s ongoing infrastructure development and industrial expansion drive scaffolding demand. Major investments in oil & gas facilities, power generation, and mining projects require reliable access solutions for construction and maintenance. Government-backed infrastructure spending boosts project pipelines, creating consistent demand for supported and modular scaffolding systems. Industrial maintenance, shutdowns, and turnarounds further support market growth, as scaffolding remains critical for worker safety and project timelines. The increasing focus on efficiency and compliance reinforces the preference for standardized and high-load scaffolding systems across industries.
- For instance, the maximum permissible load for a Layher Allround deck, when fully configured for heavy-duty applications, can be up to 7.5 kN/m². In contrast, a standard Kwikstage deck, when configured for general construction work, has a maximum capacity of around 3.0 kN/m² (or 240 kg/m²). Both systems' actual working loads depend on the specific configuration, bay length, and load class.
Stringent Workplace Safety Regulations
Strict safety regulations under Australian Standards and Work Health and Safety (WHS) laws fuel demand for high-quality scaffolding solutions. Industrial players invest in compliant scaffolding systems to mitigate risks and meet inspection requirements. This focus drives adoption of modular scaffolding, which offers standardized components and enhanced safety features. Regulatory audits during shutdown projects encourage the use of robust platforms to reduce accidents and downtime. Rising emphasis on worker protection and liability reduction continues to shape procurement decisions, supporting market expansion and modernization of scaffolding equipment.
- For instance, Safe Work Australia requires design registration under Part 1 of Schedule 5 WHS Regulations for all prefabricated scaffolding systems.
Growing Adoption of Modular and Lightweight Systems
Contractors are increasingly choosing modular and lightweight scaffolding systems to save time and reduce labor costs. Prefabricated modular systems allow quicker assembly and disassembly, improving project turnaround times. Aluminum and composite materials are gaining traction due to their portability and reduced transportation effort. Industrial users value these solutions for minimizing project delays during maintenance cycles. The demand for productivity-enhancing equipment supports technological upgrades, making modular scaffolding a preferred option for large-scale projects in power generation, oil & gas, and mining sectors across Australia.
Key Trends & Opportunities
Digitalization and Smart Monitoring
The market is seeing increased integration of digital tools for scaffolding project planning and monitoring. Software-enabled design and inventory management optimize material use and reduce project costs. Smart sensors and inspection tools improve structural safety and help detect wear or instability early. Contractors benefit from data-driven insights to schedule maintenance more effectively. This trend aligns with Australia’s Industry 4.0 initiatives, creating opportunities for technology providers to deliver end-to-end digital solutions that enhance compliance, safety, and operational efficiency across scaffolding-intensive industries.
- For instance, Tacuna Systems offers wireless load/strain sensors, including load cells and strain gauges, that measure force, weight, tension, and compression in various applications. The company also produces wireless transmitters and displays for use with their sensors, which are designed for high-accuracy force measurement in industries such as construction and robotics.
Rising Demand for Sustainable Materials
Environmental sustainability is emerging as a key opportunity for scaffolding manufacturers. Companies are exploring recyclable steel, lightweight aluminum, and hybrid composite materials with lower carbon footprints. Demand is increasing for longer-life systems that minimize waste during frequent assembly cycles. Clients in oil & gas and mining sectors favor environmentally responsible suppliers to meet corporate ESG commitments. This shift opens opportunities for innovation in material science and encourages the development of eco-certified scaffolding systems that meet both operational and environmental compliance requirements.
- For instance, Turbo Scaffolding in Australia supplies aluminum scaffolding, which is significantly lighter than steel. This eases the burden of transport and assembly, though the exact weight difference per bay can vary depending on the specific components.
Key Challenges
High Initial Investment and Maintenance Costs
Scaffolding systems require significant upfront capital for purchase and ongoing maintenance. Smaller contractors often face financial pressure when investing in high-quality modular or steel scaffolding. Frequent inspections and repairs further add to operating expenses. Rental services offer alternatives but can increase costs for long-term projects. This challenge impacts market growth for SMEs, as budget constraints may delay upgrades to modern, safer systems, despite regulatory compliance pressures driving adoption of advanced scaffolding technologies.
Labor Shortages and Skilled Workforce Gaps
Australia faces a persistent shortage of skilled scaffolders, which limits the pace of project execution. The industry depends on trained personnel for safe assembly, inspection, and dismantling of scaffolding systems. Labor scarcity increases project costs and leads to delays, especially during plant shutdowns and infrastructure peaks. Companies must invest in training and certification programs to meet WHS standards. Addressing this challenge is critical for supporting growth, reducing safety risks, and maintaining efficiency across large-scale industrial projects and maintenance cycles.
Regional Analysis
New South Wales (NSW)
New South Wales leads the Australia industrial scaffolding market with a market share of about 30%. Strong activity in oil and gas terminals, power generation assets, and major infrastructure projects supports consistent demand. Supported and modular scaffolding systems dominate as they ensure safety compliance and fast installation. Ongoing transport network upgrades and urban redevelopment projects generate recurring maintenance needs. Contractors compete on response time, rental availability, and certified workforce deployment. NSW remains the most competitive and mature scaffolding market, setting standards for pricing, equipment quality, and compliance, making it a key revenue hub for leading service providers.
Victoria (VIC)
Victoria accounts for roughly 20% of the market share, supported by refinery turnarounds, manufacturing plant maintenance, and large power station overhauls. Steel and modular scaffolding systems are widely adopted for their reliability and regulatory compliance. Long-term infrastructure programs and asset renewal projects provide a steady stream of demand. Contractors focus on lightweight solutions to reduce labor requirements and improve project timelines. The region benefits from a well-developed rental network, enabling flexible deployment for both scheduled and urgent works. Competition centers on cost efficiency, system availability, and adherence to safety standards across multiple industrial sectors.
Queensland (QLD)
Queensland holds around 18% of the market share, driven by LNG projects, mining operations, and port expansions. High-load modular scaffolding is used extensively for plant shutdowns, maintenance cycles, and capacity expansions. The state’s large geographic area makes logistics and trained labor crucial to successful execution. Contractors prioritize modular solutions to minimize downtime and improve worker safety in remote sites. Demand remains consistent due to ongoing mining production and periodic oil and gas maintenance programs. QLD continues to be a growth hub, with service providers investing in equipment and workforce training to meet project demand effectively.
Western Australia (WA)
Western Australia contributes about 15% of the market share, primarily from mining, mineral processing, and offshore energy projects. Harsh site conditions favor robust steel scaffolding with corrosion protection. Modular prefabricated systems are preferred to reduce assembly time and improve on-site safety. The region sees concentrated demand peaks during major turnarounds, requiring careful inventory and workforce planning. Providers increasingly use digital project management tools for efficiency. WA remains one of the most resource-intensive scaffolding markets, with steady opportunities for suppliers as the state continues to invest in mining expansions and energy infrastructure development.
South Australia (SA)
South Australia represents nearly 7% of the market share, driven by defense manufacturing, energy infrastructure, and industrial facility maintenance. Regular shutdowns and upgrades create steady scaffolding requirements, with engineered access solutions in high demand. Lightweight aluminum platforms are used where mobility and multi-trade site access are essential. WHS compliance strongly influences system choice and contractor performance. Providers focus on rapid mobilization, skilled crew availability, and thorough documentation for inspections. SA’s defense and asset renewal programs ensure a consistent demand base, supporting a stable business environment for scaffolding rental and service companies.
Market Segmentations:
By Type of Scaffolding
- Supported Scaffolding
- Suspended Scaffolding
- Rolling/Mobile Scaffolding
- Cantilever Scaffolding
- System/Modular Scaffolding
By Application
- Oil & Gas Industry
- Power Generation (Thermal, Nuclear, Hydro)
- Mining & Metallurgy
- Chemical & Petrochemical Plants
- Others
By Material
- Steel
- Aluminum
- Fiberglass/Composite Materials
- Others
By Deployment
- Fixed Scaffolding
- Mobile/Rolling Scaffolding
- Temporary/Rental-Based Scaffolding
By Function
- Construction Access
- Maintenance & Repair (MRO)
- Shutdowns/Turnarounds
- Inspection & Cleaning Services
By Geography
- New South Wales (NSW)
- Victoria (VIC)
- Queensland (QLD)
- Western Australia (WA)
- South Australia (SA)
Competitive Landscape
The Australia industrial scaffolding market is moderately fragmented, with several regional and national players competing on service quality, safety compliance, and project execution speed. Leading companies such as Caledonia Group, KJ Industrial Scaffolding, Mr Scaffold, FAB Industrial Scaffolding, KwikUp, Turbo Aluminium, Oceania Access, Western Scaffold Pty Ltd, AZL Holdings Pty Ltd, and Integral Scaffolding dominate market activity across infrastructure, energy, and mining sectors. These firms focus on expanding rental fleets, adopting modular and lightweight systems, and offering turnkey solutions including design, erection, and dismantling. Investment in workforce training, WHS compliance, and digital project management platforms is a key differentiator. Strategic partnerships with EPC contractors and asset operators strengthen their market presence. Players also emphasize sustainability through recyclable materials and low-emission logistics. The competitive environment is expected to intensify as companies invest in technology-driven planning tools and safety innovations to capture larger maintenance and turnaround project contracts nationwide.
Key Player Analysis
- Caledonia Group
- KJ Industrial Scaffolding
- Mr Scaffold
- FAB Industrial Scaffolding
- KwikUp
- Turbo Aluminium
- Oceania Access
- Western Scaffold Pty Ltd
- AZL Holdings Pty Ltd
- Integral Scaffolding
Recent Developments
- In July 2022, A major developer and provider of formwork and scaffolding systems, PERI Formwork Systems, Inc., has developed what would become a new industry standard for bridge construction. VPS ensures a safety and efficiency gap through a highly versatile system that is adjustable, rentable, and productive in forming bridge columns and caps.
- In July 2022, Doka, a key player in formwork solutions and services to the construction industry has taken its collaboration with the well-known American scaffolding company AT-PAC to the next level by making a significant investment in the US-based firm. The two companies first teamed up in 2020 to offer comprehensive solutions for building sites, and their partnership has only grown stronger since then.
- In July 2022, A Glasgow subsidiary named StepUp Scaffold UK from StepUp Scaffold Group in Memphis has completed the purchase of MP House ApS located near Copenhagen during July 2022. The company MP House stands as the dominant supplier of tools and equipment along with accessories to scaffolding operators based in Denmark.
- In April 2022, Layher Holding GmbH Co KG has introduced the Allround Scaffold, a name that reflects the company and perhaps represents the pinnacle of modular scaffolding solutions. The Modular Scaffolding System is essentially the Layher Allround Scaffolding. This system is comparable to Allround Performance, as it serves multiple purposes within a single framework. No matter how complex the designs, architectural styles, or strict safety standards may be, Allround Scaffolding consistently proves to be the quicker, safer, and more economical choice.
Report Coverage
The research report offers an in-depth analysis based on Type of Scaffolding, Application, Material, Deployment, and Geography. It details leading market players, providing an overview of their business, product offerings, investments, revenue streams, and key applications. Additionally, the report includes insights into the competitive environment, SWOT analysis, current market trends, as well as the primary drivers and constraints. Furthermore, it discusses various factors that have driven market expansion in recent years. The report also explores market dynamics, regulatory scenarios, and technological advancements that are shaping the industry. It assesses the impact of external factors and global economic changes on market growth. Lastly, it provides strategic recommendations for new entrants and established companies to navigate the complexities of the market.
Future Outlook
- The market will grow steadily, supported by ongoing infrastructure and industrial expansion projects.
- Adoption of modular and lightweight scaffolding systems will increase to reduce project timelines.
- Demand from oil & gas, mining, and power generation sectors will remain strong.
- Digital project management tools and smart monitoring systems will see higher adoption.
- Safety compliance will continue to drive investment in certified and standardized scaffolding systems.
- Workforce training initiatives will expand to address skilled labor shortages in scaffolding assembly.
- Rental services will gain preference due to cost efficiency and project flexibility.
- Use of recyclable materials and sustainable solutions will rise to meet ESG goals.
- Regional demand will remain highest in New South Wales, Victoria, and Queensland.
- Competition will intensify as players invest in technology and expand service capabilities nationwide.
Request a Free Sample
Fill in your details and we'll send you a free sample report.
- Sample data tables & charts
- Research methodology
Need a Custom Version of This Report?
Tailor the scope, geography, or segments to your exact requirements.
- Custom geography or segment scope
- Direct access to our analyst team
Frequently Asked Questions
What is the current market size for Australia Industrial Scaffolding market, and what is its projected size in 2032?
At what Compound Annual Growth Rate is the Australia Industrial Scaffolding market projected to grow between 2024 and 2032?
Which Australia Industrial Scaffolding market segment held the largest share in 2024?
What are the primary factors fueling the growth of the Australia Industrial Scaffolding market?
Who are the leading companies in the Australia Industrial Scaffolding market?
Which region commanded the largest share of the Australia Industrial Scaffolding market in 2024?
Table of Content
Chapter 1. Report Introduction
- 1.1 Report Description & Purpose
- 1.1.1 Report Title & Market Definition
- 1.1.2 Unique Selling Propositions (USP) & Key Differentiators
- 1.1.3 Value Proposition for Stakeholders
- 1.2 Research Objectives
- 1.2.1 Market Sizing Objectives (Volume & Revenue)
- 1.2.2 Segmentation Objectives
- 1.2.3 Competitive Intelligence Objectives
- 1.2.4 Forecast & Scenario Objectives
- 1.3 Report Scope
- 1.3.1 Australia Industrial Scaffolding Scope – Types & Subtypes Covered
- 1.3.2 Geographic Scope – Regions & Countries Covered
- 1.3.3 Historical Period, Base Year & Forecast Period (2024; forecast to 2032)
- 1.3.4 Inclusions & Exclusions
- 1.4 HS Code & Classification Framework
- 1.5 Currency, Units & Pricing Basis
- 1.6 Target Stakeholders
- 1.7 Limitations & Assumptions
Chapter 2. Executive Summary
- 2.1 Global Australia Industrial Scaffolding Market Snapshot
- 2.1.1 Market Size – Historical (2024) & Forecast (2024-2032) (2024: USD 221.7 million → 2032: USD 348.8 million)
- 2.1.2 Volume & Revenue – Global Totals
- 2.1.3 Key Market Highlights – Top Five Facts
- 2.2 Australia Industrial Scaffolding Market Segmentation Snapshot
- 2.2.1 Market Split by Region – 2024 vs. 2032
- 2.3 Competitive Snapshot
- 2.3.1 Top 10 Players by Revenue Share – 2024
- 2.3.2 Top 10 Players by Volume Share – 2024
- 2.3.3 Recent Strategic Developments (18-Month Summary)
- 2.4 Key Investment Highlights & Strategic Conclusions
Chapter 3. Australia Industrial Scaffolding Market Dynamics & Industry Analysis
- 3.1 Market Overview & Context
- 3.1.1 Australia Industrial Scaffolding Market Position in the Broader Automotive Value Chain
- 3.1.2 OEM vs. Replacement Market Dynamics
- 3.1.3 Market Maturity & Development Stage by Region
- 3.2 Australia Industrial Scaffolding Market Drivers
- 3.3 Australia Industrial Scaffolding Market Restraints & Challenges
- 3.4 Australia Industrial Scaffolding Market Opportunities
- 3.5 Porter's Five Forces Analysis
- 3.5.1 Threat of New Entrants
- 3.5.2 Bargaining Power of Suppliers
- 3.5.3 Bargaining Power of Buyers
- 3.5.4 Threat of Substitutes
- 3.5.5 Competitive Rivalry – Intensity Assessment
- 3.6 Australia Industrial Scaffolding Value Chain Analysis
- 3.6.1 Upstream – Raw Material/Input Suppliers
- 3.6.1.1 Raw Material/Input 1
- 3.6.1.2 Raw Material/Input 2
- 3.6.1.3 Raw Material/Input 3
- 3.6.2 Midstream – Production/Manufacturing/Service Delivery
- 3.6.2.1 Production/Process Overview
- 3.6.2.2 Key Facility Locations & Capacity by Manufacturer
- 3.6.3 Downstream – Distribution & End Consumer
- 3.6.3.1 Primary Channel – B2B/OEM
- 3.6.3.2 Secondary Channels – Dealer, Retail, Online, Direct
- 3.6.4 Value Chain Profitability Analysis
- 3.6.1 Upstream – Raw Material/Input Suppliers
- 3.7 PESTEL Analysis
- 3.7.1 Political Factors
- 3.7.2 Economic Factors
- 3.7.3 Social Factors
- 3.7.4 Technological Factors
- 3.7.5 Environmental Factors
- 3.7.6 Legal Factors
- 3.8 Australia Industrial Scaffolding Supply Chain Analysis
- 3.8.1 Raw Material/Input Supply Risk Assessment
- 3.8.2 Manufacturing Concentration Risk (Geographic Exposure)
- 3.8.3 Trade Disruption Impact Analysis
- 3.9 Regulatory & Policy Landscape
Note: The regulatory and policy landscape section covers regulations based on their applicability to the market, Australia Industrial Scaffolding category, geography, and scope of the study. Only regulatory frameworks with a material impact on operations, compliance, trade, sustainability, or market access are analyzed in detail.
Chapter 4. Key Investment Pockets & Opportunity Analysis
- 4.1 Australia Industrial Scaffolding Market Attractiveness Analysis
- 4.1.1 By Region – Investment Attractiveness Matrix (Volume × CAGR)
- 4.2 Absolute Revenue Growth Opportunity
- 4.2.1 By Region – Absolute USD Growth Through 2032
- 4.3 Incremental Volume Opportunity
- 4.3.1 By Region – Incremental Volume Through 2032
- 4.3.2 Segment – Incremental Volume
- 4.4 Emerging Submarket Opportunity Deep Dive (Subject to Applicability)
- 4.5 Emerging Market Opportunity Scorecards
- 4.5.1 United States
- 4.5.2 Europe
- 4.5.3 Asia
- 4.5.4 Middle East & Africa
Note: Emerging Market Opportunity Scorecards will be included based on relevance and strategic importance. Regions listed are indicative and may vary depending on data availability and market dynamics.
Chapter 5. Australia Industrial Scaffolding Import-Export Analysis & Trade Flows
- 5.1 Global Trade Overview
- 5.1.1 Global Export Value by Country (2024)
- 5.1.2 Global Export Volume by Country (2024)
- 5.1.3 Global Import Value by Country (2024)
- 5.1.4 Global Import Volume by Country (2024)
- 5.1.5 Net Trade Balance by Country (2024)
- 5.2 Export Analysis – Segment
- 5.2.1 Type 1 (HS Code)
- 5.2.2 Type 2 (HS Code)
- 5.2.3 Type 3 (HS Code)
- 5.2.4 Type 4 (HS Code)
- 5.2.5 Type 5 (HS Code)
- 5.3 Import Analysis – Segment
- 5.3.1 Type 1 (HS Code)
- 5.3.2 Type 2 (HS Code)
- 5.3.3 Type 3 (HS Code)
- 5.3.4 Type 4 (HS Code)
- 5.3.5 Type 5 (HS Code)
- 5.4 Average Unit Trade Prices
- 5.4.1 Average Export Price – Segment & Country
- 5.4.2 Average Import Price – Segment & Source Country
- 5.4.3 Price Trends (2024)
- 5.5 Key Trade Route Analysis
- 5.5.1 Trade Route 1
- 5.5.2 Trade Route 2
- 5.5.3 Trade Route 3
- 5.5.4 Trade Route 4
- 5.5.5 Trade Route 5
- 5.6 Trade Policy Impact Assessment
- 5.6.1 US Anti-Dumping & Section 301 Tariffs
- 5.6.2 EU Customs Union Impact
- 5.6.3 Major Free Trade Agreements
- 5.6.4 USMCA Rules of Origin
Note: Trade policy analysis will be included only where relevant to the Australia Industrial Scaffolding market.
Chapter 6. Competitive Landscape & Company Benchmarking
- 6.1 Australia Industrial Scaffolding Market Concentration & Structure
- 6.1.1 Herfindahl-Hirschman Index (HHI) – vs. 2024
- 6.1.2 Tier 1, Tier 2 & Tier 3 Market Structure
- 6.1.3 Global, Regional & Local Player Dynamics
- 6.2 Australia Industrial Scaffolding Market Share Analysis – 2024
- 6.2.1 Global Revenue Share by Company
- 6.2.2 Global Volume Share by Company
- 6.2.3 Regional Revenue Share
- 6.2.4 Market Share Evolution ( vs. 2024)
- 6.2.5 OEM Segment Share by Company
- 6.2.6 Replacement Segment Share by Company
- 6.3 Production/Delivery Capacity & Facility Analysis
- 6.3.1 Global Installed Capacity
- 6.3.2 Capacity Utilization Rates
- 6.3.3 Production/Output Volume
- 6.3.4 Facility Locations & Capacity Map
- 6.3.5 Planned Capacity Additions
- 6.4 Australia Industrial Scaffolding Competitive Benchmarking Matrix
- 6.4.1 Revenue, Volume, CAGR & Profitability Comparison
- 6.4.2 Channel Revenue Mix
- 6.4.3 Geographic Revenue Exposure
- 6.4.4 R&D Intensity
- 6.4.5 Sustainability Maturity
- 6.5 Strategic Developments in Australia Industrial Scaffolding (Last 24 Months)
- 6.5.1 Mergers, Acquisitions & Divestments
- 6.5.2 New Australia Industrial Scaffolding Launches
- 6.5.3 Facility Expansions
- 6.5.4 Strategic Alliances, Joint Ventures & Partnerships
- 6.5.5 Distribution Expansion & Market Entry
- 6.5.6 Sustainability & ESG Initiatives
- 6.6 Competitive Strategy Mapping
- 6.6.1 Leader, Challenger, Follower & Niche Classification
- 6.6.2 Pricing Strategy Comparison
- 6.6.3 Channel Strategy Matrix
Note: Strategic developments are included based on their materiality and the availability of reliable information.
Chapter 7. Global Australia Industrial Scaffolding Market – By Distribution Channel
- 7.1 Segment Overview
- 7.1.1 Volume & Revenue Split by Channel (2024 & 2032)
- 7.1.2 Channel Mix Evolution (2024-2032)
Chapter 8. Regional Market Analysis – Global Overview
- 8.1 Global Regional Overview
- 8.1.1 Regional Volume Share
- 8.1.2 Regional Revenue Share
- 8.1.3 Regional Volume by Region
- 8.1.4 Regional Revenue by Region
- 8.1.5 Regional Forecast Through 2032
- 8.2 Cross-Regional Segment Analysis
- 8.2.1 By Distribution Channel
- 8.2.2 By Brand/Price Tier
Chapter 9. North America Australia Industrial Scaffolding Market
- 9.1 United States
- 9.2 Canada
- 9.3 Mexico
Chapter 10. Europe Australia Industrial Scaffolding Market
- 10.1 Germany
- 10.2 France
- 10.3 Italy
- 10.4 United Kingdom
- 10.5 Spain
- 10.6 Poland
- 10.7 Russia
- 10.8 Netherlands
- 10.9 Belgium
- 10.10 Sweden
- 10.11 Denmark
- 10.12 Norway
- 10.13 Rest of Europe
Chapter 11. Asia Pacific Australia Industrial Scaffolding Market
- 11.1 China
- 11.2 India
- 11.3 Japan
- 11.4 South Korea
- 11.5 Thailand
- 11.6 Indonesia
- 11.7 Vietnam
- 11.8 Malaysia
- 11.9 Australia
- 11.10 Rest of Asia Pacific
Chapter 12. Latin America Australia Industrial Scaffolding Market
- 12.1 Brazil
- 12.2 Argentina
- 12.3 Colombia
- 12.4 Chile
- 12.5 Rest of Latin America
Chapter 13. Middle East Australia Industrial Scaffolding Market
- 13.1 Saudi Arabia
- 13.2 United Arab Emirates
- 13.3 Turkey
- 13.4 Israel
- 13.5 Iran
- 13.6 Rest of the Middle East
Chapter 14. Africa Australia Industrial Scaffolding Market
- 14.1 South Africa
- 14.2 Egypt
- 14.3 Nigeria
- 14.4 Morocco
- 14.5 Rest of Africa
Chapter 15. Australia Industrial Scaffolding Company Profiles
- 15.1 [Company 01]
- 15.1.1 Company Overview
- 15.1.2 Key Management Personnel
- 15.1.3 Products & Services Portfolio
- 15.1.4 Financial Performance
- 15.1.5 Key Market Focus & Geographic Presence
- 15.1.6 Recent Developments & Strategic Initiatives
Note: The company profile list is preliminary and may change based on research findings, market developments, data availability, and client requirements.
Chapter 16. Appendices
- Appendix A – List of Abbreviations & Acronyms
- Appendix B – Industry Classification Code Reference – Full Series
- Appendix C – Production & Capacity Data Tables
- Appendix D – End-Use & Demand Base Tables
- Appendix E – Consumption & Replacement Rate Assumptions
- Appendix F – ASP Reference Tables
- Appendix G – Manufacturing & Facility Database
- Appendix H – Import-Export Data Tables
- Appendix I – Regulatory Summary Tables
- Appendix J – Primary Research Participant List (Anonymized)
- Appendix K – Primary Research Questionnaire Framework
- Appendix L – Data Sources & Bibliography
- Appendix M – Market Size Divergence & Source Comparison
Chapter 17. Research Methodology
- 17.1 Research Framework & Philosophy
- 17.2 Secondary Research – Sources, Hierarchy & Data Extraction
- 17.3 Data Modeling – Bottom-Up & Top-Down Market Sizing
- 17.4 Primary Research – Stakeholder Framework, LOI & Sample Sizes
- 17.5 Forecast Methodology – Regression, Scenario & Sensitivity Analysis
- 17.6 Quality Control – Four-Layer Validation Framework
- 17.7 Limitations & Standard Assumptions
- 17.8 Disclaimer
