
Cell Therapy Consumables Market Overview:
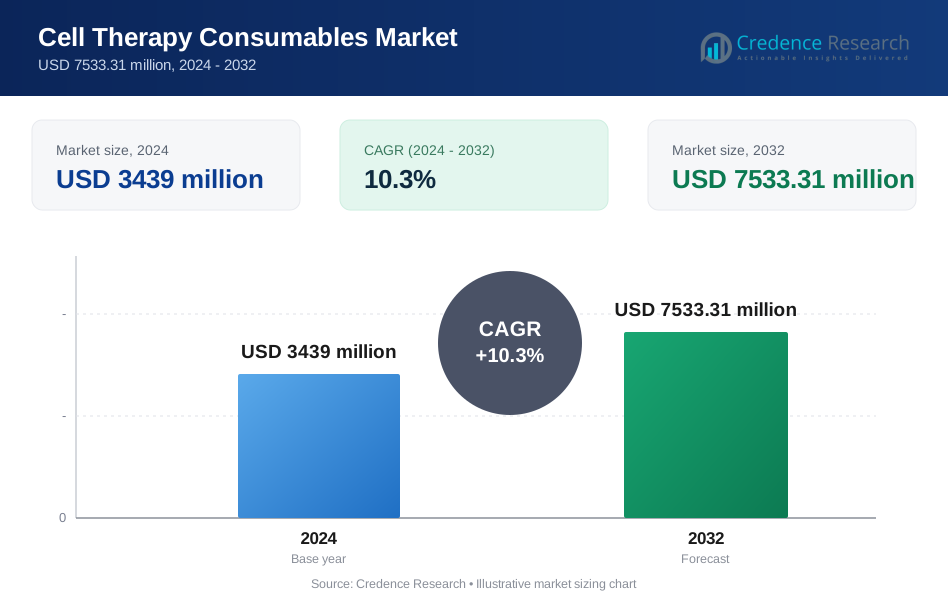
Cell therapy consumables Market was valued at USD 3439 million in 2024 and is anticipated to reach USD 7533.31 million by 2032, growing at a CAGR of 10.3% during the forecast period.
| REPORT ATTRIBUTE | DETAILS |
|---|---|
| Historical Period | 2020-2023 |
| Base Year | 2024 |
| Forecast Period | 2025-2032 |
| Cell Therapy Consumables Market Size 2024 | USD 3439 million |
| Cell Therapy Consumables Market, CAGR | 10.3% |
| Cell Therapy Consumables Market Size 2032 | USD 7533.31 million |
The Cell Therapy Consumables Market is shaped by leading players such as Merck KGaA, Thermo Fisher Scientific Inc., Danaher Corporation, Lonza Group, Sartorius AG, BD, Promega, Miltenyi Biotec, Shimadzu, and CellPort Software. These companies drive growth through advanced reagents, single-use systems, and GMP-compliant consumables that support large-scale cell processing and clinical manufacturing. Their strong investment in automation, closed-system workflows, and high-purity media enhances global adoption of cell-based therapies. North America remains the leading region, holding about 39% share in 2024, supported by advanced infrastructure, strong biotech activity, and rapid commercialization of CAR-T and regenerative treatments.
Cell Therapy Consumables Market Insights
- The Cell Therapy Consumables Market reached USD 3439 million in 2024 and is projected to hit USD 7533.31 million by 2032, expanding at a CAGR of 10.3%.
- Strong demand comes from rising adoption of CAR-T, stem-cell, and iPSC therapies, driving higher consumption of media, reagents, and single-use accessories across clinical and commercial workflows.
- Key trends include rapid automation, increased use of closed-system consumables, and growing demand for GMP-grade kits that support precision manufacturing and reduce contamination risks.
- The market features active competition among Merck KGaA, Thermo Fisher Scientific Inc., Danaher Corporation, Lonza Group, Sartorius AG, BD, Promega, Miltenyi Biotec, Shimadzu, and CellPort Software, with consumables & accessories leading the segment at about 42% share.
- North America leads with roughly 39% share in 2024, supported by advanced manufacturing capacity and strong biotech funding, while Asia Pacific remains the fastest-growing region due to expanding clinical trials and rising CMO activity.
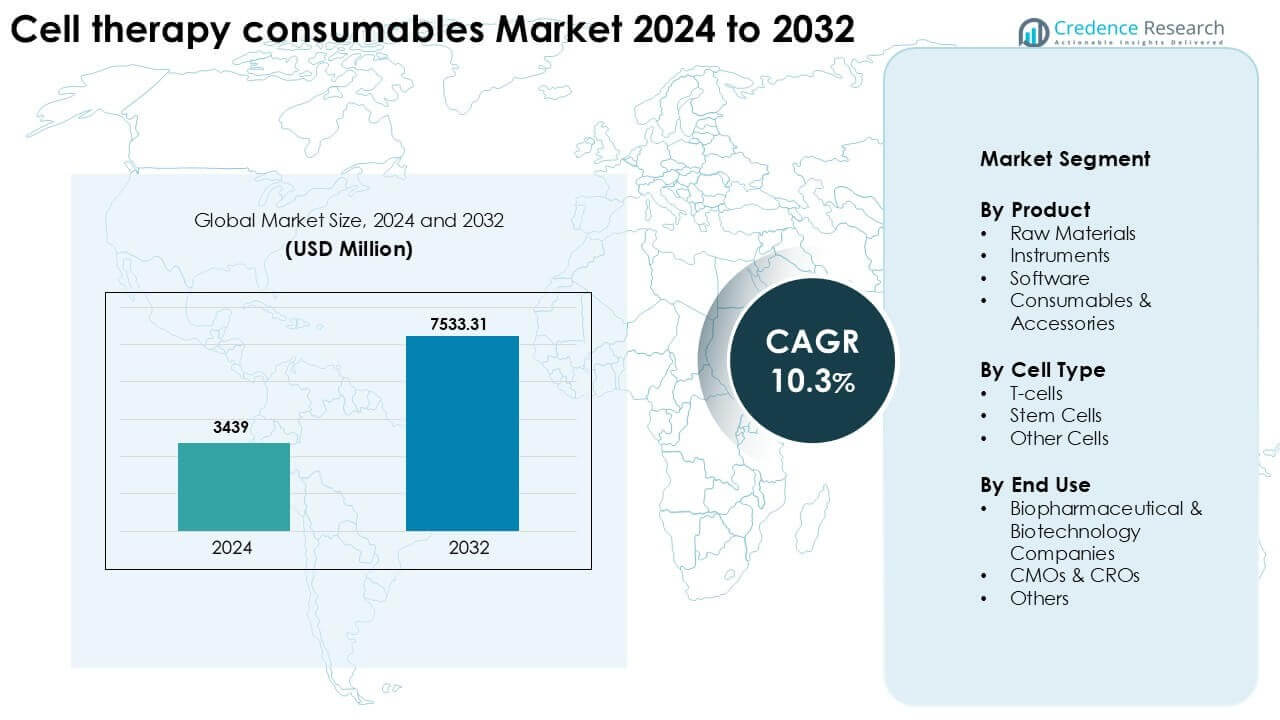
Cell Therapy Consumables Market Segmentation Analysis:
By Product
Consumables & accessories lead the Cell Therapy Consumables Market with about 42% share in 2024. Strong demand comes from culture media, reagents, cryopreservation kits, and single-use systems used in every therapy workflow. Rising adoption of closed and automated systems boosts repeat purchases and supports steady growth. Raw materials follow due to expansion in upstream processing for viral vectors and engineered cells. Instruments and software gain pace as labs shift toward digital tracking and automated monitoring to meet compliance needs.
- For instance, Lonza’s Cocoon® Platform utilizes single-use cassettes with a working volume of 40 mL, enabling fully closed cell processing without open handling steps.
By Cell Type
T-cells dominate this segment with nearly 48% share in 2024, driven by rapid expansion of CAR-T and TCR-based therapies. Demand rises from scalable activation reagents, transduction kits, and cell expansion consumables. Stem cells hold strong growth potential due to increasing use in regenerative medicine and induced pluripotent stem cell research. Other cell groups, such as NK cells and dendritic cells, continue to gain interest as new immunotherapy platforms advance toward late-stage trials.
- For instance, Miltenyi Biotec’s CliniMACS® Prodigy® system enables automated T-cell activation, transduction, and expansion with documented processing of up to 2 × 10¹⁰ cells in a single manufacturing run.
By End Use
Biopharmaceutical and biotechnology companies hold the largest share at around 55% in 2024 due to continuous investment in cell-based therapy pipelines. High consumption comes from large-scale R&D, GMP production, and commercialization activities. CMOs and CROs expand their adoption as outsourcing rises, especially for vector manufacturing and clinical-grade processing. Other users, including academic institutes and hospitals, show steady demand as translational research and early-stage trials increase worldwide.
Key Growth Drivers
Rising Adoption of Cell-Based Therapies
Growing use of cell-based therapies drives strong demand for cell therapy consumables. Increasing approvals of CAR-T and stem-cell therapies expand the need for high-quality media, reagents, and closed-system consumables. Hospitals and biopharma companies now manage larger treatment volumes, which raises procurement of activation kits, viral vector raw materials, and cryopreservation tools. Expansion of global clinical trials also boosts usage across upstream and downstream processes. As more therapies progress to commercial stages, manufacturers scale production facilities and rely heavily on single-use consumables to meet GMP requirements, ensuring steady growth across core product segments.
- For instance, Novartis’ commercial CAR-T therapy manufacturing network supports multiple centralized sites with individual batch production designed for single-patient dosing, where each treatment requires more than 50 distinct single-use consumables, including sterile tubing sets, culture media bags, and cryogenic storage vials. The process includes controlled cryopreservation at temperatures below -150 °C and validated closed-system handling to maintain product integrity.
Expansion of GMP Manufacturing Capacity
Global investment in GMP manufacturing strengthens the need for compliant consumables. Biopharmaceutical companies and CMOs continue to build advanced gene and cell therapy facilities to support large-scale production. Each facility requires sterile filters, bags, media, aseptic connectors, and traceable reagents designed for regulatory compliance. Rising outsourcing amplifies the need for reliable supply chains and validated consumables to ensure batch consistency. The shift toward automated and closed platforms in GMP suites also increases dependence on high-purity kits and single-use tools. This expansion, supported by government and private funding, creates a strong upward push for consumable-based workflows.
- For instance, Lonza operates multiple dedicated cell and gene therapy manufacturing facilities with cleanroom capacities exceeding 20 individual GMP suites per site, each equipped for closed-system processing. A single GMP suite can consume thousands of sterile single-use components annually, including bioreactor bags up to 2,000 L, validated sterile filters, and pre-assembled tubing manifolds to support multi-batch production.
Increased R&D Investments in Regenerative Medicine
High investment in regenerative medicine supports strong market growth for cell therapy consumables. Stem-cell platforms, iPSC research, and advanced immunotherapies require diverse reagents, culture media, matrices, and disposables for safe expansion and differentiation. Public-private funding accelerates innovation and pushes research labs to scale their consumable usage. Academic institutes and translational centers also adopt next-generation consumables to improve yield, viability, and reproducibility. As regenerative medicine moves toward clinical readiness, researchers depend on optimized kits that reduce contamination risk and support precision manufacturing. These rising R&D activities create sustained, long-term demand.
Key Trends & Opportunities
Shift Toward Automated and Closed-System Workflows
Automation shapes a major opportunity in the Cell Therapy Consumables Market. Labs transition from manual handling to automated units that use standardized single-use consumables. Closed systems help reduce contamination, improve batch quality, and meet stringent GMP norms. This change increases sales of sterile bags, tubes, sensors, media cartridges, and integrated reagent cassettes. Vendors now develop platform-specific consumables that fit automated expansion and isolation systems. As manufacturing volume rises, automated workflows enable higher throughput and reduce labor pressure, creating strong long-term demand for compatible consumables and accessories across research and commercial operations.
- For instance, Miltenyi Biotec’s CliniMACS Prodigy platform integrates cell selection, activation, expansion, and formulation within a single closed system using pre-sterilized tubing sets and reagent cassettes. Each run uses a dedicated single-use set containing over 100 fluidic connections and supports cell processing volumes up to 400 mL, eliminating open handling steps across the full workflow.
Growing Demand for Single-Use and Customizable Consumables
Single-use consumables represent a growing trend as manufacturers aim to avoid cleaning validation and cross-contamination risks. Customizable formats including tailored bags, matrices, scaffolds, pipette tips, and reagent kits gain traction as therapy developers optimize workflows for unique cell lines. Rising demand for flexible, scalable consumables supports vendor opportunities in specialized coating materials, advanced culture surfaces, and cryo-ready formats. This shift also benefits CMOs that require batch-specific consumables for multiple clients. As personalized cell therapy advances, custom and small-lot consumables will remain a core opportunity for innovation and supply expansion.
- For instance, Thermo Fisher Scientific supplies customizable single-use bioprocess containers ranging from 50 mL to 5,000 L for cell therapy manufacturing, with application-specific port configurations and gamma-sterilized materials. These containers are used alongside cryopreservation bags validated for storage below - 150 °C, supporting individualized batch production without reusable hardware.
Key Challenges
High Cost of High-Quality Research and GMP-Grade Consumables
The high cost of GMP-grade consumables remains a major challenge. Manufacturers must meet strict regulatory standards for sterility, purity, and traceability, raising production costs significantly. Developers often require batch-specific or custom consumables, which increases expenses further. Smaller research labs and startups struggle to manage these costs, limiting their ability to scale or advance early-stage therapies. As commercial therapies expand, rising consumable demand strains budgets and increases total manufacturing cost per dose. Achieving price efficiency while maintaining stringent quality standards remains a persistent barrier for buyers and suppliers.
Supply Chain Complexity and Limited Global Manufacturing Capacity
Global supply chain constraints create major challenges for consistent delivery of cell therapy consumables. Many critical materials such as specialized reagents, viral vector raw materials, and sterile single-use plastics depend on limited manufacturers. Disruptions in raw material availability or logistics can slow entire production cycles. High dependence on cold-chain transport further complicates distribution. Regulatory variations across regions delay procurement and extend lead times. As demand grows faster than supply capacity, shortages emerge, impacting both clinical and commercial manufacturing. Strengthening supply resilience and expanding global production remain urgent challenges for the industry.
Regional Analysis
North America
North America leads the Cell Therapy Consumables Market with about 39% share in 2024, driven by strong adoption of CAR-T therapies, advanced GMP facilities, and high R&D spending. The U.S. benefits from a mature biotech sector, well-established clinical trial networks, and rapid expansion of commercial cell therapy manufacturing. Rising investments from biopharma companies and CMOs support wider use of media, reagents, and single-use tools. Canada strengthens growth through funding in stem-cell research and translational centers. Robust regulatory frameworks and expanding production capacity keep the region at the forefront of global demand.
Europe
Europe holds nearly 28% share in 2024, supported by strong pharmaceutical infrastructure and rising investment in regenerative medicine. Countries such as Germany, the U.K., and France lead due to advanced cell therapy manufacturing hubs and supportive regulatory pathways. Demand rises for GMP-grade consumables used in autologous and allogeneic therapy production. Growing academic research and cross-border clinical programs increase consumption of media, reagents, and cryo-solutions. EU funding and collaborative innovation platforms further enhance production capabilities. Expanding clinical adoption and strong CMO presence push Europe toward steady, long-term market growth.
Asia Pacific
Asia Pacific captures about 25% share in 2024 and represents the fastest-growing region. China, Japan, and South Korea drive expansion through rapid investment in cell therapy manufacturing, large patient pools, and government-supported research initiatives. Rising clinical trials, growing CMO capacity, and a shift toward automated workflows increase demand for consumables and accessories. Japan leads in iPSC-based development, boosting procurement of specialized media and matrices. China’s manufacturing ecosystem strengthens supply chains and reduces regional dependency on imports. Expanding biotech ecosystems and lower production costs position Asia Pacific for strong future growth.
Latin America
Latin America accounts for nearly 5% share in 2024, with growth led by Brazil and Mexico. The region experiences rising adoption of regenerative medicine and early-stage cell therapy research programs. Demand increases for basic consumables, culture media, and cryopreservation products used in academic labs and hospital-based trials. Partnerships with North American and European biotech companies help build technical capabilities. Limited GMP infrastructure slows large-scale production, but increasing government funding and private investment support progress. Growing healthcare modernization and expanding research networks create long-term development opportunities for consumable suppliers.
Middle East & Africa
The Middle East & Africa region holds about 3% share in 2024, driven by expanding cell therapy research hubs in the UAE, Saudi Arabia, and South Africa. Growing investment in precision medicine and advanced clinical centers increases demand for reagents, closed-system consumables, and cryogenic tools. Collaborations with global biotech firms support technology transfer and training programs. Limited local manufacturing capacity remains a constraint, but rising healthcare modernization and government-funded innovation projects help accelerate adoption. Expanding regenerative medicine programs position the region for gradual and steady market growth.
Cell Therapy Consumables Market Segmentations:
By Product
- Raw Materials
- Instruments
- Software
- Consumables & Accessories
By Cell Type
- T-cells
- Stem Cells
- Other Cells
By End Use
- Biopharmaceutical & Biotechnology Companies
- CMOs & CROs
- Others
By Geography
- North America
- U.S.
- Canada
- Mexico
- Europe
- Germany
- France
- U.K.
- Italy
- Spain
- Rest of Europe
- Asia Pacific
- China
- Japan
- India
- South Korea
- South-east Asia
- Rest of Asia Pacific
- Latin America
- Brazil
- Argentina
- Rest of Latin America
- Middle East & Africa
- GCC Countries
- South Africa
- Rest of the Middle East and Africa
Competitive Landscape
The Cell Therapy Consumables Market features strong competition led by major players such as Merck KGaA, Promega, Shimadzu, BD, Sartorius AG, CellPort Software, Miltenyi Biotec, Lonza Group, Thermo Fisher Scientific Inc., and Danaher Corporation. These companies compete through advanced consumables, GMP-ready reagents, and single-use systems tailored for cell processing, expansion, and cryopreservation. Leaders invest heavily in automation, digital workflow solutions, and closed-system technologies to support high-throughput manufacturing. Partnerships with CMOs, biotech firms, and academic centers strengthen product reach and accelerate innovation. Many players also expand regional facilities to safeguard supply chains and meet increasing global demand. Continuous development of specialized media, viral vector reagents, and regulatory-compliant consumables keeps competition intense and drives product differentiation across the industry.
Key Player Analysis
- Merck KGaA
- Promega
- Shimadzu
- BD
- Sartorius AG
- CellPort Software
- Miltenyi Biotec
- Lonza Group
- Thermo Fisher Scientific Inc.
- Danaher Corporation
Recent Developments
- In October 2025, Promega entered a strategic partnership with MilliporeSigma to co-develop 3D cell drug discovery assays. The collaboration combines organoid models with Promega reporter assays for real-time cell activity tracking. This strengthens Promega’s assay consumables used in advanced cell models for cell and gene therapy research.
- In September 2025, Sartorius AG expanded its Illkirch site to add GMP production of transfection reagents. The enlarged facility now supplies pharmaceutical-grade reagents critical for viral vector manufacturing. These raw materials are key consumables for scalable cell and gene therapy production worldwide.
- In October 2024, BD introduced robotics-compatible BD OMICS-One XT reagent kits with Hamilton’s NGS STAR platform. The solution automates single-cell library preparation and multiomics studies at high throughput. These automation-ready reagents enhance reproducible cell analysis that underpins cell therapy discovery and process development.
Report Coverage
The research report offers an in-depth analysis based on Product, Cell Type, End-Use and Geography. It details leading market players, providing an overview of their business, product offerings, investments, revenue streams, and key applications. Additionally, the report includes insights into the competitive environment, SWOT analysis, current market trends, as well as the primary drivers and constraints. Furthermore, it discusses various factors that have driven market expansion in recent years. The report also explores market dynamics, regulatory scenarios, and technological advancements that are shaping the industry. It assesses the impact of external factors and global economic changes on market growth. Lastly, it provides strategic recommendations for new entrants and established companies to navigate the complexities of the market.
Future Outlook
- Demand for consumables will rise as more cell therapies progress from trials to commercial use.
- Automation and closed-system workflows will gain wider adoption across manufacturing sites.
- Single-use consumables will become standard to reduce contamination risks and support GMP compliance.
- Customizable media, matrices, and reagent kits will expand to meet therapy-specific needs.
- CMOs and CROs will increase procurement as outsourcing of cell therapy production grows.
- AI-driven analytics and digital tracking tools will improve batch consistency and consumable planning.
- Stem-cell and iPSC platforms will drive higher demand for specialized culture and differentiation products.
- Global supply chains will expand through new regional manufacturing hubs for critical consumables.
- Sustainability initiatives will push manufacturers to adopt eco-friendly and recyclable single-use options.
- Collaboration between biopharma companies and technology providers will accelerate innovation in advanced consumable formats.
Request a Free Sample
Fill in your details and we'll send you a free sample report.
- Sample data tables & charts
- Research methodology
Need a Custom Version of This Report?
Tailor the scope, geography, or segments to your exact requirements.
- Custom geography or segment scope
- Direct access to our analyst team
Frequently Asked Questions
What is the current market size for Cell therapy consumables Market, and what is its projected size in 2032?
At what Compound Annual Growth Rate is Cell therapy consumables Market projected to grow between 2024 and 2032?
Which Cell therapy consumables Market segment held the largest share in 2024?
What are the primary factors fueling the growth of Cell therapy consumables Market?
Who are the leading companies in Cell therapy consumables Market?
Which region commanded the largest share of Cell therapy consumables Market?
Table of Content
Chapter 1. Report Introduction
- 1.1 Report Description & Purpose
- 1.1.1 Report Title & Market Definition
- 1.1.2 Unique Selling Propositions (USP) & Key Differentiators
- 1.1.3 Value Proposition for Stakeholders
- 1.2 Research Objectives
- 1.2.1 Market Sizing Objectives (Volume & Revenue)
- 1.2.2 Segmentation Objectives
- 1.2.3 Competitive Intelligence Objectives
- 1.2.4 Forecast & Scenario Objectives
- 1.3 Report Scope
- 1.3.1 Cell Therapy Consumables Scope – Types & Subtypes Covered
- 1.3.2 Geographic Scope – Regions & Countries Covered
- 1.3.3 Historical Period, Base Year & Forecast Period (2024; forecast to 2032)
- 1.3.4 Inclusions & Exclusions
- 1.4 HS Code & Classification Framework
- 1.5 Currency, Units & Pricing Basis
- 1.6 Target Stakeholders
- 1.7 Limitations & Assumptions
Chapter 2. Executive Summary
- 2.1 Global Cell Therapy Consumables Market Snapshot
- 2.1.1 Market Size – Historical (2024) & Forecast (2024-2032) (2024: USD 3439 million → 2032: USD 7533.31 million)
- 2.1.2 Volume & Revenue – Global Totals
- 2.1.3 Key Market Highlights – Top Five Facts
- 2.2 Cell Therapy Consumables Market Segmentation Snapshot
- 2.2.1 Market Split by Region – 2024 vs. 2032
- 2.3 Competitive Snapshot
- 2.3.1 Top 10 Players by Revenue Share – 2024
- 2.3.2 Top 10 Players by Volume Share – 2024
- 2.3.3 Recent Strategic Developments (18-Month Summary)
- 2.4 Key Investment Highlights & Strategic Conclusions
Chapter 3. Cell Therapy Consumables Market Dynamics & Industry Analysis
- 3.1 Market Overview & Context
- 3.1.1 Cell Therapy Consumables Market Position in the Broader Automotive Value Chain
- 3.1.2 OEM vs. Replacement Market Dynamics
- 3.1.3 Market Maturity & Development Stage by Region
- 3.2 Cell Therapy Consumables Market Drivers
- 3.3 Cell Therapy Consumables Market Restraints & Challenges
- 3.4 Cell Therapy Consumables Market Opportunities
- 3.5 Porter's Five Forces Analysis
- 3.5.1 Threat of New Entrants
- 3.5.2 Bargaining Power of Suppliers
- 3.5.3 Bargaining Power of Buyers
- 3.5.4 Threat of Substitutes
- 3.5.5 Competitive Rivalry – Intensity Assessment
- 3.6 Cell Therapy Consumables Value Chain Analysis
- 3.6.1 Upstream – Raw Material/Input Suppliers
- 3.6.1.1 Raw Material/Input 1
- 3.6.1.2 Raw Material/Input 2
- 3.6.1.3 Raw Material/Input 3
- 3.6.2 Midstream – Production/Manufacturing/Service Delivery
- 3.6.2.1 Production/Process Overview
- 3.6.2.2 Key Facility Locations & Capacity by Manufacturer
- 3.6.3 Downstream – Distribution & End Consumer
- 3.6.3.1 Primary Channel – B2B/OEM
- 3.6.3.2 Secondary Channels – Dealer, Retail, Online, Direct
- 3.6.4 Value Chain Profitability Analysis
- 3.6.1 Upstream – Raw Material/Input Suppliers
- 3.7 PESTEL Analysis
- 3.7.1 Political Factors
- 3.7.2 Economic Factors
- 3.7.3 Social Factors
- 3.7.4 Technological Factors
- 3.7.5 Environmental Factors
- 3.7.6 Legal Factors
- 3.8 Cell Therapy Consumables Supply Chain Analysis
- 3.8.1 Raw Material/Input Supply Risk Assessment
- 3.8.2 Manufacturing Concentration Risk (Geographic Exposure)
- 3.8.3 Trade Disruption Impact Analysis
- 3.9 Regulatory & Policy Landscape
Note: The regulatory and policy landscape section covers regulations based on their applicability to the market, Cell Therapy Consumables category, geography, and scope of the study. Only regulatory frameworks with a material impact on operations, compliance, trade, sustainability, or market access are analyzed in detail.
Chapter 4. Key Investment Pockets & Opportunity Analysis
- 4.1 Cell Therapy Consumables Market Attractiveness Analysis
- 4.1.1 By Region – Investment Attractiveness Matrix (Volume × CAGR)
- 4.2 Absolute Revenue Growth Opportunity
- 4.2.1 By Region – Absolute USD Growth Through 2032
- 4.3 Incremental Volume Opportunity
- 4.3.1 By Region – Incremental Volume Through 2032
- 4.3.2 Segment – Incremental Volume
- 4.4 Emerging Submarket Opportunity Deep Dive (Subject to Applicability)
- 4.5 Emerging Market Opportunity Scorecards
- 4.5.1 United States
- 4.5.2 Europe
- 4.5.3 Asia
- 4.5.4 Middle East & Africa
Note: Emerging Market Opportunity Scorecards will be included based on relevance and strategic importance. Regions listed are indicative and may vary depending on data availability and market dynamics.
Chapter 5. Cell Therapy Consumables Import-Export Analysis & Trade Flows
- 5.1 Global Trade Overview
- 5.1.1 Global Export Value by Country (2024)
- 5.1.2 Global Export Volume by Country (2024)
- 5.1.3 Global Import Value by Country (2024)
- 5.1.4 Global Import Volume by Country (2024)
- 5.1.5 Net Trade Balance by Country (2024)
- 5.2 Export Analysis – Segment
- 5.2.1 Type 1 (HS Code)
- 5.2.2 Type 2 (HS Code)
- 5.2.3 Type 3 (HS Code)
- 5.2.4 Type 4 (HS Code)
- 5.2.5 Type 5 (HS Code)
- 5.3 Import Analysis – Segment
- 5.3.1 Type 1 (HS Code)
- 5.3.2 Type 2 (HS Code)
- 5.3.3 Type 3 (HS Code)
- 5.3.4 Type 4 (HS Code)
- 5.3.5 Type 5 (HS Code)
- 5.4 Average Unit Trade Prices
- 5.4.1 Average Export Price – Segment & Country
- 5.4.2 Average Import Price – Segment & Source Country
- 5.4.3 Price Trends (2024)
- 5.5 Key Trade Route Analysis
- 5.5.1 Trade Route 1
- 5.5.2 Trade Route 2
- 5.5.3 Trade Route 3
- 5.5.4 Trade Route 4
- 5.5.5 Trade Route 5
- 5.6 Trade Policy Impact Assessment
- 5.6.1 US Anti-Dumping & Section 301 Tariffs
- 5.6.2 EU Customs Union Impact
- 5.6.3 Major Free Trade Agreements
- 5.6.4 USMCA Rules of Origin
Note: Trade policy analysis will be included only where relevant to the Cell Therapy Consumables market.
Chapter 6. Competitive Landscape & Company Benchmarking
- 6.1 Cell Therapy Consumables Market Concentration & Structure
- 6.1.1 Herfindahl-Hirschman Index (HHI) – vs. 2024
- 6.1.2 Tier 1, Tier 2 & Tier 3 Market Structure
- 6.1.3 Global, Regional & Local Player Dynamics
- 6.2 Cell Therapy Consumables Market Share Analysis – 2024
- 6.2.1 Global Revenue Share by Company
- 6.2.2 Global Volume Share by Company
- 6.2.3 Regional Revenue Share
- 6.2.4 Market Share Evolution ( vs. 2024)
- 6.2.5 OEM Segment Share by Company
- 6.2.6 Replacement Segment Share by Company
- 6.3 Production/Delivery Capacity & Facility Analysis
- 6.3.1 Global Installed Capacity
- 6.3.2 Capacity Utilization Rates
- 6.3.3 Production/Output Volume
- 6.3.4 Facility Locations & Capacity Map
- 6.3.5 Planned Capacity Additions
- 6.4 Cell Therapy Consumables Competitive Benchmarking Matrix
- 6.4.1 Revenue, Volume, CAGR & Profitability Comparison
- 6.4.2 Channel Revenue Mix
- 6.4.3 Geographic Revenue Exposure
- 6.4.4 R&D Intensity
- 6.4.5 Sustainability Maturity
- 6.5 Strategic Developments in Cell Therapy Consumables (Last 24 Months)
- 6.5.1 Mergers, Acquisitions & Divestments
- 6.5.2 New Cell Therapy Consumables Launches
- 6.5.3 Facility Expansions
- 6.5.4 Strategic Alliances, Joint Ventures & Partnerships
- 6.5.5 Distribution Expansion & Market Entry
- 6.5.6 Sustainability & ESG Initiatives
- 6.6 Competitive Strategy Mapping
- 6.6.1 Leader, Challenger, Follower & Niche Classification
- 6.6.2 Pricing Strategy Comparison
- 6.6.3 Channel Strategy Matrix
Note: Strategic developments are included based on their materiality and the availability of reliable information.
Chapter 7. Global Cell Therapy Consumables Market – By Distribution Channel
- 7.1 Segment Overview
- 7.1.1 Volume & Revenue Split by Channel (2024 & 2032)
- 7.1.2 Channel Mix Evolution (2024-2032)
Chapter 8. Regional Market Analysis – Global Overview
- 8.1 Global Regional Overview
- 8.1.1 Regional Volume Share
- 8.1.2 Regional Revenue Share
- 8.1.3 Regional Volume by Region
- 8.1.4 Regional Revenue by Region
- 8.1.5 Regional Forecast Through 2032
- 8.2 Cross-Regional Segment Analysis
- 8.2.1 By Distribution Channel
- 8.2.2 By Brand/Price Tier
Chapter 9. North America Cell Therapy Consumables Market
- 9.1 United States
- 9.2 Canada
- 9.3 Mexico
Chapter 10. Europe Cell Therapy Consumables Market
- 10.1 Germany
- 10.2 France
- 10.3 Italy
- 10.4 United Kingdom
- 10.5 Spain
- 10.6 Poland
- 10.7 Russia
- 10.8 Netherlands
- 10.9 Belgium
- 10.10 Sweden
- 10.11 Denmark
- 10.12 Norway
- 10.13 Rest of Europe
Chapter 11. Asia Pacific Cell Therapy Consumables Market
- 11.1 China
- 11.2 India
- 11.3 Japan
- 11.4 South Korea
- 11.5 Thailand
- 11.6 Indonesia
- 11.7 Vietnam
- 11.8 Malaysia
- 11.9 Australia
- 11.10 Rest of Asia Pacific
Chapter 12. Latin America Cell Therapy Consumables Market
- 12.1 Brazil
- 12.2 Argentina
- 12.3 Colombia
- 12.4 Chile
- 12.5 Rest of Latin America
Chapter 13. Middle East Cell Therapy Consumables Market
- 13.1 Saudi Arabia
- 13.2 United Arab Emirates
- 13.3 Turkey
- 13.4 Israel
- 13.5 Iran
- 13.6 Rest of the Middle East
Chapter 14. Africa Cell Therapy Consumables Market
- 14.1 South Africa
- 14.2 Egypt
- 14.3 Nigeria
- 14.4 Morocco
- 14.5 Rest of Africa
Chapter 15. Cell Therapy Consumables Company Profiles
- 15.1 [Company 01]
- 15.1.1 Company Overview
- 15.1.2 Key Management Personnel
- 15.1.3 Products & Services Portfolio
- 15.1.4 Financial Performance
- 15.1.5 Key Market Focus & Geographic Presence
- 15.1.6 Recent Developments & Strategic Initiatives
Note: The company profile list is preliminary and may change based on research findings, market developments, data availability, and client requirements.
Chapter 16. Appendices
- Appendix A – List of Abbreviations & Acronyms
- Appendix B – Industry Classification Code Reference – Full Series
- Appendix C – Production & Capacity Data Tables
- Appendix D – End-Use & Demand Base Tables
- Appendix E – Consumption & Replacement Rate Assumptions
- Appendix F – ASP Reference Tables
- Appendix G – Manufacturing & Facility Database
- Appendix H – Import-Export Data Tables
- Appendix I – Regulatory Summary Tables
- Appendix J – Primary Research Participant List (Anonymized)
- Appendix K – Primary Research Questionnaire Framework
- Appendix L – Data Sources & Bibliography
- Appendix M – Market Size Divergence & Source Comparison
Chapter 17. Research Methodology
- 17.1 Research Framework & Philosophy
- 17.2 Secondary Research – Sources, Hierarchy & Data Extraction
- 17.3 Data Modeling – Bottom-Up & Top-Down Market Sizing
- 17.4 Primary Research – Stakeholder Framework, LOI & Sample Sizes
- 17.5 Forecast Methodology – Regression, Scenario & Sensitivity Analysis
- 17.6 Quality Control – Four-Layer Validation Framework
- 17.7 Limitations & Standard Assumptions
- 17.8 Disclaimer
