
Market overview
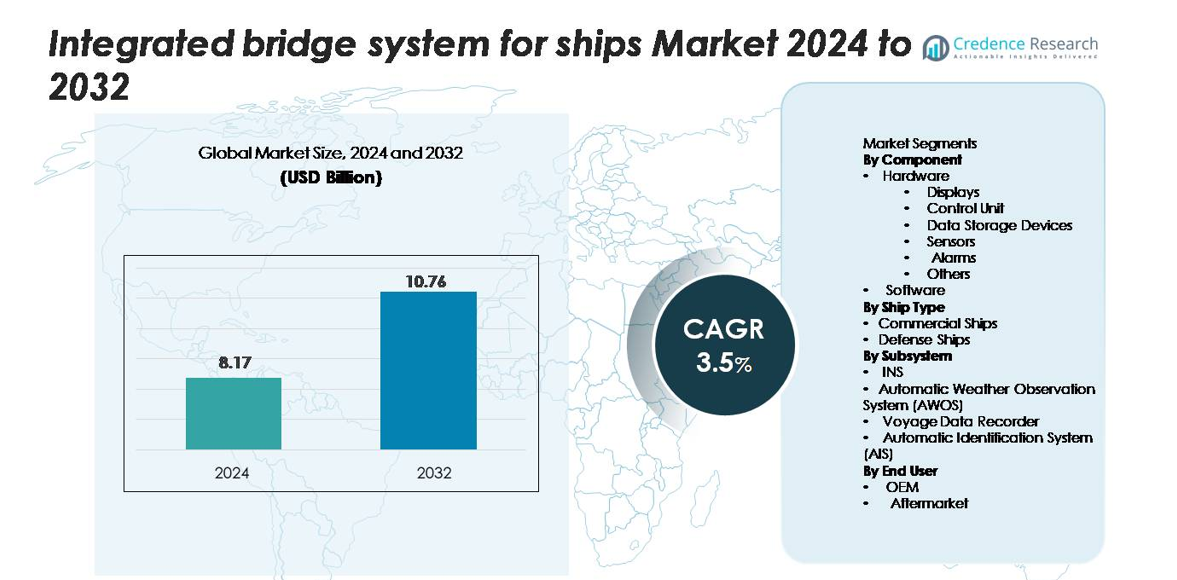
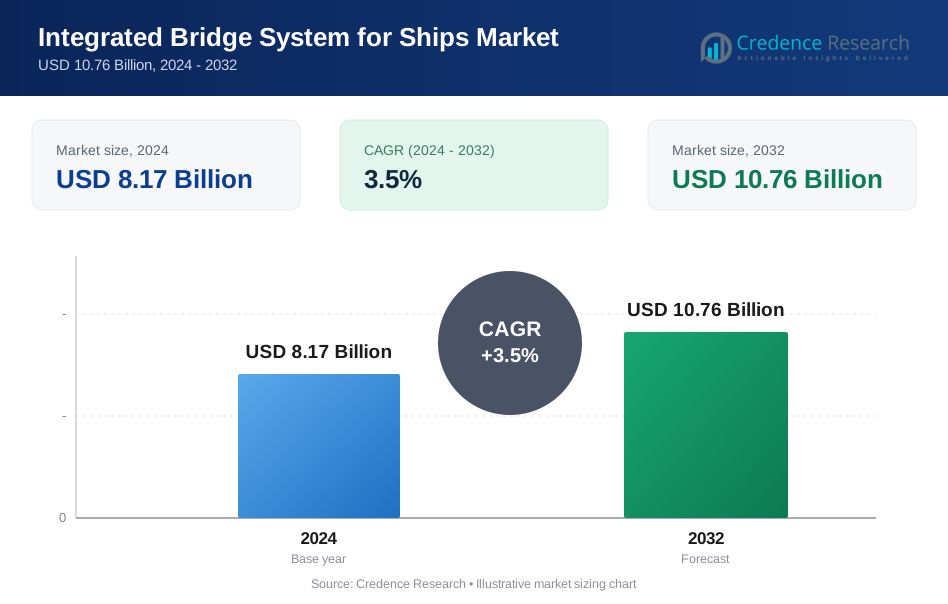
Integrated Bridge System for Ships market size was valued at USD 8.17 Billion in 2024 and is anticipated to reach USD 10.76 Billion by 2032, growing at a CAGR of 3.5% during the forecast period.
| REPORT ATTRIBUTE | DETAILS |
|---|---|
| Historical Period | 2020-2023 |
| Base Year | 2024 |
| Forecast Period | 2025-2032 |
| Integrated Bridge System for Ships Market Size 2024 | USD 8.17 Billion |
| Integrated Bridge System for Ships Market, CAGR | 3.5% |
| Integrated Bridge System for Ships Market Size 2032 | USD 10.76 Billion |
Key players in the Integrated Bridge System market include prominent navigation and automation providers such as Kongsberg Gruppen, Wartsila, Furuno Electric, Northrop Grumman, Raytheon Technologies, and Consilium Marine. These companies compete through advanced radar integration, multi-function displays, secure communication systems, and AI-based route optimization. Strategic partnerships with shipyards and fleet operators strengthen their position across commercial and defense vessels. Asia Pacific leads the market with the highest share at 42%, supported by strong shipbuilding activity in China, South Korea, and Japan. Europe and North America follow, driven by regulatory compliance, retrofit programs, and investments in digital and autonomous navigation technologies.
Market Insights
- Integrated Bridge System for ships market was valued at USD 8.17 Billion in 2024 and is expected to reach USD 10.76 Billion by 2032, growing at a CAGR of 3.5%.
- Advanced navigation safety standards and fleet modernization drive strong demand for integrated hardware such as displays, control units, and sensors, making hardware the leading component segment with the largest revenue share.
- AI-enabled navigation, real-time analytics, and cyber-secure communication are key trends, with major players investing in automation and remote monitoring to support smart and autonomous vessels.
- High system installation and maintenance costs act as a restraint, slowing adoption among smaller operators, while training and skill gaps limit effective system utilization.
- Asia Pacific leads the market with a 42% share, followed by Europe and North America, while commercial ships remain the dominant ship type due to large fleet size and rising retrofit activities.
Market Segmentation Analysis:
By Component
Hardware represents the dominant share of the Integrated Bridge System market, driven by growing demand for advanced displays, sensors, and control units that improve navigation accuracy and vessel safety. Displays and multifunction consoles lead adoption because ship operators require real-time situational awareness and reduced human error during operations. Rising installation of alarms and data storage devices strengthens fleet monitoring and compliance with maritime safety mandates. Software adoption also rises, supported by digital automation, navigation data processing, and integration of analytics. However, hardware remains the largest contributor to revenue due to high installation costs and continuous technological upgrades.
- For instance, Kongsberg’s K-Bridge system is a scalable Integrated Bridge System (IBS) designed to integrate inputs from numerous onboard sensors, such as position, heading, speed, depth, and radar data, to provide seamless situational awareness. The system utilizes one or more Navigation Sensor Integrator (SINT) units, which each provide 16 (optionally 20 or 24) serial line channels and 64 configurable I/O channels for sensor connections.
By Ship Type
Commercial ships account for the largest market share as global trade expansion drives higher deployment of modern navigation and automation systems. Cargo carriers, container ships, and passenger vessels require integrated bridge platforms to streamline decision-making and meet safety and emission standards. Increased production of new commercial vessels and retrofit projects in aging fleets support segment growth. Defense ships also adopt integrated bridge solutions for mission planning, surveillance, and secure navigation. However, commercial vessels dominate due to their larger fleet volume and continuous investment in fuel efficiency and operational optimization.
- For instance, Wärtsilä’s NACOS Platinum bridge on large container ships merges radar, ECDIS, and propulsion control, processing over 30,000 navigation data points per minute to support real-time route optimization
By Subsystem
INS (Integrated Navigation System) holds the dominant share among subsystems, supported by mandatory navigation requirements and increased automation of ship control functions. INS combines radar, GPS, autopilot, and sensors to reduce crew workload and improve route accuracy. Voyage data recorders and AIS also see rising integration as ports and maritime regulators enforce tracking and reporting standards. Automatic Weather Observation Systems gain attention for weather-based decision support, especially on long-route commercial vessels. Despite broader subsystem adoption, INS maintains the largest share because it forms the core of bridge integration and vessel situational awareness.
Key Growth Drivers
Rising Demand for Advanced Navigation and Safety Systems
Maritime operators invest in integrated bridge systems to enhance vessel safety, reduce crew workload, and comply with stricter international navigation standards. Ports and regulatory bodies require automated route planning, collision avoidance, and remote monitoring to limit human error and improve operational reliability. Commercial fleets and cruise operators rely on real-time data displayed through multifunction consoles, radar integration, and alarm management to avoid accidents in congested shipping lanes. Digital sensors and control units help detect threats early, improving situational awareness during harsh weather and night navigation. The push toward autonomous or semi-autonomous ships also fuels demand for smart navigation technologies. As maritime trade expands and vessel sizes increase, shipowners prefer integrated platforms over standalone systems due to higher efficiency, consistent data flow, and improved decision-making.
- For instance, Furuno’s FAR-3000 series can detect small targets at ranges up to 96 nautical miles, giving operators earlier hazard detection.
Growing Fleet Modernization and Retrofit Activities
Aging vessels and outdated navigation systems push shipowners toward modernization initiatives across global fleets. Retrofit demand rises as operators upgrade older ships to meet safety regulations without investing in new builds. Installing integrated bridge systems supports fuel savings, route optimization, and emissions reduction, helping operators comply with IMO and SOLAS requirements. Shipyards and service providers now offer modular and scalable upgrade solutions, making retrofits faster and cost-effective. Commercial shipping companies focus on replacing legacy radar, control units, and manual systems with touchscreen displays, digital autopilot, and advanced sensors to reduce crew fatigue. Defense agencies also initiate modernization programs to enhance surveillance, navigation security, and mission control. Increased investments in smart ports further reinforce the need for compatible, interoperable bridge systems across fleets.
- For instance, Kongsberg’s K-Bridge retrofit kits have been installed in under 10 days on coastal cargo vessels, enabling faster return to service.
Growth of Autonomous and Digital Shipping Technologies
The shift toward autonomous navigation drives adoption of integrated bridge systems equipped with AI-enabled decision support, automated route planning, and real-time data analytics. Smart ships depend on interconnected subsystems that allow remote monitoring, predictive maintenance, and automated docking capabilities. Satellite communication and cloud-connected software platforms enhance fleet control and enable centralized command centers. As shipping companies pursue unmanned operations to reduce operational costs and human error, integrated bridge platforms become a core technology foundation. Several maritime nations support automation trials, encouraging installation of digital sensors, electronic chart systems, and advanced autopilot solutions. This trend continues to generate long-term demand, especially from commercial fleets exploring cost efficiency, fuel savings, and sustainable shipping practices.
Key Trends & Opportunities
Integration of AI, IoT, and Real-Time Analytics
A major trend is the integration of AI-based analytics, IoT sensors, and machine learning to support predictive navigation. Smart data processing enhances route planning, weather forecasting, and collision avoidance. Cloud-enabled monitoring allows shipowners to track vessel health, cargo conditions, and performance remotely. This creates new opportunities for analytics-driven software upgrades and subscription-based maritime services. Digital twin technology also emerges, enabling simulation of ship behavior and maintenance requirements. As fleets digitize operations, vendors offering connected bridge platforms and cybersecurity-protected data solutions stand to gain.
- For instance, Wärtsilä’s Fleet Optimisation Solution (FOS) collects a wealth of real-time data from various onboard and external sources to recommend safer routing and cut fuel usage
Increased Adoption of Cyber-Resilient Systems
Cybersecurity becomes a critical focus area due to rising cyber threats targeting navigation and communication systems. Operators demand encrypted data storage, firewall-protected software, and secure automatic identification to prevent unauthorized access. Governments enforce maritime cybersecurity compliance, pushing shipyards and OEMs toward secure-by-design bridge architectures. This trend creates opportunities for companies offering advanced cyber-defense modules, intrusion detection systems, and continuous update support. The shift ensures safe, uninterrupted navigation and helps fleets meet strict global cyber guidelines.
- For instance, Wärtsilä’s Cyber Operations Centre handled over 50 million security events in a single year and flagged anomalies for remote corrective action.
Key Challenges
High Installation and Maintenance Costs
Integrated bridge systems require expensive hardware, software licenses, and technical expertise, making adoption difficult for small shipowners. Installation involves complex integration of sensors, displays, radars, and control units, often requiring vessel downtime. Retrofit projects can cost more due to system compatibility issues with older ships. Ongoing software updates, cybersecurity protection, and equipment calibration further increase operational spending. These cost barriers slow adoption, particularly in developing regions with budget-constrained operators and smaller commercial fleets.
Lack of Skilled Operators and Training Gaps
Despite automation, crew members must understand system interfaces, diagnostics, and emergency controls. Many fleets face skill shortages, especially in regions with limited maritime training infrastructure. A sudden shift from manual navigation to digital systems creates a learning gap that can lead to operational errors. Training programs and simulation systems increase cost and time commitments for shipowners. Without standardized training, vessels struggle to maximize system performance and safety benefits. Ensuring qualified personnel remains a major challenge for widespread integrated bridge system adoption.
Regional Analysis
North America
North America holds a significant share of the Integrated Bridge System market, driven by high adoption across commercial and naval fleets. The United States invests heavily in advanced navigation, cybersecurity, and automation technologies to support large defense and cargo vessel operations. Strict compliance with maritime safety regulations encourages shipowners to upgrade control units, displays, and integrated navigation software. Retrofit demand remains strong as older ships transition to digital systems. With leading technology providers and strong shipbuilding support, North America continues to expand market penetration and maintains a competitive position in smart maritime infrastructure.
Europe
Europe commands a notable portion of market revenue due to the presence of major shipbuilding nations and strong regulatory enforcement. Countries such as Germany, Norway, France, and the Netherlands invest in fuel-efficient and digitized vessels to meet emission and safety standards. Growing demand for cruise ships, research vessels, and commercial fleets fuels integrated bridge system installations. European ports also support digital navigation infrastructure, creating strong retrofit opportunities. The region benefits from innovation in radar systems, voyage data recorders, and cyber-secure control platforms, positioning Europe as a technology leader and a major contributor to global system adoption.
Asia Pacific
Asia Pacific holds the largest market share, supported by large-scale commercial shipbuilding in China, South Korea, and Japan. Rapid expansion of maritime trade and fleet modernization drives strong demand for integrated bridge platforms across cargo carriers, tankers, and passenger vessels. Regional governments strengthen safety rules and port digitalization, encouraging installation of advanced navigation systems. Rising investments in autonomous vessels and smart ports also contribute to market growth. Asia Pacific’s competitive manufacturing base and high-volume exports reinforce adoption, making the region the fastest-growing and most influential contributor to industry revenue.
Middle East & Africa
Middle East & Africa shows steady expansion with growing demand for vessel modernization, especially across oil tankers, offshore vessels, and defense fleets. Countries such as UAE, Saudi Arabia, and South Africa invest in digital navigation to improve maritime security, fuel efficiency, and fleet monitoring. Port modernization initiatives and increased trade through the Suez Canal improve adoption of integrated display consoles, sensors, and voyage recorders. While the market size remains smaller compared with Asia Pacific and Europe, rising commercial shipping activities and regional naval upgrades continue to create a positive outlook.
Latin America
Latin America records gradual growth, driven by expanding commercial shipping across Brazil, Mexico, and Chile. Operators focus on modernizing vessels used for oil and gas transport, fishing, and intercontinental freight. Integrated bridge systems gain traction as ports adopt digital navigation standards and enforce safety compliance. Retrofit projects rise as older fleets replace standalone radar and manual navigation with centralized digital consoles. However, limited defense spending and high installation costs slow adoption in smaller fleets. Despite challenges, maritime trade expansion and port modernization support ongoing integration across the region.
Market Segmentations:
By Component
- Hardware
- Displays
- Control Unit
- Data Storage Devices
- Sensors
- Alarms
- Others
- Software
By Ship Type
- Commercial Ships
- Defense Ships
By Subsystem
- INS
- Automatic Weather Observation System (AWOS)
- Voyage Data Recorder
- Automatic Identification System (AIS)
By End User
- OEM
- Aftermarket
By Geography
- North America
- U.S.
- Canada
- Mexico
- Europe
- Germany
- France
- U.K.
- Italy
- Spain
- Rest of Europe
- Asia Pacific
- China
- Japan
- India
- South Korea
- South-east Asia
- Rest of Asia Pacific
- Latin America
- Brazil
- Argentina
- Rest of Latin America
- Middle East & Africa
- GCC Countries
- South Africa
- Rest of the Middle East and Africa
Competitive Landscape
The competitive landscape of the Integrated Bridge System market includes global technology providers, shipbuilders, and software innovators competing to deliver advanced navigation, automation, and cybersecurity solutions. Leading companies focus on integrated hardware platforms that combine radar, autopilot, GPS, and sensor networks into a unified control console. Strategic partnerships with shipyards and fleet operators help vendors expand retrofit and new-build installations. Many players invest in AI-driven analytics, real-time monitoring, and cloud-based fleet management to enhance decision-making and reduce human error. Cybersecurity integration becomes a major differentiator as shipowners prioritize protected data storage and secure communication. Market competition also expands through service agreements, training support, and modular product lines designed for commercial and defense fleets. With rising adoption of digital and autonomous shipping, competitive pressure continues to shift toward high-tech systems, remote operations, and compliance-focused solutions.
Key Player Analysis
- Mitsubishi Electric Corporation
- Northrop Grumman Corporation
- Furuno Electric Co., Ltd.
- Rolls-Royce plc
- L3Harris Technologies, Inc.
- Wartsila Corporation
- Kongsberg Gruppen
Recent Developments
- In September 2025, Rolls-Royce launched the new mtu NautIQ Bridge, an integrated bridge solution for serial-production yachts (30-40 m), emphasizing scalability, AI integration and future-ready navigation systems.
- In July 2025, Wärtsilä Corporation inaugurated advanced dual-fuel simulation suites for the Akademi Laut Malaysia (ALAM) training institute, integrating its ship‐bridge and propulsion simulation tools to train crews on future fuel scenarios and digital bridge operations.
Report Coverage
The research report offers an in-depth analysis based on Component, Ship type, Subsystem, End-User and Geography. It details leading market players, providing an overview of their business, product offerings, investments, revenue streams, and key applications. Additionally, the report includes insights into the competitive environment, SWOT analysis, current market trends, as well as the primary drivers and constraints. Furthermore, it discusses various factors that have driven market expansion in recent years. The report also explores market dynamics, regulatory scenarios, and technological advancements that are shaping the industry. It assesses the impact of external factors and global economic changes on market growth. Lastly, it provides strategic recommendations for new entrants and established companies to navigate the complexities of the market.
Future Outlook
- Adoption of autonomous and semi-autonomous vessels will increase demand for fully integrated navigation platforms.
- Commercial fleets will continue upgrading aging vessels with digital bridge systems to improve efficiency and safety.
- AI-enabled route optimization and real-time analytics will enhance decision-making and reduce human errors.
- Cybersecurity-enhanced bridge systems will become a mandatory requirement for global fleet operations.
- Cloud-based remote monitoring will support centralized fleet control and maintenance planning.
- Smart ports and digital shipping corridors will push vessels to adopt highly interoperable navigation systems.
- Defense fleets will expand investments in advanced bridge technologies for mission security and surveillance.
- Growth in cruise and passenger shipping will accelerate adoption of advanced displays and automated control units.
- Integration with weather analytics and predictive alerts will support safer long-distance navigation.
- Modular and scalable system designs will increase retrofit demand across small and mid-size vessels.
Request a Free Sample
Fill in your details and we'll send you a free sample report.
- Sample data tables & charts
- Research methodology
Need a Custom Version of This Report?
Tailor the scope, geography, or segments to your exact requirements.
- Custom geography or segment scope
- Direct access to our analyst team
Frequently Asked Questions
What is the current market size for the Integrated Bridge System for Ships market, and what is its projected size in 2032?
At what Compound Annual Growth Rate is the Integrated Bridge System for Ships market projected to grow between 2025 and 2032?
Which Integrated Bridge System segment held the largest share in 2024?
What are the primary factors fueling the growth of the Integrated Bridge System for Ships market?
Who are the leading companies in the Integrated Bridge System for Ships market?
Table of Content
Chapter 1. Report Introduction
- 1.1 Report Description & Purpose
- 1.1.1 Report Title & Market Definition
- 1.1.2 Unique Selling Propositions (USP) & Key Differentiators
- 1.1.3 Value Proposition for Stakeholders
- 1.2 Research Objectives
- 1.2.1 Market Sizing Objectives (Volume & Revenue)
- 1.2.2 Segmentation Objectives
- 1.2.3 Competitive Intelligence Objectives
- 1.2.4 Forecast & Scenario Objectives
- 1.3 Report Scope
- 1.3.1 Integrated Bridge System for Ships Scope – Types & Subtypes Covered
- 1.3.2 Geographic Scope – Regions & Countries Covered
- 1.3.3 Historical Period, Base Year & Forecast Period (2024; forecast to 2032)
- 1.3.4 Inclusions & Exclusions
- 1.4 HS Code & Classification Framework
- 1.5 Currency, Units & Pricing Basis
- 1.6 Target Stakeholders
- 1.7 Limitations & Assumptions
Chapter 2. Executive Summary
- 2.1 Global Integrated Bridge System for Ships Market Snapshot
- 2.1.1 Market Size – Historical (2024) & Forecast (2024-2032) (2024: USD 8.17 Billion → 2032: USD 10.76 Billion)
- 2.1.2 Volume & Revenue – Global Totals
- 2.1.3 Key Market Highlights – Top Five Facts
- 2.2 Integrated Bridge System for Ships Market Segmentation Snapshot
- 2.2.1 Market Split by Region – 2024 vs. 2032
- 2.3 Competitive Snapshot
- 2.3.1 Top 10 Players by Revenue Share – 2024
- 2.3.2 Top 10 Players by Volume Share – 2024
- 2.3.3 Recent Strategic Developments (18-Month Summary)
- 2.4 Key Investment Highlights & Strategic Conclusions
Chapter 3. Integrated Bridge System for Ships Market Dynamics & Industry Analysis
- 3.1 Market Overview & Context
- 3.1.1 Integrated Bridge System for Ships Market Position in the Broader Automotive Value Chain
- 3.1.2 OEM vs. Replacement Market Dynamics
- 3.1.3 Market Maturity & Development Stage by Region
- 3.2 Integrated Bridge System for Ships Market Drivers
- 3.3 Integrated Bridge System for Ships Market Restraints & Challenges
- 3.4 Integrated Bridge System for Ships Market Opportunities
- 3.5 Porter's Five Forces Analysis
- 3.5.1 Threat of New Entrants
- 3.5.2 Bargaining Power of Suppliers
- 3.5.3 Bargaining Power of Buyers
- 3.5.4 Threat of Substitutes
- 3.5.5 Competitive Rivalry – Intensity Assessment
- 3.6 Integrated Bridge System for Ships Value Chain Analysis
- 3.6.1 Upstream – Raw Material/Input Suppliers
- 3.6.1.1 Raw Material/Input 1
- 3.6.1.2 Raw Material/Input 2
- 3.6.1.3 Raw Material/Input 3
- 3.6.2 Midstream – Production/Manufacturing/Service Delivery
- 3.6.2.1 Production/Process Overview
- 3.6.2.2 Key Facility Locations & Capacity by Manufacturer
- 3.6.3 Downstream – Distribution & End Consumer
- 3.6.3.1 Primary Channel – B2B/OEM
- 3.6.3.2 Secondary Channels – Dealer, Retail, Online, Direct
- 3.6.4 Value Chain Profitability Analysis
- 3.6.1 Upstream – Raw Material/Input Suppliers
- 3.7 PESTEL Analysis
- 3.7.1 Political Factors
- 3.7.2 Economic Factors
- 3.7.3 Social Factors
- 3.7.4 Technological Factors
- 3.7.5 Environmental Factors
- 3.7.6 Legal Factors
- 3.8 Integrated Bridge System for Ships Supply Chain Analysis
- 3.8.1 Raw Material/Input Supply Risk Assessment
- 3.8.2 Manufacturing Concentration Risk (Geographic Exposure)
- 3.8.3 Trade Disruption Impact Analysis
- 3.9 Regulatory & Policy Landscape
Note: The regulatory and policy landscape section covers regulations based on their applicability to the market, Integrated Bridge System for Ships category, geography, and scope of the study. Only regulatory frameworks with a material impact on operations, compliance, trade, sustainability, or market access are analyzed in detail.
Chapter 4. Key Investment Pockets & Opportunity Analysis
- 4.1 Integrated Bridge System for Ships Market Attractiveness Analysis
- 4.1.1 By Region – Investment Attractiveness Matrix (Volume × CAGR)
- 4.2 Absolute Revenue Growth Opportunity
- 4.2.1 By Region – Absolute USD Growth Through 2032
- 4.3 Incremental Volume Opportunity
- 4.3.1 By Region – Incremental Volume Through 2032
- 4.3.2 Segment – Incremental Volume
- 4.4 Emerging Submarket Opportunity Deep Dive (Subject to Applicability)
- 4.5 Emerging Market Opportunity Scorecards
- 4.5.1 United States
- 4.5.2 Europe
- 4.5.3 Asia
- 4.5.4 Middle East & Africa
Note: Emerging Market Opportunity Scorecards will be included based on relevance and strategic importance. Regions listed are indicative and may vary depending on data availability and market dynamics.
Chapter 5. Integrated Bridge System for Ships Import-Export Analysis & Trade Flows
- 5.1 Global Trade Overview
- 5.1.1 Global Export Value by Country (2024)
- 5.1.2 Global Export Volume by Country (2024)
- 5.1.3 Global Import Value by Country (2024)
- 5.1.4 Global Import Volume by Country (2024)
- 5.1.5 Net Trade Balance by Country (2024)
- 5.2 Export Analysis – Segment
- 5.2.1 Type 1 (HS Code)
- 5.2.2 Type 2 (HS Code)
- 5.2.3 Type 3 (HS Code)
- 5.2.4 Type 4 (HS Code)
- 5.2.5 Type 5 (HS Code)
- 5.3 Import Analysis – Segment
- 5.3.1 Type 1 (HS Code)
- 5.3.2 Type 2 (HS Code)
- 5.3.3 Type 3 (HS Code)
- 5.3.4 Type 4 (HS Code)
- 5.3.5 Type 5 (HS Code)
- 5.4 Average Unit Trade Prices
- 5.4.1 Average Export Price – Segment & Country
- 5.4.2 Average Import Price – Segment & Source Country
- 5.4.3 Price Trends (2024)
- 5.5 Key Trade Route Analysis
- 5.5.1 Trade Route 1
- 5.5.2 Trade Route 2
- 5.5.3 Trade Route 3
- 5.5.4 Trade Route 4
- 5.5.5 Trade Route 5
- 5.6 Trade Policy Impact Assessment
- 5.6.1 US Anti-Dumping & Section 301 Tariffs
- 5.6.2 EU Customs Union Impact
- 5.6.3 Major Free Trade Agreements
- 5.6.4 USMCA Rules of Origin
Note: Trade policy analysis will be included only where relevant to the Integrated Bridge System for Ships market.
Chapter 6. Competitive Landscape & Company Benchmarking
- 6.1 Integrated Bridge System for Ships Market Concentration & Structure
- 6.1.1 Herfindahl-Hirschman Index (HHI) – vs. 2024
- 6.1.2 Tier 1, Tier 2 & Tier 3 Market Structure
- 6.1.3 Global, Regional & Local Player Dynamics
- 6.2 Integrated Bridge System for Ships Market Share Analysis – 2024
- 6.2.1 Global Revenue Share by Company
- 6.2.2 Global Volume Share by Company
- 6.2.3 Regional Revenue Share
- 6.2.4 Market Share Evolution ( vs. 2024)
- 6.2.5 OEM Segment Share by Company
- 6.2.6 Replacement Segment Share by Company
- 6.3 Production/Delivery Capacity & Facility Analysis
- 6.3.1 Global Installed Capacity
- 6.3.2 Capacity Utilization Rates
- 6.3.3 Production/Output Volume
- 6.3.4 Facility Locations & Capacity Map
- 6.3.5 Planned Capacity Additions
- 6.4 Integrated Bridge System for Ships Competitive Benchmarking Matrix
- 6.4.1 Revenue, Volume, CAGR & Profitability Comparison
- 6.4.2 Channel Revenue Mix
- 6.4.3 Geographic Revenue Exposure
- 6.4.4 R&D Intensity
- 6.4.5 Sustainability Maturity
- 6.5 Strategic Developments in Integrated Bridge System for Ships (Last 24 Months)
- 6.5.1 Mergers, Acquisitions & Divestments
- 6.5.2 New Integrated Bridge System for Ships Launches
- 6.5.3 Facility Expansions
- 6.5.4 Strategic Alliances, Joint Ventures & Partnerships
- 6.5.5 Distribution Expansion & Market Entry
- 6.5.6 Sustainability & ESG Initiatives
- 6.6 Competitive Strategy Mapping
- 6.6.1 Leader, Challenger, Follower & Niche Classification
- 6.6.2 Pricing Strategy Comparison
- 6.6.3 Channel Strategy Matrix
Note: Strategic developments are included based on their materiality and the availability of reliable information.
Chapter 7. Global Integrated Bridge System for Ships Market – By Distribution Channel
- 7.1 Segment Overview
- 7.1.1 Volume & Revenue Split by Channel (2024 & 2032)
- 7.1.2 Channel Mix Evolution (2024-2032)
Chapter 8. Regional Market Analysis – Global Overview
- 8.1 Global Regional Overview
- 8.1.1 Regional Volume Share
- 8.1.2 Regional Revenue Share
- 8.1.3 Regional Volume by Region
- 8.1.4 Regional Revenue by Region
- 8.1.5 Regional Forecast Through 2032
- 8.2 Cross-Regional Segment Analysis
- 8.2.1 By Distribution Channel
- 8.2.2 By Brand/Price Tier
Chapter 9. North America Integrated Bridge System for Ships Market
- 9.1 United States
- 9.2 Canada
- 9.3 Mexico
Chapter 10. Europe Integrated Bridge System for Ships Market
- 10.1 Germany
- 10.2 France
- 10.3 Italy
- 10.4 United Kingdom
- 10.5 Spain
- 10.6 Poland
- 10.7 Russia
- 10.8 Netherlands
- 10.9 Belgium
- 10.10 Sweden
- 10.11 Denmark
- 10.12 Norway
- 10.13 Rest of Europe
Chapter 11. Asia Pacific Integrated Bridge System for Ships Market
- 11.1 China
- 11.2 India
- 11.3 Japan
- 11.4 South Korea
- 11.5 Thailand
- 11.6 Indonesia
- 11.7 Vietnam
- 11.8 Malaysia
- 11.9 Australia
- 11.10 Rest of Asia Pacific
Chapter 12. Latin America Integrated Bridge System for Ships Market
- 12.1 Brazil
- 12.2 Argentina
- 12.3 Colombia
- 12.4 Chile
- 12.5 Rest of Latin America
Chapter 13. Middle East Integrated Bridge System for Ships Market
- 13.1 Saudi Arabia
- 13.2 United Arab Emirates
- 13.3 Turkey
- 13.4 Israel
- 13.5 Iran
- 13.6 Rest of the Middle East
Chapter 14. Africa Integrated Bridge System for Ships Market
- 14.1 South Africa
- 14.2 Egypt
- 14.3 Nigeria
- 14.4 Morocco
- 14.5 Rest of Africa
Chapter 15. Integrated Bridge System for Ships Company Profiles
- 15.1 [Company 01]
- 15.1.1 Company Overview
- 15.1.2 Key Management Personnel
- 15.1.3 Products & Services Portfolio
- 15.1.4 Financial Performance
- 15.1.5 Key Market Focus & Geographic Presence
- 15.1.6 Recent Developments & Strategic Initiatives
Note: The company profile list is preliminary and may change based on research findings, market developments, data availability, and client requirements.
Chapter 16. Appendices
- Appendix A – List of Abbreviations & Acronyms
- Appendix B – Industry Classification Code Reference – Full Series
- Appendix C – Production & Capacity Data Tables
- Appendix D – End-Use & Demand Base Tables
- Appendix E – Consumption & Replacement Rate Assumptions
- Appendix F – ASP Reference Tables
- Appendix G – Manufacturing & Facility Database
- Appendix H – Import-Export Data Tables
- Appendix I – Regulatory Summary Tables
- Appendix J – Primary Research Participant List (Anonymized)
- Appendix K – Primary Research Questionnaire Framework
- Appendix L – Data Sources & Bibliography
- Appendix M – Market Size Divergence & Source Comparison
Chapter 17. Research Methodology
- 17.1 Research Framework & Philosophy
- 17.2 Secondary Research – Sources, Hierarchy & Data Extraction
- 17.3 Data Modeling – Bottom-Up & Top-Down Market Sizing
- 17.4 Primary Research – Stakeholder Framework, LOI & Sample Sizes
- 17.5 Forecast Methodology – Regression, Scenario & Sensitivity Analysis
- 17.6 Quality Control – Four-Layer Validation Framework
- 17.7 Limitations & Standard Assumptions
- 17.8 Disclaimer
