
U.S. Semiconductor Logistics Market Overview:
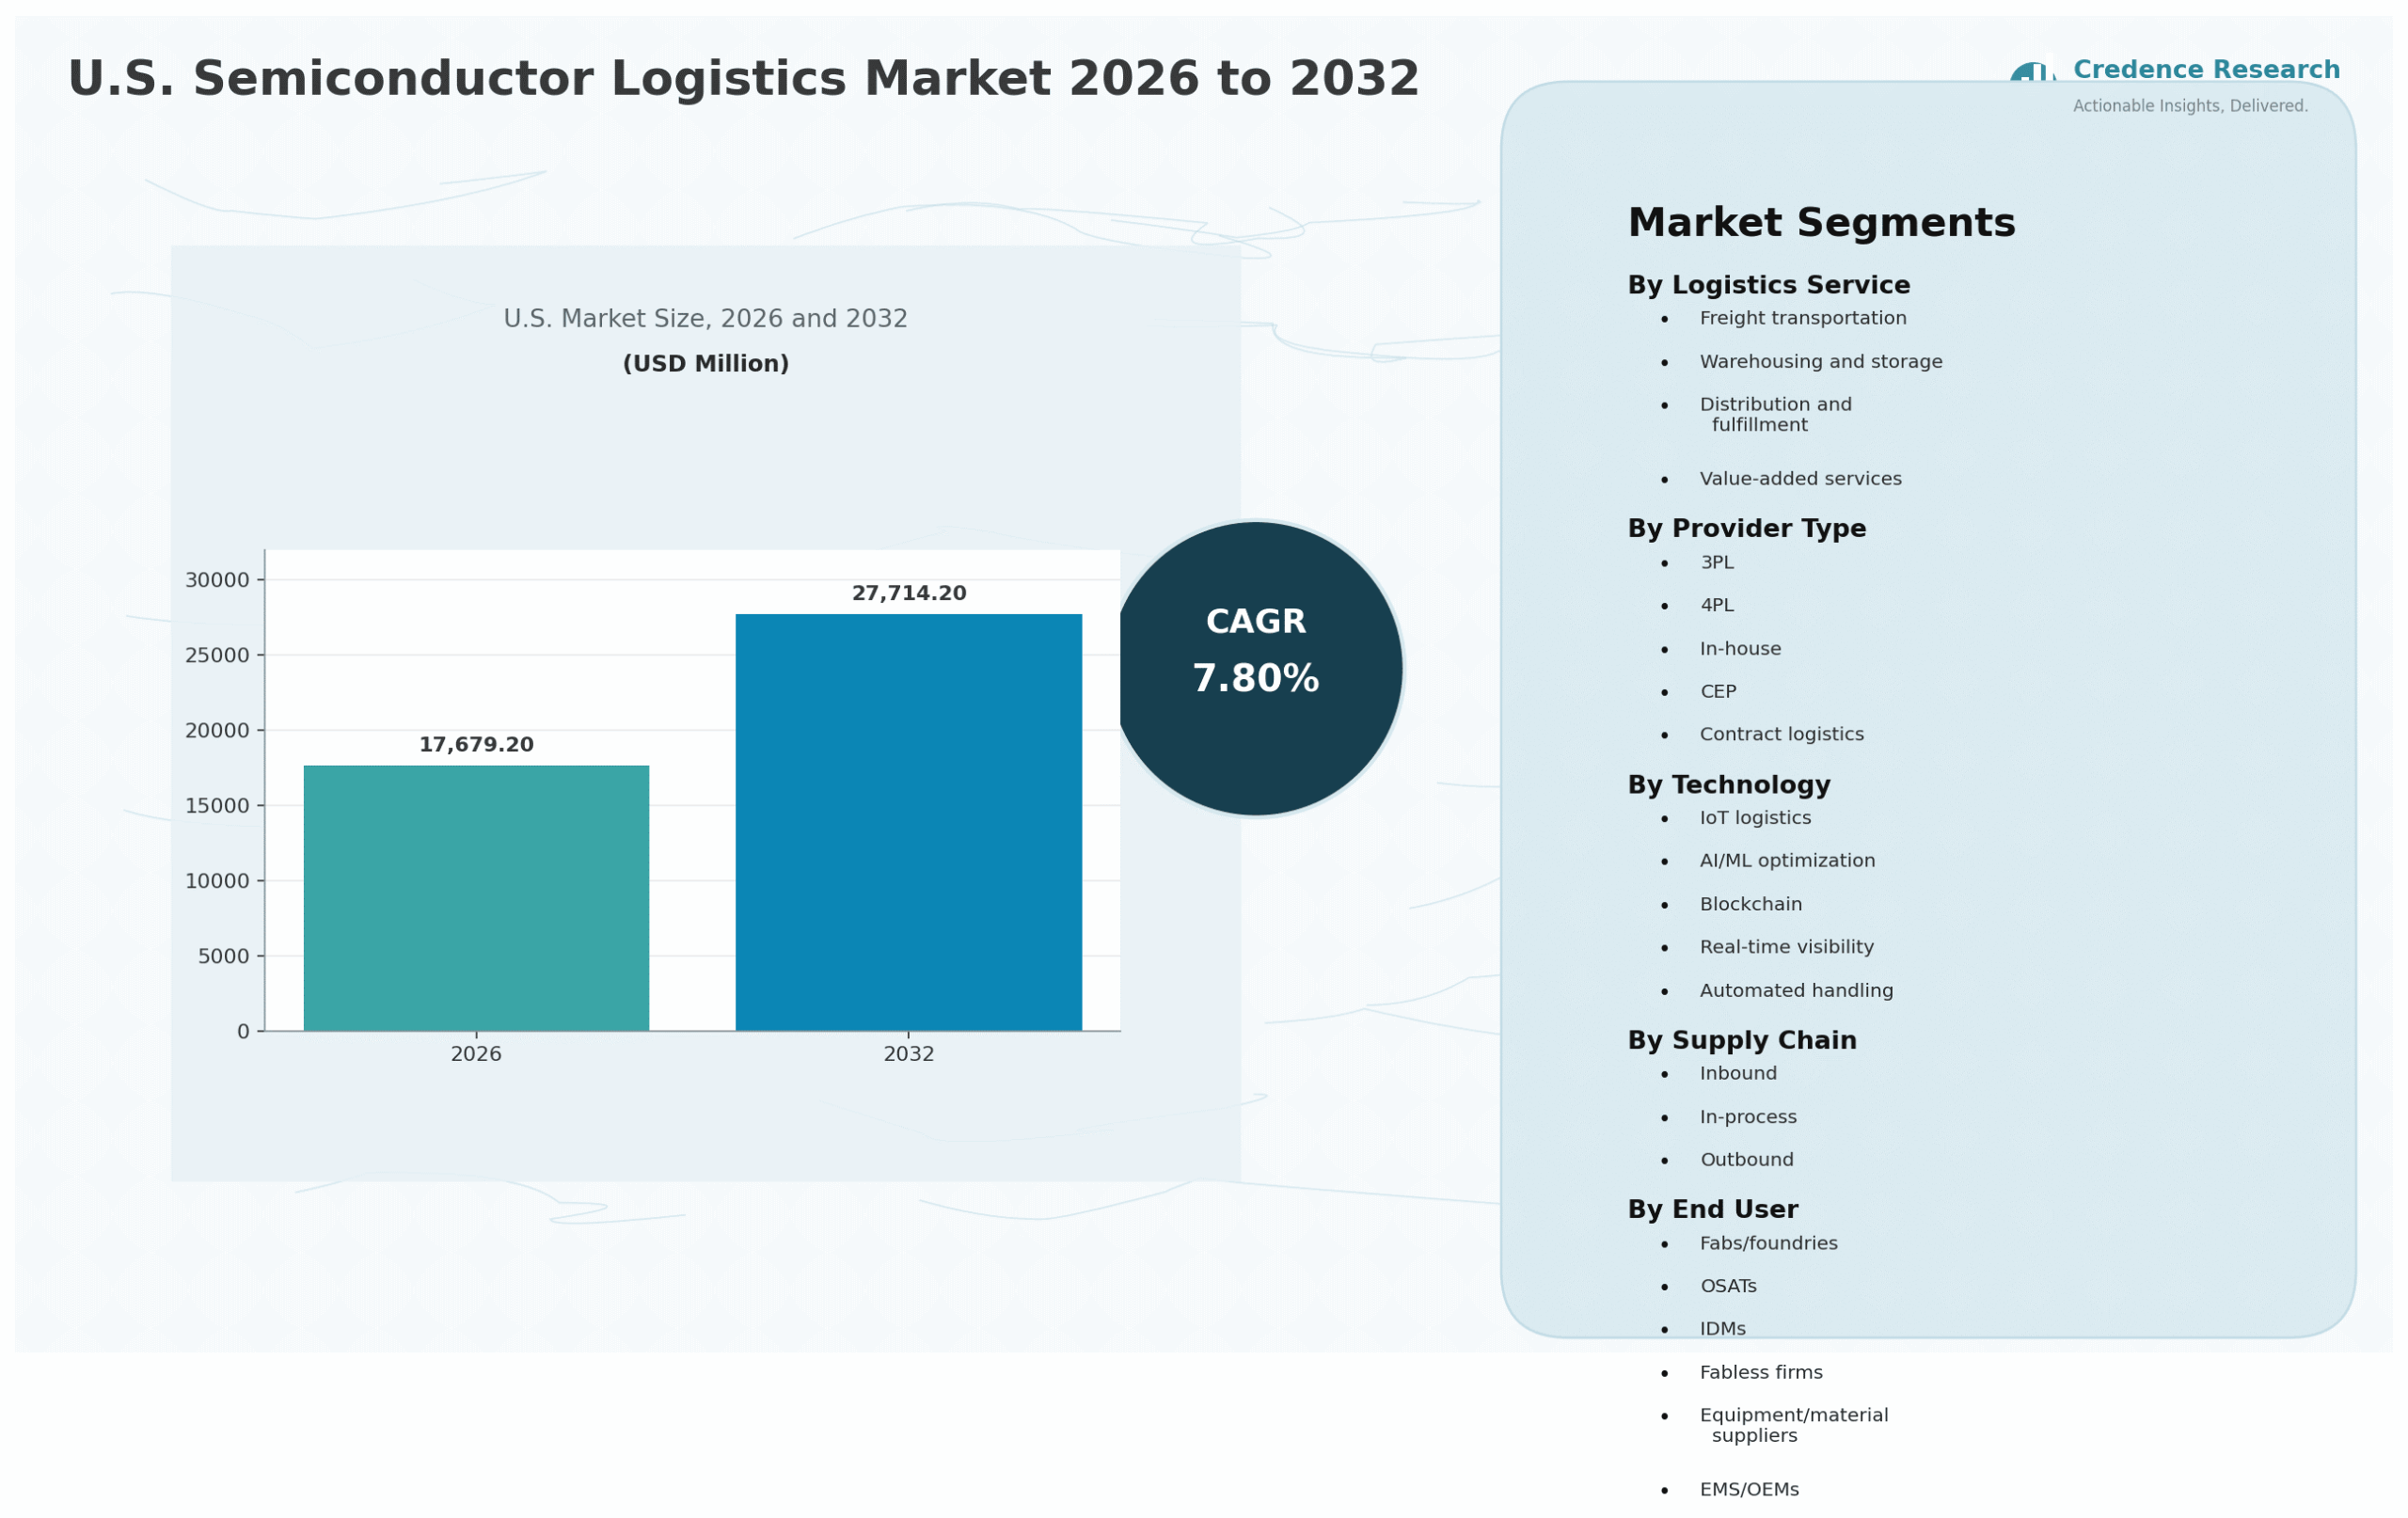
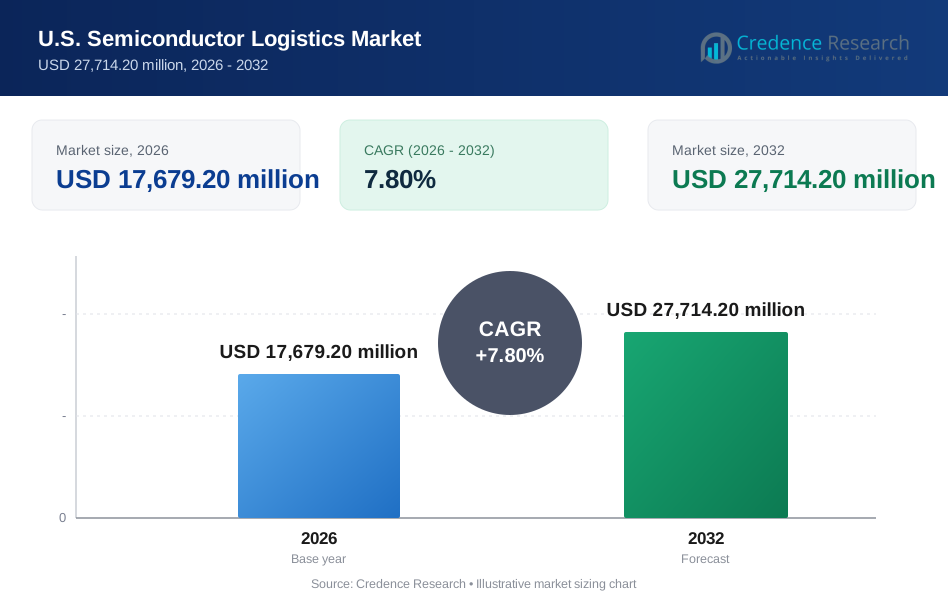
The U.S. Semiconductor Logistics Market size was valued at USD 17,679.20 million in 2026. It is anticipated to reach USD 27,714.20 million by 2032, growing at a CAGR of 7.80% during the forecast period.
| REPORT ATTRIBUTE | DETAILS |
|---|---|
| Historical Period | 2021-2025 |
| Base Year | 2026 |
| Forecast Period | 2027-2032 |
| U.S. Semiconductor Logistics Market Size 2026 | USD 17,679.20 million |
| U.S. Semiconductor Logistics Market, CAGR | 7.80% |
| U.S. Semiconductor Logistics Market Size 2032 | USD 27,714.20 million |
U.S. Semiconductor Logistics Market Insights
- Market growth is supported by CHIPS Act-driven fab reshoring, advanced packaging investment, AI chip demand, secure logistics requirements and rising need for real-time supply chain visibility.
- Freight transportation holds a strong position because semiconductor manufacturers require time-sensitive movement of wafers, chemicals, substrates, equipment, finished chips and high-value components.
- 3PL providers lead provider type demand, supported by specialized networks, controlled handling, compliance capabilities, secure transport and integrated services across inbound and outbound flows.
- The West leads the U.S. Semiconductor Logistics Market with 44% share, supported by semiconductor activity in Arizona, California, Oregon, Idaho and other western production and technology hubs.
U.S. Semiconductor Logistics Market Segment Insights
By logistics service
By logistics service, freight transportation held a strong position in 2026 because semiconductor supply chains depend on timely, secure and carefully controlled movement of high-value goods. Fabs, foundries, OSATs, IDMs and equipment suppliers require air, ocean, road and intermodal services that reduce delays and protect product integrity. Warehousing and storage also play a major role as companies localize inventory near fabs, equipment clusters and distribution hubs. Distribution and fulfillment are gaining importance as chip demand expands across AI servers, automotive electronics, industrial systems and consumer devices. Value-added services support kitting, labeling, inspection, customs documentation, packaging, returns management and controlled handoffs.
By provider type
By provider type, 3PL providers led the U.S. Semiconductor Logistics Market in 2026 because semiconductor companies require specialized logistics partners with secure facilities, trained teams and global shipment coordination. 4PL providers are gaining relevance as chip companies seek control tower services, carrier orchestration, data integration and end-to-end supply chain governance. In-house logistics remain important for large IDMs and fabs that maintain internal control over critical materials, cleanroom inputs and production-linked movement. CEP providers support urgent spare parts, samples and high-value component shipments. Contract logistics continues to grow as companies outsource warehousing, value-added handling and site support near new fab investments.
By technology
By technology, real-time visibility held a strong position in 2026 because semiconductor shipments require constant monitoring, exception management and high-confidence delivery timing. IoT logistics supports sensor-based tracking for temperature, humidity, shock, tilt and location, which helps protect wafers, tools and precision components. AI/ML optimization is gaining adoption for routing, forecasting, warehouse planning, inventory placement and disruption management. Blockchain remains a niche but relevant technology for chain-of-custody, compliance documentation and high-value shipment traceability. Automated handling is expanding in warehouses and fulfillment centers that need lower damage risk, faster throughput and better traceability.
By supply chain
By supply chain, inbound logistics held the strongest position in 2026 because fabs and foundries require reliable movement of equipment, specialty gases, chemicals, substrates, silicon wafers, photomasks and precision components. In-process logistics is gaining importance as semiconductor campuses expand and production sites require coordinated movement between cleanrooms, warehouses, testing areas and subcontractors. Outbound logistics supports finished chips, modules, packaged devices and equipment parts shipped to OEMs, EMS providers, data center suppliers and global customers. Each supply chain stage requires tight timing, documentation and secure handling. Demand is expected to grow across all stages as the U.S. semiconductor ecosystem becomes more localized and complex.
By end user
By end user, fabs/foundries held the leading position in 2026 because domestic wafer fabrication projects require extensive inbound materials, capital equipment movement, storage and secure transport. OSATs are expected to grow as advanced packaging investment expands and domestic testing and assembly capacity increases. IDMs remain major users because they manage integrated manufacturing, packaging, testing and distribution needs. Fabless firms rely on logistics partners for finished chip movement, inventory visibility and downstream fulfillment. Equipment/material suppliers create strong demand because fab construction and production require delicate, high-value and compliance-sensitive shipments. EMS/OEMs support downstream logistics for electronics, AI infrastructure, automotive systems and industrial equipment.
Key market drivers
Driver Impact Summary
| Driver | Estimated % Impact on CAGR Forecast | Geographic Relevance | Impact Timeline |
| CHIPS Act and fab reshoring | +2.8% | West, South, Northeast and Midwest | Long term |
| High-value secure/temperature-controlled logistics | +1.7% | West, South and Northeast | Medium term |
| AI chip and advanced packaging demand | +1.4% | West, South and Northeast | Long term |
| IoT visibility and predictive logistics | +1.3% | Nationwide | Medium term |
| Trade compliance complexity | +0.8% | West, South and Northeast | Long term |
CHIPS Act and fab reshoring represent the strongest growth driver for the U.S. Semiconductor Logistics Market, with an estimated +2.8% impact on the CAGR forecast. New fabs, advanced packaging sites, supplier facilities and R&D assets require specialized logistics across construction, tool move-in, cleanroom start-up and ongoing production. Semiconductor projects create demand for freight transportation, controlled warehousing, site logistics, customs support, secure shipment handling and value-added services. Reshoring also increases domestic flows between materials suppliers, fabs, OSATs, equipment vendors and end customers. Logistics providers benefit as chip companies seek partners that can manage high-value cargo, strict schedules and sensitive operating conditions. This driver will remain central through 2032 as domestic semiconductor capacity expands and supply chains localize around U.S. manufacturing clusters.
High-value secure/temperature-controlled logistics
High-value secure/temperature-controlled logistics supports market growth, with an estimated +1.7% impact on the CAGR forecast. Semiconductor shipments often include wafers, photomasks, tools, chemicals, sensors, substrates and finished chips that require controlled handling and strong chain-of-custody procedures. Temperature, shock, vibration, humidity and contamination risks can affect product quality and shipment acceptance. Logistics providers are expanding specialized services that include monitored transport, secure warehouses, validated packaging and trained handling teams. These capabilities are critical for fabs, equipment suppliers and advanced packaging companies because shipment failure can delay production and raise replacement costs. Demand will rise as chip values increase and manufacturing networks become more quality-sensitive.
AI chip and advanced packaging demand
AI chip and advanced packaging demand contributes an estimated +1.4% impact on the CAGR forecast. AI accelerators, high-bandwidth memory, advanced substrates and heterogeneous integration are increasing the value and complexity of semiconductor flows. Advanced packaging requires tighter coordination between fabs, OSATs, materials suppliers, testing partners and electronics manufacturers. These products often need faster, more secure and more visible logistics because delays can disrupt data center, cloud, automotive and high-performance computing supply chains. The expansion of AI infrastructure in the U.S. is also increasing downstream logistics needs for chips, servers and related equipment. This driver will support demand for logistics providers that can handle time-sensitive, high-value and compliance-heavy semiconductor movements.
IoT visibility and predictive logistics
IoT visibility and predictive logistics support market expansion, with an estimated +1.3% impact on the CAGR forecast. Semiconductor companies need accurate shipment data to manage production schedules, prevent line-down risks and reduce inventory buffers. IoT sensors provide location, temperature, humidity, shock and tilt data that help logistics teams detect exceptions before they become costly failures. Predictive analytics can improve routing, carrier selection, arrival-time accuracy and warehouse planning. These tools also support auditability and customer confidence for high-value and regulated shipments. Logistics providers that integrate visibility platforms with control tower operations will gain an advantage as customers demand data-driven supply chain performance.
Trade compliance complexity
Trade compliance complexity contributes an estimated +0.8% impact on the CAGR forecast. Semiconductor supply chains involve export controls, dual-use rules, tariffs, restricted-party screening, country-of-origin tracking and customs documentation. Compliance requirements increase as governments focus on strategic technologies, AI chips and advanced manufacturing equipment. Logistics providers must help customers manage documentation accuracy, shipment classification and cross-border controls. Delays caused by compliance errors can disrupt fab schedules, equipment installation and customer delivery commitments. This driver will sustain demand for value-added services, customs brokerage, compliance consulting and secure documentation platforms.
Key Trends and Opportunities
Expansion of fab-adjacent logistics hubs
Fab-adjacent logistics hubs are becoming a major opportunity in the U.S. semiconductor logistics landscape because new clusters in Arizona, Texas, Oregon, Idaho, and New York are increasing the need for nearby storage, tool staging, secure spare-parts handling, customs coordination, and just-in-time delivery that can support tightly sequenced fab operations without exposing sensitive materials and equipment to unnecessary transport risk.
This opportunity is strongest where fabs, equipment vendors, materials suppliers, and outsourced assembly and test partners are concentrating in the same geography, since the Semiconductor Industry Association’s ecosystem map shows that semiconductor production depends on a broad network of fabrication, equipment, materials, and OSAT activity rather than a single plant acting in isolation.
The clearest proof of how fast this need is scaling comes from TSMC, which CNBC reported had already pledged 165 billion dollars in U.S. investment and expanded its Arizona land position from an original 1,100 acres by acquiring an additional 900-acre plot, a scale that strongly favors early development of semiconductor-ready warehousing and response infrastructure around the fab campus. Providers that invest early in secure, controlled, semiconductor-trained facilities near these buildouts will be better positioned to win long-term embedded roles rather than one-off transport assignments.
Growth of control tower and 4PL models
Control tower and 4PL models are gaining relevance because semiconductor companies now need a single governance layer that can coordinate inbound materials, high-value equipment moves, customs brokerage, warehousing, carrier performance, and outbound product flows across increasingly fragmented domestic and international networks without losing visibility when schedules or compliance conditions change.
Kuehne+Nagel describes 4PL as integrated logistics management and supply chain control tower visibility orchestrated from a single data-driven platform, which aligns closely with semiconductor customers’ need to reduce exception-response time, synchronize production with logistics execution, and avoid inventory misalignment that can shut down high-cost manufacturing lines.
The business case for this model strengthens as ecosystem density rises, and Arizona alone illustrates that shift: Senator Mark Kelly stated that since passage of the CHIPS and Science Act, more than 102 billion dollars in private investment from more than 40 semiconductor industry projects had been announced in the state, creating the type of multi-node operating environment where fragmented vendor management becomes increasingly inefficient.
In that context, providers that combine analytics, accountability, and cross-partner orchestration are positioned to capture higher-value contracts because customers are no longer buying transportation alone; they are buying coordinated execution tied directly to fab continuity and supply resilience.
Secure logistics for AI and advanced packaging ecosystems
Secure logistics for AI and advanced packaging ecosystems creates strong opportunities across high-value chip flows, testing networks and data center supply chains. AI chips and advanced packaging components require tighter custody, faster delivery and stronger monitoring than many standard electronics shipments. U.S. investments in packaging and AI infrastructure will increase logistics demand from OSATs, fabs, cloud providers, EMS companies and equipment suppliers. Temperature-controlled and shock-monitored logistics will gain importance as shipment values rise. Providers can differentiate through secure lanes, validated packaging, real-time alerts and specialized handling procedures. This opportunity will remain strongest in the West and South.
Key Market Challenges
Capacity constraints and specialized infrastructure needs
Capacity constraints and specialized infrastructure needs remain key challenges for the U.S. Semiconductor Logistics Market. New fabs and advanced packaging sites require logistics facilities, trained labor, equipment staging areas, secure storage and controlled handling capabilities near production clusters. Some emerging fab locations have limited existing semiconductor logistics ecosystems. This can create bottlenecks during construction, tool move-in and production ramp-up. Providers must invest ahead of demand, but project timelines and customer commitments can shift. Companies with flexible networks, capital discipline and deep semiconductor expertise will be better positioned to manage this challenge.
High operating cost and service quality pressure
High operating cost and service quality pressure can limit margins for logistics providers. Semiconductor logistics requires trained teams, secure facilities, monitoring technology, insurance coverage, special packaging and strict process controls. Customers expect high reliability because a delayed or damaged shipment can affect production output and customer delivery commitments. Price competition remains strong, especially in freight transportation and contract logistics. Providers must balance cost efficiency with premium service requirements. Automation, route optimization and data-driven operations will help reduce cost pressure while maintaining service quality.
Regulatory uncertainty and trade disruption risk
Regulatory uncertainty and trade disruption risk create challenges for semiconductor logistics planning. Export controls, tariff changes, customs procedures and geopolitical restrictions can alter shipment flows and documentation requirements. Logistics teams must adapt quickly when regulations affect AI chips, advanced tools, materials or dual-use products. Uncertainty can increase inventory buffers, delay shipments and raise compliance costs. Semiconductor companies need providers with strong customs brokerage, restricted-party screening and trade advisory capabilities. Regulatory agility will remain critical as semiconductor supply chains stay exposed to national security and trade policy shifts.
Regional Analysis
West
The West led the U.S. Semiconductor Logistics Market with 44% share in 2026, supported by major semiconductor ecosystems across Arizona, California, Oregon, Idaho and Washington. The region benefits from fab projects, equipment suppliers, design centers, advanced technology firms and strong air cargo connectivity. Arizona and Oregon are particularly important due to leading-edge manufacturing, R&D and expansion activity. California supports fabless companies, equipment suppliers, electronics customers and high-value logistics flows. The West also has strong demand for secure transport, controlled warehousing, inbound equipment movement and outbound high-value chip distribution. The region is expected to retain leadership through 2032.
South
The South accounted for 30% share in 2026, supported by semiconductor investment across Texas and other high-growth manufacturing states. The region benefits from fabs, equipment suppliers, EMS activity, logistics infrastructure and proximity to Mexico-linked electronics supply chains. Texas remains a key semiconductor manufacturing and distribution base, creating strong demand for freight transportation, warehousing, contract logistics and value-added services. The South also supports AI infrastructure, data center expansion and advanced electronics supply chains. Logistics providers are expected to expand regional facilities to serve inbound materials, equipment staging and outbound distribution. The region will remain the second-largest market through 2032.
Northeast
The Northeast held 14% share in 2026, supported by semiconductor manufacturing, advanced packaging, memory investment, research assets and electronics supply chain activity across New York, Massachusetts and nearby states. The region benefits from chip-related R&D, university networks and supplier ecosystems. New York’s semiconductor manufacturing and advanced technology investments create demand for specialized logistics, secure warehousing and production-linked transportation. The Northeast also supports high-value shipments tied to defense, medical electronics, photonics and advanced materials. Growth will depend on fab ramp-ups, supplier localization and public-private semiconductor initiatives. The region will remain an important but smaller market than the West and South.
Midwest
The Midwest accounted for 12% share in 2026, supported by semiconductor equipment, automotive electronics, industrial electronics, warehousing networks and emerging fab-related investment. Ohio and neighboring states are gaining relevance as semiconductor manufacturing plans create long-term logistics opportunities. The region’s manufacturing base also supports demand for chips used in automotive, industrial automation, power electronics and advanced machinery. Logistics providers can benefit from central U.S. distribution, cross-dock operations and freight links to major manufacturing customers. Market share remains lower than the West and South, but growth potential is meaningful as domestic chip production and downstream electronics demand expand.
Company
- DHL Supply Chain
- Kuehne+Nagel
- DB Schenker
- DSV
- Expeditors
- UPS
- FedEx
- C.H. Robinson
- Bolloré Logistics
- Kerry Logistics
- Nippon Express
- CEVA Logistics
- GEODIS
- Yusen Logistics
U.S. Semiconductor Logistics Market Segmentations
By Logistics Service
- Freight Transportation
- Warehousing and Storage
- Distribution and Fulfillment
- Value-Added Services
By Provider Type
- 3PL
- 4PL
- In-House
- CEP
- Contract Logistics
By Technology
- IoT Logistics
- AI/ML Optimization
- Blockchain
- Real-Time Visibility
- Automated Handling
By Supply Chain
- Inbound • In-Process • Outbound
By End User
- Fabs/Foundries • OSATs • IDMs • Fabless Firms • Equipment/Material Suppliers • EMS/OEMs
Report Attribute Details
| Report Attribute | Details |
| Historical Period | Not provided |
| Base Year | 2026 |
| Forecast Period | 2027–2032 |
| Market Size in 2026 | USD 17,679.20 million |
| Market Size in 2032 | USD 27,714.20 million |
| CAGR | 7.80% |
| Segments Covered | Logistics Service, Provider Type, Technology, Supply Chain, End User and Region |
| Key Companies Covered | DHL Supply Chain, Kuehne+Nagel, DB Schenker, DSV, Expeditors, UPS, FedEx, C.H. Robinson, Bolloré Logistics, Kerry Logistics, Nippon Express, CEVA Logistics, GEODIS and Yusen Logistics |
Recent Developments
- In January 2025, the U.S. Department of Commerce finalized USD 1.4 billion in CHIPS National Advanced Packaging Manufacturing Program awards to support domestic advanced packaging capacity.
- In March 2025, TSMC announced plans to expand its U.S. investment to USD 165 billion, including additional fabs, advanced packaging facilities and an R&D center.
- In February 2025, Nippon Express released “RISE Global Semiconductor with NX Logistics,” a video introducing its semiconductor logistics capabilities for complex global semiconductor supply chains.
- In May 2026, DHL published guidance on semiconductor logistics volatility and security, highlighting regulatory support, high-value shipment security and stronger documentation needs for chip supply chains.
Report Coverage
The research report offers an in-depth analysis based on logistics service, provider type, technology, supply chain, end user and region. It details leading market players, providing an overview of their business positioning, logistics capabilities, technology platforms, network coverage and strategic relevance in the U.S. Semiconductor Logistics Market. The report includes insights into the competitive environment, market trends, growth drivers, restraints and opportunities. It also examines CHIPS Act-driven reshoring, fab construction, high-value secure logistics, AI chip demand, advanced packaging, IoT visibility and trade compliance complexity as major factors shaping market development. The report assesses the impact of domestic semiconductor investment, regional fab clusters, technology-enabled logistics and regulatory requirements on market growth. It provides strategic recommendations for logistics providers, semiconductor manufacturers, equipment suppliers, OSATs, IDMs, fabless firms, investors and new entrants seeking to navigate the market’s security, compliance and operational complexity.
Future Outlook
- Demand for semiconductor logistics will continue to rise as U.S. fab reshoring, advanced packaging and AI chip production expand through 2032.
- Freight transportation will remain a leading service area because semiconductor flows depend on fast, secure and reliable movement of high-value goods.
- Warehousing and storage will grow as companies localize inventory and build fab-adjacent logistics hubs.
- 3PL providers will retain leadership due to specialized networks, secure handling, technology platforms and integrated service capabilities.
- 4PL models will gain traction as customers seek control tower visibility and end-to-end supply chain orchestration.
- Real-time visibility and IoT logistics will become core requirements for high-value semiconductor shipments.
- AI/ML optimization will support routing, inventory planning, disruption management and warehouse efficiency.
- Fabs/foundries will remain the leading end user segment, while OSATs will gain momentum as advanced packaging capacity expands.
- The West will retain the largest regional share, while the South will support strong growth through Texas-centered semiconductor and electronics activity.
- Competition will increase as global logistics providers compete on security, compliance, temperature control, digital visibility, network depth and semiconductor expertise.
Request a Free Sample
Fill in your details and we'll send you a free sample report.
- Sample data tables & charts
- Research methodology
Need a Custom Version of This Report?
Tailor the scope, geography, or segments to your exact requirements.
- Custom geography or segment scope
- Direct access to our analyst team
Frequently Asked Questions
What is the current market size for the U.S. Semiconductor Logistics Market and what is its projected size in 2032?
At what CAGR is the U.S. Semiconductor Logistics Market projected to grow?
Which logistics service segment is expected to lead the U.S. Semiconductor Logistics Market?
Which provider type holds the strongest position in the market?
Which technology segment leads the market?
Who are the leading companies in the U.S. Semiconductor Logistics Market?
Which region held the largest share in 2026?
Table of Content
Chapter 1. Report Introduction
- 1.1 Report Description & Purpose
- 1.1.1 Report Title & Market Definition
- 1.1.2 Unique Selling Propositions (USP) & Key Differentiators
- 1.1.3 Value Proposition for Stakeholders
- 1.2 Research Objectives
- 1.2.1 Market Sizing Objectives (Volume & Revenue)
- 1.2.2 Segmentation Objectives
- 1.2.3 Competitive Intelligence Objectives
- 1.2.4 Forecast & Scenario Objectives
- 1.3 Report Scope
- 1.3.1 U.S. Semiconductor Logistics Scope – Types & Subtypes Covered
- 1.3.2 Geographic Scope – Regions & Countries Covered
- 1.3.3 Historical Period, Base Year & Forecast Period (2026; forecast to 2032)
- 1.3.4 Inclusions & Exclusions
- 1.4 HS Code & Classification Framework
- 1.5 Currency, Units & Pricing Basis
- 1.6 Target Stakeholders
- 1.7 Limitations & Assumptions
Chapter 2. Executive Summary
- 2.1 Global U.S. Semiconductor Logistics Market Snapshot
- 2.1.1 Market Size – Historical (2026) & Forecast (2026-2032) (2026: USD 17,679.20 million → 2032: USD 27,714.20 million)
- 2.1.2 Volume & Revenue – Global Totals
- 2.1.3 Key Market Highlights – Top Five Facts
- 2.2 U.S. Semiconductor Logistics Market Segmentation Snapshot
- 2.2.1 Market Split by Region – 2026 vs. 2032
- 2.3 Competitive Snapshot
- 2.3.1 Top 10 Players by Revenue Share – 2026
- 2.3.2 Top 10 Players by Volume Share – 2026
- 2.3.3 Recent Strategic Developments (18-Month Summary)
- 2.4 Key Investment Highlights & Strategic Conclusions
Chapter 3. U.S. Semiconductor Logistics Market Dynamics & Industry Analysis
- 3.1 Market Overview & Context
- 3.1.1 U.S. Semiconductor Logistics Market Position in the Broader Automotive Value Chain
- 3.1.2 OEM vs. Replacement Market Dynamics
- 3.1.3 Market Maturity & Development Stage by Region
- 3.2 U.S. Semiconductor Logistics Market Drivers
- 3.3 U.S. Semiconductor Logistics Market Restraints & Challenges
- 3.4 U.S. Semiconductor Logistics Market Opportunities
- 3.5 Porter's Five Forces Analysis
- 3.5.1 Threat of New Entrants
- 3.5.2 Bargaining Power of Suppliers
- 3.5.3 Bargaining Power of Buyers
- 3.5.4 Threat of Substitutes
- 3.5.5 Competitive Rivalry – Intensity Assessment
- 3.6 U.S. Semiconductor Logistics Value Chain Analysis
- 3.6.1 Upstream – Raw Material/Input Suppliers
- 3.6.1.1 Raw Material/Input 1
- 3.6.1.2 Raw Material/Input 2
- 3.6.1.3 Raw Material/Input 3
- 3.6.2 Midstream – Production/Manufacturing/Service Delivery
- 3.6.2.1 Production/Process Overview
- 3.6.2.2 Key Facility Locations & Capacity by Manufacturer
- 3.6.3 Downstream – Distribution & End Consumer
- 3.6.3.1 Primary Channel – B2B/OEM
- 3.6.3.2 Secondary Channels – Dealer, Retail, Online, Direct
- 3.6.4 Value Chain Profitability Analysis
- 3.6.1 Upstream – Raw Material/Input Suppliers
- 3.7 PESTEL Analysis
- 3.7.1 Political Factors
- 3.7.2 Economic Factors
- 3.7.3 Social Factors
- 3.7.4 Technological Factors
- 3.7.5 Environmental Factors
- 3.7.6 Legal Factors
- 3.8 U.S. Semiconductor Logistics Supply Chain Analysis
- 3.8.1 Raw Material/Input Supply Risk Assessment
- 3.8.2 Manufacturing Concentration Risk (Geographic Exposure)
- 3.8.3 Trade Disruption Impact Analysis
- 3.9 Regulatory & Policy Landscape
Note: The regulatory and policy landscape section covers regulations based on their applicability to the market, U.S. Semiconductor Logistics category, geography, and scope of the study. Only regulatory frameworks with a material impact on operations, compliance, trade, sustainability, or market access are analyzed in detail.
Chapter 4. Key Investment Pockets & Opportunity Analysis
- 4.1 U.S. Semiconductor Logistics Market Attractiveness Analysis
- 4.1.1 By Region – Investment Attractiveness Matrix (Volume × CAGR)
- 4.2 Absolute Revenue Growth Opportunity
- 4.2.1 By Region – Absolute USD Growth Through 2032
- 4.3 Incremental Volume Opportunity
- 4.3.1 By Region – Incremental Volume Through 2032
- 4.3.2 Segment – Incremental Volume
- 4.4 Emerging Submarket Opportunity Deep Dive (Subject to Applicability)
- 4.5 Emerging Market Opportunity Scorecards
- 4.5.1 United States
- 4.5.2 Europe
- 4.5.3 Asia
- 4.5.4 Middle East & Africa
Note: Emerging Market Opportunity Scorecards will be included based on relevance and strategic importance. Regions listed are indicative and may vary depending on data availability and market dynamics.
Chapter 5. U.S. Semiconductor Logistics Import-Export Analysis & Trade Flows
- 5.1 Global Trade Overview
- 5.1.1 Global Export Value by Country (2026)
- 5.1.2 Global Export Volume by Country (2026)
- 5.1.3 Global Import Value by Country (2026)
- 5.1.4 Global Import Volume by Country (2026)
- 5.1.5 Net Trade Balance by Country (2026)
- 5.2 Export Analysis – Segment
- 5.2.1 Type 1 (HS Code)
- 5.2.2 Type 2 (HS Code)
- 5.2.3 Type 3 (HS Code)
- 5.2.4 Type 4 (HS Code)
- 5.2.5 Type 5 (HS Code)
- 5.3 Import Analysis – Segment
- 5.3.1 Type 1 (HS Code)
- 5.3.2 Type 2 (HS Code)
- 5.3.3 Type 3 (HS Code)
- 5.3.4 Type 4 (HS Code)
- 5.3.5 Type 5 (HS Code)
- 5.4 Average Unit Trade Prices
- 5.4.1 Average Export Price – Segment & Country
- 5.4.2 Average Import Price – Segment & Source Country
- 5.4.3 Price Trends (2026)
- 5.5 Key Trade Route Analysis
- 5.5.1 Trade Route 1
- 5.5.2 Trade Route 2
- 5.5.3 Trade Route 3
- 5.5.4 Trade Route 4
- 5.5.5 Trade Route 5
- 5.6 Trade Policy Impact Assessment
- 5.6.1 US Anti-Dumping & Section 301 Tariffs
- 5.6.2 EU Customs Union Impact
- 5.6.3 Major Free Trade Agreements
- 5.6.4 USMCA Rules of Origin
Note: Trade policy analysis will be included only where relevant to the U.S. Semiconductor Logistics market.
Chapter 6. Competitive Landscape & Company Benchmarking
- 6.1 U.S. Semiconductor Logistics Market Concentration & Structure
- 6.1.1 Herfindahl-Hirschman Index (HHI) – vs. 2026
- 6.1.2 Tier 1, Tier 2 & Tier 3 Market Structure
- 6.1.3 Global, Regional & Local Player Dynamics
- 6.2 U.S. Semiconductor Logistics Market Share Analysis – 2026
- 6.2.1 Global Revenue Share by Company
- 6.2.2 Global Volume Share by Company
- 6.2.3 Regional Revenue Share
- 6.2.4 Market Share Evolution ( vs. 2026)
- 6.2.5 OEM Segment Share by Company
- 6.2.6 Replacement Segment Share by Company
- 6.3 Production/Delivery Capacity & Facility Analysis
- 6.3.1 Global Installed Capacity
- 6.3.2 Capacity Utilization Rates
- 6.3.3 Production/Output Volume
- 6.3.4 Facility Locations & Capacity Map
- 6.3.5 Planned Capacity Additions
- 6.4 U.S. Semiconductor Logistics Competitive Benchmarking Matrix
- 6.4.1 Revenue, Volume, CAGR & Profitability Comparison
- 6.4.2 Channel Revenue Mix
- 6.4.3 Geographic Revenue Exposure
- 6.4.4 R&D Intensity
- 6.4.5 Sustainability Maturity
- 6.5 Strategic Developments in U.S. Semiconductor Logistics (Last 24 Months)
- 6.5.1 Mergers, Acquisitions & Divestments
- 6.5.2 New U.S. Semiconductor Logistics Launches
- 6.5.3 Facility Expansions
- 6.5.4 Strategic Alliances, Joint Ventures & Partnerships
- 6.5.5 Distribution Expansion & Market Entry
- 6.5.6 Sustainability & ESG Initiatives
- 6.6 Competitive Strategy Mapping
- 6.6.1 Leader, Challenger, Follower & Niche Classification
- 6.6.2 Pricing Strategy Comparison
- 6.6.3 Channel Strategy Matrix
Note: Strategic developments are included based on their materiality and the availability of reliable information.
Chapter 7. Global U.S. Semiconductor Logistics Market – By Distribution Channel
- 7.1 Segment Overview
- 7.1.1 Volume & Revenue Split by Channel (2026 & 2032)
- 7.1.2 Channel Mix Evolution (2026-2032)
Chapter 8. Regional Market Analysis – Global Overview
- 8.1 Global Regional Overview
- 8.1.1 Regional Volume Share
- 8.1.2 Regional Revenue Share
- 8.1.3 Regional Volume by Region
- 8.1.4 Regional Revenue by Region
- 8.1.5 Regional Forecast Through 2032
- 8.2 Cross-Regional Segment Analysis
- 8.2.1 By Distribution Channel
- 8.2.2 By Brand/Price Tier
Chapter 9. North America U.S. Semiconductor Logistics Market
- 9.1 United States
- 9.2 Canada
- 9.3 Mexico
Chapter 10. Europe U.S. Semiconductor Logistics Market
- 10.1 Germany
- 10.2 France
- 10.3 Italy
- 10.4 United Kingdom
- 10.5 Spain
- 10.6 Poland
- 10.7 Russia
- 10.8 Netherlands
- 10.9 Belgium
- 10.10 Sweden
- 10.11 Denmark
- 10.12 Norway
- 10.13 Rest of Europe
Chapter 11. Asia Pacific U.S. Semiconductor Logistics Market
- 11.1 China
- 11.2 India
- 11.3 Japan
- 11.4 South Korea
- 11.5 Thailand
- 11.6 Indonesia
- 11.7 Vietnam
- 11.8 Malaysia
- 11.9 Australia
- 11.10 Rest of Asia Pacific
Chapter 12. Latin America U.S. Semiconductor Logistics Market
- 12.1 Brazil
- 12.2 Argentina
- 12.3 Colombia
- 12.4 Chile
- 12.5 Rest of Latin America
Chapter 13. Middle East U.S. Semiconductor Logistics Market
- 13.1 Saudi Arabia
- 13.2 United Arab Emirates
- 13.3 Turkey
- 13.4 Israel
- 13.5 Iran
- 13.6 Rest of the Middle East
Chapter 14. Africa U.S. Semiconductor Logistics Market
- 14.1 South Africa
- 14.2 Egypt
- 14.3 Nigeria
- 14.4 Morocco
- 14.5 Rest of Africa
Chapter 15. U.S. Semiconductor Logistics Company Profiles
- 15.1 [Company 01]
- 15.1.1 Company Overview
- 15.1.2 Key Management Personnel
- 15.1.3 Products & Services Portfolio
- 15.1.4 Financial Performance
- 15.1.5 Key Market Focus & Geographic Presence
- 15.1.6 Recent Developments & Strategic Initiatives
Note: The company profile list is preliminary and may change based on research findings, market developments, data availability, and client requirements.
Chapter 16. Appendices
- Appendix A – List of Abbreviations & Acronyms
- Appendix B – Industry Classification Code Reference – Full Series
- Appendix C – Production & Capacity Data Tables
- Appendix D – End-Use & Demand Base Tables
- Appendix E – Consumption & Replacement Rate Assumptions
- Appendix F – ASP Reference Tables
- Appendix G – Manufacturing & Facility Database
- Appendix H – Import-Export Data Tables
- Appendix I – Regulatory Summary Tables
- Appendix J – Primary Research Participant List (Anonymized)
- Appendix K – Primary Research Questionnaire Framework
- Appendix L – Data Sources & Bibliography
- Appendix M – Market Size Divergence & Source Comparison
Chapter 17. Research Methodology
- 17.1 Research Framework & Philosophy
- 17.2 Secondary Research – Sources, Hierarchy & Data Extraction
- 17.3 Data Modeling – Bottom-Up & Top-Down Market Sizing
- 17.4 Primary Research – Stakeholder Framework, LOI & Sample Sizes
- 17.5 Forecast Methodology – Regression, Scenario & Sensitivity Analysis
- 17.6 Quality Control – Four-Layer Validation Framework
- 17.7 Limitations & Standard Assumptions
- 17.8 Disclaimer
