
Market Overview:
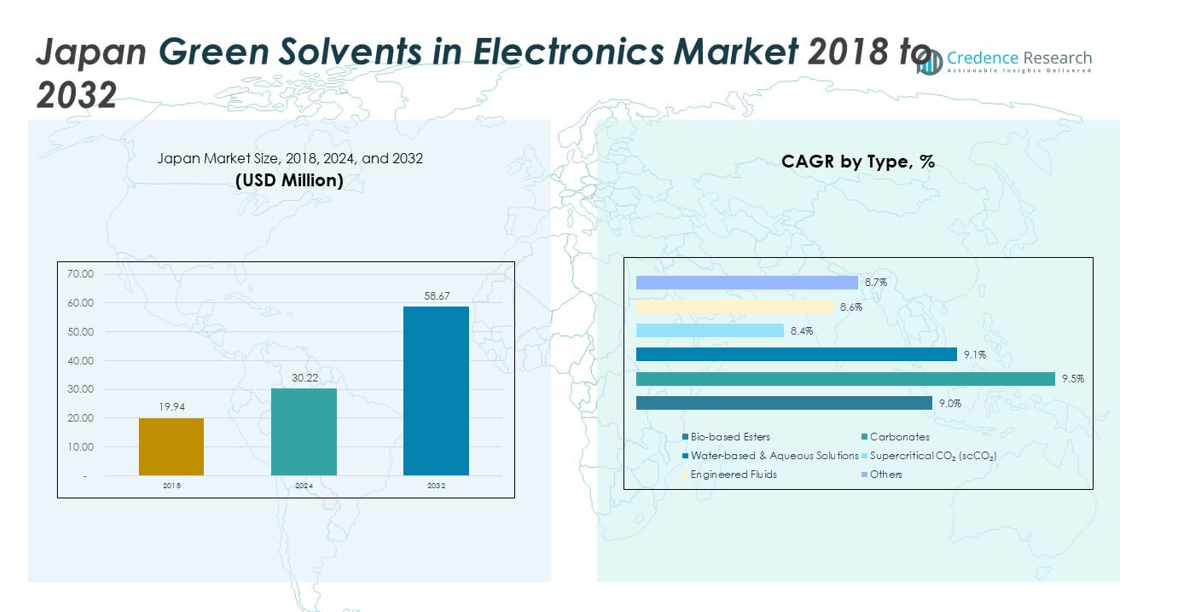
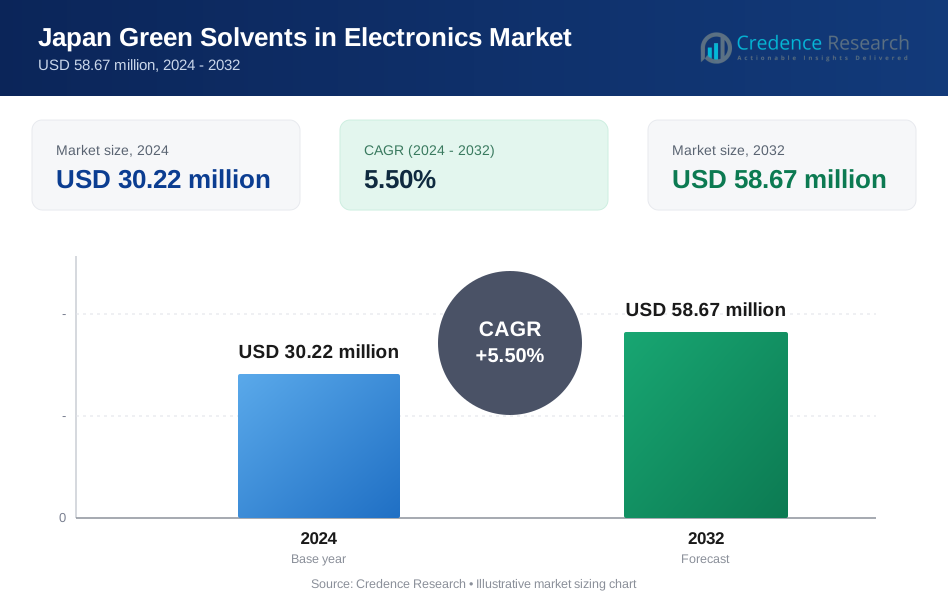
The Japan Green Solvents in Electronics Market size was valued at USD 19.94 million in 2018, increased to USD 30.22 million in 2024, and is anticipated to reach USD 58.67 million by 2032, at a CAGR of 5.50% during the forecast period.
| REPORT ATTRIBUTE | DETAILS |
|---|---|
| Historical Period | 2020-2023 |
| Base Year | 2024 |
| Forecast Period | 2025-2032 |
| Japan Green Solvents in Electronics Market Size 2024 | USD 30.22 million |
| Japan Green Solvents in Electronics Market, CAGR | 5.50% |
| Japan Green Solvents in Electronics Market Size 2032 | USD 58.67 million |
Growing demand for sustainable electronics manufacturing drives market expansion. Rising concerns over volatile organic compounds (VOCs) and stricter environmental standards encourage adoption of eco-friendly solvents in circuit cleaning, degreasing, and semiconductor processes. Japanese electronics companies are focusing on low-toxicity formulations to align with green production goals. Increased R&D investments and government incentives further support the use of renewable raw materials, positioning green solvents as a safer and more efficient alternative.
Japan dominates this market due to its strong electronics and semiconductor industry, supported by advanced research infrastructure and stringent environmental policies. Countries across Asia-Pacific, particularly South Korea and Taiwan, are emerging as fast-growing adopters due to their strong electronics production base. Meanwhile, Europe is also advancing with strict sustainability regulations, while North America is witnessing steady adoption driven by industrial compliance and technological upgrades. This geographic spread highlights Japan’s leadership, alongside the rise of regional competitors.
Market Insights:
- The Japan Green Solvents in Electronics Market was valued at USD 19.94 million in 2018, reached USD 30.22 million in 2024, and is projected to hit USD 58.67 million by 2032, expanding at a CAGR of 5.50%.
- The Kanto region held 38% share in 2024, supported by semiconductor foundries and corporate headquarters; Kansai accounted for 28% with strong display manufacturing; Chubu captured 20% driven by automotive electronics and battery production.
- Kyushu, with 10% share, is the fastest-growing region due to large-scale semiconductor investments and expansion of chip fabrication facilities in Fukuoka and Kumamoto.
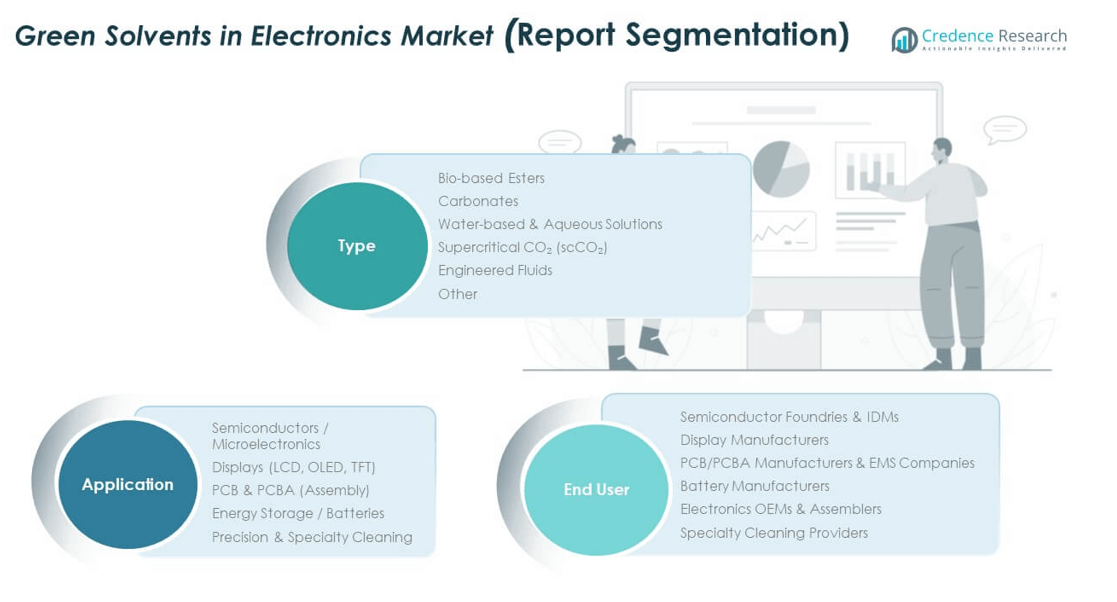
- Bio-based esters held the largest share at 32.58% in 2024, driven by demand for renewable and safer inputs in semiconductor cleaning.
- Carbonates accounted for nearly 22% share in 2024, favored in display manufacturing processes for their stability and reduced environmental impact.
Market Drivers:
Rising Environmental Regulations and Industry Compliance:
Strict environmental regulations in Japan are pushing electronics manufacturers to shift toward green solvents. Government policies emphasize reduction of toxic emissions and adoption of safer alternatives. Companies are investing heavily in eco-friendly solutions to meet compliance standards. The Japan Green Solvents in Electronics Market benefits from this shift as regulations create stable demand. It continues to evolve with alignment to international environmental goals. Stronger regulatory frameworks provide manufacturers clear direction for sustainable innovation. Adoption of cleaner chemicals has become essential for long-term competitiveness.
- For instance, HighChem Co., Ltd., leveraging over 20 years of research, achieved industrial production of Coal to Ethylene Glycol (CTEG) technology with a production load exceeding 80% monthly at Xinjiang Tianye Group, exemplifying high-load industrial-scale green solvent production aligned with regulatory demands.
Growing Electronics and Semiconductor Industry in Japan:
Japan’s robust electronics and semiconductor sector drives the need for advanced and sustainable cleaning solutions. Green solvents are being integrated into processes for circuit cleaning, display manufacturing, and component maintenance. The Japan Green Solvents in Electronics Market grows with rising production volumes in high-tech industries. Semiconductor plants prioritize solvents with low environmental impact to reduce risks. Manufacturers seek stable and efficient formulations to maintain product performance. It ensures compliance while maintaining reliability of electronics. Expansion of semiconductor capacity directly fuels solvent demand.
- For instance, UBE Corporation announced a 30% expansion in high-purity nitric acid production capacity for semiconductor applications by the end of 2024, addressing growing industry requirements with advanced purification technologies sustaining domestic and international markets.
Increased Focus on Corporate Sustainability Goals:
Global corporations in Japan are strengthening commitments toward environmental sustainability. Many firms include green solvents in strategies for carbon neutrality and resource efficiency. The Japan Green Solvents in Electronics Market benefits as corporate buyers prioritize safer inputs. Leading firms adopt bio-based or water-based solvents to reduce hazardous waste. It creates opportunities for suppliers offering tailored eco-friendly solutions. Supply chain partnerships also expand, supporting the green transition. Sustainability commitments influence procurement decisions, creating long-term growth pathways.
Supportive Government Incentives and Research Investments:
Government initiatives encourage adoption of green technologies in electronics production. Subsidies, grants, and tax incentives promote the use of safer solvents. The Japan Green Solvents in Electronics Market gains from strong public-private partnerships. Universities and research centers collaborate with manufacturers on innovative solvent formulations. It fosters R&D pipelines focused on high-performance yet safe solutions. Policy alignment ensures steady commercialization of green technologies. Long-term support reduces market risks and enhances adoption across electronics production lines.
Market Trends:
Integration of Bio-Based Solvents in Electronics Manufacturing:
Bio-based solvents are gaining popularity due to renewable sourcing and reduced toxicity. Electronics producers in Japan are shifting from petroleum-based solutions to plant-derived alternatives. The Japan Green Solvents in Electronics Market reflects this shift in procurement strategies. It highlights an industry-wide trend toward resource efficiency and safer handling. Bio-based solutions also improve workplace safety by reducing chemical exposure. Demand for renewable raw materials supports sustainable supply chains. Suppliers investing in bio-based formulations strengthen long-term partnerships with electronics firms.
- For instance, Vertec BioSolvents Inc. developed a breakthrough lactate ester technology by blending lactate esters with specific alcohols to overcome previous odor and tolerance limitations, expanding their bio-based solvents’ applications in precision cleaning for electronics and aerospace, supported by multiple issued patents.
Advancements in Solvent Performance and Efficiency:
Technological improvements enhance the effectiveness of green solvents in complex electronics processes. The Japan Green Solvents in Electronics Market is witnessing development of solvents with faster drying times and better cleaning efficiency. It supports precision requirements in semiconductor and circuit board production. Enhanced formulations maintain product quality while reducing overall consumption. Performance-driven innovations also reduce costs for manufacturers. Adoption of multi-functional solvents reflects a trend toward efficiency. These advancements strengthen the competitive edge of green alternatives.
- For instance, Huntsman Corporation expanded its E-GRADE® semiconductor-grade amine production capabilities at its Conroe, Texas facility in May 2025, to meet rising global semiconductor demand driven by AI technology. The expansion bolstered Huntsman's portfolio by providing high-purity, low-trace metal amines essential for advanced chip manufacturing.
Growing Demand from Display and Battery Manufacturing:
Green solvents are increasingly used in display technologies and battery production. Japan’s electronics sector sees strong investment in OLED, LCD, and energy storage. The Japan Green Solvents in Electronics Market benefits from these high-growth applications. It is driven by the need for clean processing and sustainable input materials. Green solvents ensure high-quality finishes in display panels. Battery makers adopt solvents to improve safety and reduce environmental impact. This demand broadens the application scope for suppliers in the market.
Collaboration Between Industry and Research Institutions:
Research collaborations are shaping solvent innovations in Japan. Universities and industrial labs co-develop formulations tailored to advanced electronics. The Japan Green Solvents in Electronics Market reflects the outcomes of such joint research. It accelerates product development cycles and shortens time to commercialization. Shared expertise improves scalability and reliability of new solutions. These collaborations also attract government funding for applied research. Strengthened partnerships increase innovation pipelines and enhance industry competitiveness in global markets.
Market Challenges Analysis:
High Costs and Limited Availability of Raw Materials:
The Japan Green Solvents in Electronics Market faces challenges from high production costs. Raw materials for bio-based and advanced solvents are often expensive. It creates pressure on suppliers to balance pricing and performance. Limited availability of renewable feedstock adds to supply chain risks. Fluctuating costs restrict adoption among smaller electronics manufacturers. Many companies struggle to shift fully due to cost constraints. Competitive pricing against conventional solvents remains a barrier for widespread acceptance.
Complex Transition from Conventional Solvents to Green Alternatives:
Shifting existing processes from conventional to green solvents requires time and technical adjustments. The Japan Green Solvents in Electronics Market is impacted by resistance to change in legacy manufacturing lines. It involves training, equipment modifications, and compliance verification. Integration of new solvents may initially reduce productivity. Some firms remain cautious due to operational risks during transition. Technical compatibility issues also limit adoption speed. Overcoming these challenges requires continuous support from suppliers and regulatory agencies.
Market Opportunities:
Expansion in Semiconductor and High-Tech Applications:
The Japan Green Solvents in Electronics Market holds opportunities in semiconductor and display applications. Advanced production processes demand high-quality cleaning and eco-friendly solutions. It positions green solvents as vital for future high-tech industries. Suppliers that tailor products for precision applications can capture strong demand. Growth in high-tech manufacturing enhances the relevance of sustainable input materials.
Export Potential and Regional Leadership in Asia-Pacific:
Japan can leverage its strong electronics base to lead solvent innovations regionally. The Japan Green Solvents in Electronics Market is well-positioned to set standards in Asia-Pacific. It creates opportunities for exports to neighboring electronics hubs like South Korea and Taiwan. Regional leadership in green technologies enhances trade competitiveness. Expanding exports aligns with global sustainability commitments and strengthens market resilience.
Market Segmentation Analysis:
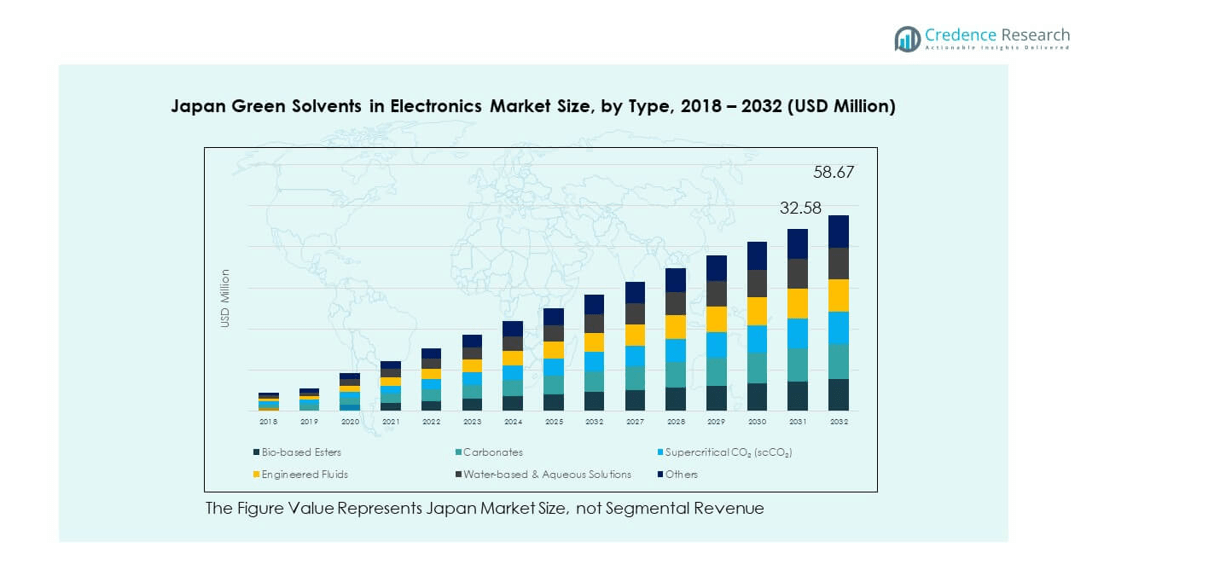
By Type
The Japan Green Solvents in Electronics Market shows strong adoption across diverse solvent categories. Bio-based esters dominate due to renewable sourcing and safer profiles for semiconductor cleaning. Carbonates gain traction in display and microelectronics applications for their stability and low toxicity. Water-based and aqueous solutions find demand in PCB and specialty cleaning due to cost efficiency. Supercritical CO₂ (scCO₂) attracts niche use in precision cleaning because of its low residue and eco-friendly nature. Engineered fluids offer high performance in complex electronics production. Other solvents remain relevant in specialized use cases.
- For instance, Lotte Chemical contributes to advanced specialty chemical production and sustainable practices by Leveraging AI to optimize manufacturing processes and enhance the quality of specialty materials used in electronics, including product development, production, and supply chain management.
By Application
In application terms, semiconductors and microelectronics represent the largest demand segment for green solvents. The Japan Green Solvents in Electronics Market expands with displays such as LCD, OLED, and TFT where solvents ensure clean surfaces and defect-free finishes. PCB and PCBA assembly benefit from water-based and bio-derived solvents to reduce hazardous exposure. Energy storage and batteries adopt solvents for electrode cleaning and safer processing. Precision and specialty cleaning solutions are vital for high-value electronics where contamination control is critical. Each segment reflects a push toward sustainability and operational efficiency.
- For instance, Corbion N.V.'s commitment to innovation and sustainability in 2022 is demonstrated by its continued investment in R&D focused on bio-based ingredients. In line with its Advance 2025 strategy, the company expanded programs for algae, biopolymers, and natural preservation, aligning with clean manufacturing goals and supporting applications ranging from food safety to electronics.
By End User
Semiconductor foundries and IDMs emerge as key consumers of green solvents, driven by strict environmental compliance. Display manufacturers in Japan also invest in safer cleaning inputs to meet performance and sustainability goals. PCB/PCBA manufacturers and EMS companies adopt solvents to optimize assembly while lowering chemical risks. Battery manufacturers increase usage to support growth in energy storage technologies. Electronics OEMs and assemblers integrate solvents across multiple processes for reliability. Specialty cleaning providers form an important end-user group focusing on high-precision requirements. It ensures broad-based demand across the electronics value chain.
Segmentation:
By Type
- Bio-based Esters
- Carbonates
- Water-based & Aqueous Solutions
- Supercritical CO₂ (scCO₂)
- Engineered Fluids
- Other
By Application
- Semiconductors / Microelectronics
- Displays (LCD, OLED, TFT)
- PCB & PCBA (Assembly)
- Energy Storage / Batteries
- Precision & Specialty Cleaning
By End User
- Semiconductor Foundries & IDMs
- Display Manufacturers
- PCB/PCBA Manufacturers & EMS Companies
- Battery Manufacturers
- Electronics OEMs & Assemblers
- Specialty Cleaning Providers
Regional Analysis:
Kanto Region Dominance
The Kanto region holds the largest share of the Japan Green Solvents in Electronics Market, contributing nearly 38% of total demand. Tokyo and surrounding prefectures serve as the hub for advanced semiconductor foundries, PCB manufacturers, and electronics OEMs. Strong R&D activity, high concentration of corporate headquarters, and access to government funding reinforce market leadership. It also benefits from advanced infrastructure that supports large-scale electronics manufacturing. Demand in Kanto continues to rise due to stringent compliance standards and strong sustainability commitments from global corporations. The region sets the pace for technology adoption and solvent innovation.
Kansai and Chubu Industrial Strength
Kansai accounts for around 28% of the market share, driven by strong presence of display manufacturers and specialty electronics producers in Osaka and Kyoto. Major universities and research institutions in the region support innovations in green solvent formulations. It also benefits from clustering of chemical companies that partner with electronics firms to create tailored solutions. Chubu follows with about 20% share, with Nagoya acting as a hub for automotive electronics and battery production. Demand here is fueled by strong growth in energy storage and precision electronics manufacturing. Together, Kansai and Chubu form the backbone of industrial demand.
Emerging Growth in Kyushu and Other Regions
Kyushu contributes nearly 10% of the market share, supported by semiconductor fabs in Fukuoka and Kumamoto. Large-scale investments in new chip plants are expected to boost demand further in the coming years. It plays an important role in meeting the rising global need for semiconductor capacity. Hokkaido and Tohoku regions collectively hold about 4% share, but they are emerging as innovation hubs with growing investments in research facilities and renewable energy-linked electronics projects. It ensures balanced growth across the country while keeping focus on regional diversification.
Key Player Analysis:
- HighChem Co., Ltd.
- Vertec BioSolvents Inc.
- Godavari Biorefineries Ltd.
- Galactic
- UBE Corporation
- Lotte Chemical
- Corbion N.V.
- Huntsman Corporation
- Merck KGaA
- BASF SE
- Dow Inc.
- Haitung Group Limited
- Other Key Players
Competitive Analysis:
The Japan Green Solvents in Electronics Market is highly competitive, with global and domestic players focusing on innovation, partnerships, and product expansion. Leading companies such as HighChem Co., Ltd., UBE Corporation, BASF SE, and Dow Inc. are strengthening their positions through sustainable product development and collaborations with electronics manufacturers. It emphasizes eco-friendly formulations tailored to semiconductor, display, and PCB applications. Companies compete by offering bio-based esters, engineered fluids, and aqueous solutions that balance performance and compliance. Strategic investments in R&D and partnerships with regional electronics firms create a differentiated edge in the market.
Recent Developments:
- In 2025, Godavari Biorefineries Ltd., a major Indian ethanol and bio-based chemicals manufacturer, has been actively expanding its bio-based product portfolio with a focus on innovation and capacity enhancement. Their strategy includes feedstock flexibility and investments in renewable materials relevant to green solvents, as part of their sustainability and biochemical market expansion efforts.
- Corbion N.V., based in Amsterdam, reported organic sales growth and EBITDA margin improvements in H1 2025, reflecting the company's successful focus on sustainable ingredients and bio-based solvents used in various manufacturing sectors, including electronics.
- In September 2024, HighChem Co., Ltd. entered into a distribution agreement with Shenzhen Prechem New Materials Co., Ltd. to expand the availability of the high-performance, eco-friendly solvent EEP (Ethyl 3-ethoxypropionate) in Japan. Sales were planned to start in fall 2024, supported by Prechem's expansion of production capacity to become the world's largest EEP supplier by 2025. EEP is gaining traction in automotive, industrial, and advanced electronics applications such as photoresist solvents in the semiconductor industry.
Report Coverage:
The research report offers an in-depth analysis based on type, application, and end user. It details leading market players, providing an overview of their business, product offerings, investments, revenue streams, and key applications. Additionally, the report includes insights into the competitive environment, SWOT analysis, current market trends, as well as the primary drivers and constraints. Furthermore, it discusses various factors that have driven market expansion in recent years. The report also explores market dynamics, regulatory scenarios, and technological advancements that are shaping the industry. It assesses the impact of external factors and global economic changes on market growth. Lastly, it provides strategic recommendations for new entrants and established companies to navigate the complexities of the market.
Future Outlook:
- Demand for green solvents will strengthen across semiconductor and display industries in Japan.
- Companies will invest in advanced bio-based and aqueous solutions to enhance sustainability.
- Partnerships between chemical firms and electronics producers will shape product innovation.
- Expansion in energy storage and battery applications will create new growth avenues.
- Regional investments in semiconductor fabs will boost solvent consumption significantly.
- Government policies supporting low-emission technologies will drive faster adoption rates.
- Continuous R&D will improve performance, efficiency, and compatibility of green solvents.
- Local companies will expand exports to regional markets in Asia-Pacific.
- Market competition will intensify as global giants and domestic firms pursue share.
- Rising environmental compliance costs will increase demand for eco-friendly alternatives.
Request a Free Sample
Fill in your details and we'll send you a free sample report.
- Sample data tables & charts
- Research methodology
Need a Custom Version of This Report?
Tailor the scope, geography, or segments to your exact requirements.
- Custom geography or segment scope
- Direct access to our analyst team
Frequently Asked Questions
What is the current market size for Japan Green Solvents in Electronics Market, and what is its projected size in 2032?
Which Japan Green Solvents in Electronics Market segment held the largest share in 2024?
What are the primary factors fueling the growth of the Japan Green Solvents in Electronics Market?
Who are the leading companies in the Japan Green Solvents in Electronics Market?
Table of Content
Chapter 1. Report Introduction
- 1.1 Report Description & Purpose
- 1.1.1 Report Title & Market Definition
- 1.1.2 Unique Selling Propositions (USP) & Key Differentiators
- 1.1.3 Value Proposition for Stakeholders
- 1.2 Research Objectives
- 1.2.1 Market Sizing Objectives (Volume & Revenue)
- 1.2.2 Segmentation Objectives
- 1.2.3 Competitive Intelligence Objectives
- 1.2.4 Forecast & Scenario Objectives
- 1.3 Report Scope
- 1.3.1 Japan Green Solvents in Electronics Scope – Types & Subtypes Covered
- 1.3.2 Geographic Scope – Regions & Countries Covered
- 1.3.3 Historical Period, Base Year & Forecast Period (2024; forecast to 2032)
- 1.3.4 Inclusions & Exclusions
- 1.4 HS Code & Classification Framework
- 1.5 Currency, Units & Pricing Basis
- 1.6 Target Stakeholders
- 1.7 Limitations & Assumptions
Chapter 2. Executive Summary
- 2.1 Global Japan Green Solvents in Electronics Market Snapshot
- 2.1.1 Market Size – Historical (2024) & Forecast (2024-2032) (2024: USD 30.22 million → 2032: USD 58.67 million)
- 2.1.2 Volume & Revenue – Global Totals
- 2.1.3 Key Market Highlights – Top Five Facts
- 2.2 Japan Green Solvents in Electronics Market Segmentation Snapshot
- 2.2.1 Market Split by Region – 2024 vs. 2032
- 2.3 Competitive Snapshot
- 2.3.1 Top 10 Players by Revenue Share – 2024
- 2.3.2 Top 10 Players by Volume Share – 2024
- 2.3.3 Recent Strategic Developments (18-Month Summary)
- 2.4 Key Investment Highlights & Strategic Conclusions
Chapter 3. Japan Green Solvents in Electronics Market Dynamics & Industry Analysis
- 3.1 Market Overview & Context
- 3.1.1 Japan Green Solvents in Electronics Market Position in the Broader Automotive Value Chain
- 3.1.2 OEM vs. Replacement Market Dynamics
- 3.1.3 Market Maturity & Development Stage by Region
- 3.2 Japan Green Solvents in Electronics Market Drivers
- 3.3 Japan Green Solvents in Electronics Market Restraints & Challenges
- 3.4 Japan Green Solvents in Electronics Market Opportunities
- 3.5 Porter's Five Forces Analysis
- 3.5.1 Threat of New Entrants
- 3.5.2 Bargaining Power of Suppliers
- 3.5.3 Bargaining Power of Buyers
- 3.5.4 Threat of Substitutes
- 3.5.5 Competitive Rivalry – Intensity Assessment
- 3.6 Japan Green Solvents in Electronics Value Chain Analysis
- 3.6.1 Upstream – Raw Material/Input Suppliers
- 3.6.1.1 Raw Material/Input 1
- 3.6.1.2 Raw Material/Input 2
- 3.6.1.3 Raw Material/Input 3
- 3.6.2 Midstream – Production/Manufacturing/Service Delivery
- 3.6.2.1 Production/Process Overview
- 3.6.2.2 Key Facility Locations & Capacity by Manufacturer
- 3.6.3 Downstream – Distribution & End Consumer
- 3.6.3.1 Primary Channel – B2B/OEM
- 3.6.3.2 Secondary Channels – Dealer, Retail, Online, Direct
- 3.6.4 Value Chain Profitability Analysis
- 3.6.1 Upstream – Raw Material/Input Suppliers
- 3.7 PESTEL Analysis
- 3.7.1 Political Factors
- 3.7.2 Economic Factors
- 3.7.3 Social Factors
- 3.7.4 Technological Factors
- 3.7.5 Environmental Factors
- 3.7.6 Legal Factors
- 3.8 Japan Green Solvents in Electronics Supply Chain Analysis
- 3.8.1 Raw Material/Input Supply Risk Assessment
- 3.8.2 Manufacturing Concentration Risk (Geographic Exposure)
- 3.8.3 Trade Disruption Impact Analysis
- 3.9 Regulatory & Policy Landscape
Note: The regulatory and policy landscape section covers regulations based on their applicability to the market, Japan Green Solvents in Electronics category, geography, and scope of the study. Only regulatory frameworks with a material impact on operations, compliance, trade, sustainability, or market access are analyzed in detail.
Chapter 4. Key Investment Pockets & Opportunity Analysis
- 4.1 Japan Green Solvents in Electronics Market Attractiveness Analysis
- 4.1.1 By Region – Investment Attractiveness Matrix (Volume × CAGR)
- 4.2 Absolute Revenue Growth Opportunity
- 4.2.1 By Region – Absolute USD Growth Through 2032
- 4.3 Incremental Volume Opportunity
- 4.3.1 By Region – Incremental Volume Through 2032
- 4.3.2 Segment – Incremental Volume
- 4.4 Emerging Submarket Opportunity Deep Dive (Subject to Applicability)
- 4.5 Emerging Market Opportunity Scorecards
- 4.5.1 United States
- 4.5.2 Europe
- 4.5.3 Asia
- 4.5.4 Middle East & Africa
Note: Emerging Market Opportunity Scorecards will be included based on relevance and strategic importance. Regions listed are indicative and may vary depending on data availability and market dynamics.
Chapter 5. Japan Green Solvents in Electronics Import-Export Analysis & Trade Flows
- 5.1 Global Trade Overview
- 5.1.1 Global Export Value by Country (2024)
- 5.1.2 Global Export Volume by Country (2024)
- 5.1.3 Global Import Value by Country (2024)
- 5.1.4 Global Import Volume by Country (2024)
- 5.1.5 Net Trade Balance by Country (2024)
- 5.2 Export Analysis – Segment
- 5.2.1 Type 1 (HS Code)
- 5.2.2 Type 2 (HS Code)
- 5.2.3 Type 3 (HS Code)
- 5.2.4 Type 4 (HS Code)
- 5.2.5 Type 5 (HS Code)
- 5.3 Import Analysis – Segment
- 5.3.1 Type 1 (HS Code)
- 5.3.2 Type 2 (HS Code)
- 5.3.3 Type 3 (HS Code)
- 5.3.4 Type 4 (HS Code)
- 5.3.5 Type 5 (HS Code)
- 5.4 Average Unit Trade Prices
- 5.4.1 Average Export Price – Segment & Country
- 5.4.2 Average Import Price – Segment & Source Country
- 5.4.3 Price Trends (2024)
- 5.5 Key Trade Route Analysis
- 5.5.1 Trade Route 1
- 5.5.2 Trade Route 2
- 5.5.3 Trade Route 3
- 5.5.4 Trade Route 4
- 5.5.5 Trade Route 5
- 5.6 Trade Policy Impact Assessment
- 5.6.1 US Anti-Dumping & Section 301 Tariffs
- 5.6.2 EU Customs Union Impact
- 5.6.3 Major Free Trade Agreements
- 5.6.4 USMCA Rules of Origin
Note: Trade policy analysis will be included only where relevant to the Japan Green Solvents in Electronics market.
Chapter 6. Competitive Landscape & Company Benchmarking
- 6.1 Japan Green Solvents in Electronics Market Concentration & Structure
- 6.1.1 Herfindahl-Hirschman Index (HHI) – vs. 2024
- 6.1.2 Tier 1, Tier 2 & Tier 3 Market Structure
- 6.1.3 Global, Regional & Local Player Dynamics
- 6.2 Japan Green Solvents in Electronics Market Share Analysis – 2024
- 6.2.1 Global Revenue Share by Company
- 6.2.2 Global Volume Share by Company
- 6.2.3 Regional Revenue Share
- 6.2.4 Market Share Evolution ( vs. 2024)
- 6.2.5 OEM Segment Share by Company
- 6.2.6 Replacement Segment Share by Company
- 6.3 Production/Delivery Capacity & Facility Analysis
- 6.3.1 Global Installed Capacity
- 6.3.2 Capacity Utilization Rates
- 6.3.3 Production/Output Volume
- 6.3.4 Facility Locations & Capacity Map
- 6.3.5 Planned Capacity Additions
- 6.4 Japan Green Solvents in Electronics Competitive Benchmarking Matrix
- 6.4.1 Revenue, Volume, CAGR & Profitability Comparison
- 6.4.2 Channel Revenue Mix
- 6.4.3 Geographic Revenue Exposure
- 6.4.4 R&D Intensity
- 6.4.5 Sustainability Maturity
- 6.5 Strategic Developments in Japan Green Solvents in Electronics (Last 24 Months)
- 6.5.1 Mergers, Acquisitions & Divestments
- 6.5.2 New Japan Green Solvents in Electronics Launches
- 6.5.3 Facility Expansions
- 6.5.4 Strategic Alliances, Joint Ventures & Partnerships
- 6.5.5 Distribution Expansion & Market Entry
- 6.5.6 Sustainability & ESG Initiatives
- 6.6 Competitive Strategy Mapping
- 6.6.1 Leader, Challenger, Follower & Niche Classification
- 6.6.2 Pricing Strategy Comparison
- 6.6.3 Channel Strategy Matrix
Note: Strategic developments are included based on their materiality and the availability of reliable information.
Chapter 7. Global Japan Green Solvents in Electronics Market – By Distribution Channel
- 7.1 Segment Overview
- 7.1.1 Volume & Revenue Split by Channel (2024 & 2032)
- 7.1.2 Channel Mix Evolution (2024-2032)
Chapter 8. Regional Market Analysis – Global Overview
- 8.1 Global Regional Overview
- 8.1.1 Regional Volume Share
- 8.1.2 Regional Revenue Share
- 8.1.3 Regional Volume by Region
- 8.1.4 Regional Revenue by Region
- 8.1.5 Regional Forecast Through 2032
- 8.2 Cross-Regional Segment Analysis
- 8.2.1 By Distribution Channel
- 8.2.2 By Brand/Price Tier
Chapter 9. North America Japan Green Solvents in Electronics Market
- 9.1 United States
- 9.2 Canada
- 9.3 Mexico
Chapter 10. Europe Japan Green Solvents in Electronics Market
- 10.1 Germany
- 10.2 France
- 10.3 Italy
- 10.4 United Kingdom
- 10.5 Spain
- 10.6 Poland
- 10.7 Russia
- 10.8 Netherlands
- 10.9 Belgium
- 10.10 Sweden
- 10.11 Denmark
- 10.12 Norway
- 10.13 Rest of Europe
Chapter 11. Asia Pacific Japan Green Solvents in Electronics Market
- 11.1 China
- 11.2 India
- 11.3 Japan
- 11.4 South Korea
- 11.5 Thailand
- 11.6 Indonesia
- 11.7 Vietnam
- 11.8 Malaysia
- 11.9 Australia
- 11.10 Rest of Asia Pacific
Chapter 12. Latin America Japan Green Solvents in Electronics Market
- 12.1 Brazil
- 12.2 Argentina
- 12.3 Colombia
- 12.4 Chile
- 12.5 Rest of Latin America
Chapter 13. Middle East Japan Green Solvents in Electronics Market
- 13.1 Saudi Arabia
- 13.2 United Arab Emirates
- 13.3 Turkey
- 13.4 Israel
- 13.5 Iran
- 13.6 Rest of the Middle East
Chapter 14. Africa Japan Green Solvents in Electronics Market
- 14.1 South Africa
- 14.2 Egypt
- 14.3 Nigeria
- 14.4 Morocco
- 14.5 Rest of Africa
Chapter 15. Japan Green Solvents in Electronics Company Profiles
- 15.1 [Company 01]
- 15.1.1 Company Overview
- 15.1.2 Key Management Personnel
- 15.1.3 Products & Services Portfolio
- 15.1.4 Financial Performance
- 15.1.5 Key Market Focus & Geographic Presence
- 15.1.6 Recent Developments & Strategic Initiatives
Note: The company profile list is preliminary and may change based on research findings, market developments, data availability, and client requirements.
Chapter 16. Appendices
- Appendix A – List of Abbreviations & Acronyms
- Appendix B – Industry Classification Code Reference – Full Series
- Appendix C – Production & Capacity Data Tables
- Appendix D – End-Use & Demand Base Tables
- Appendix E – Consumption & Replacement Rate Assumptions
- Appendix F – ASP Reference Tables
- Appendix G – Manufacturing & Facility Database
- Appendix H – Import-Export Data Tables
- Appendix I – Regulatory Summary Tables
- Appendix J – Primary Research Participant List (Anonymized)
- Appendix K – Primary Research Questionnaire Framework
- Appendix L – Data Sources & Bibliography
- Appendix M – Market Size Divergence & Source Comparison
Chapter 17. Research Methodology
- 17.1 Research Framework & Philosophy
- 17.2 Secondary Research – Sources, Hierarchy & Data Extraction
- 17.3 Data Modeling – Bottom-Up & Top-Down Market Sizing
- 17.4 Primary Research – Stakeholder Framework, LOI & Sample Sizes
- 17.5 Forecast Methodology – Regression, Scenario & Sensitivity Analysis
- 17.6 Quality Control – Four-Layer Validation Framework
- 17.7 Limitations & Standard Assumptions
- 17.8 Disclaimer
