
Market Overview
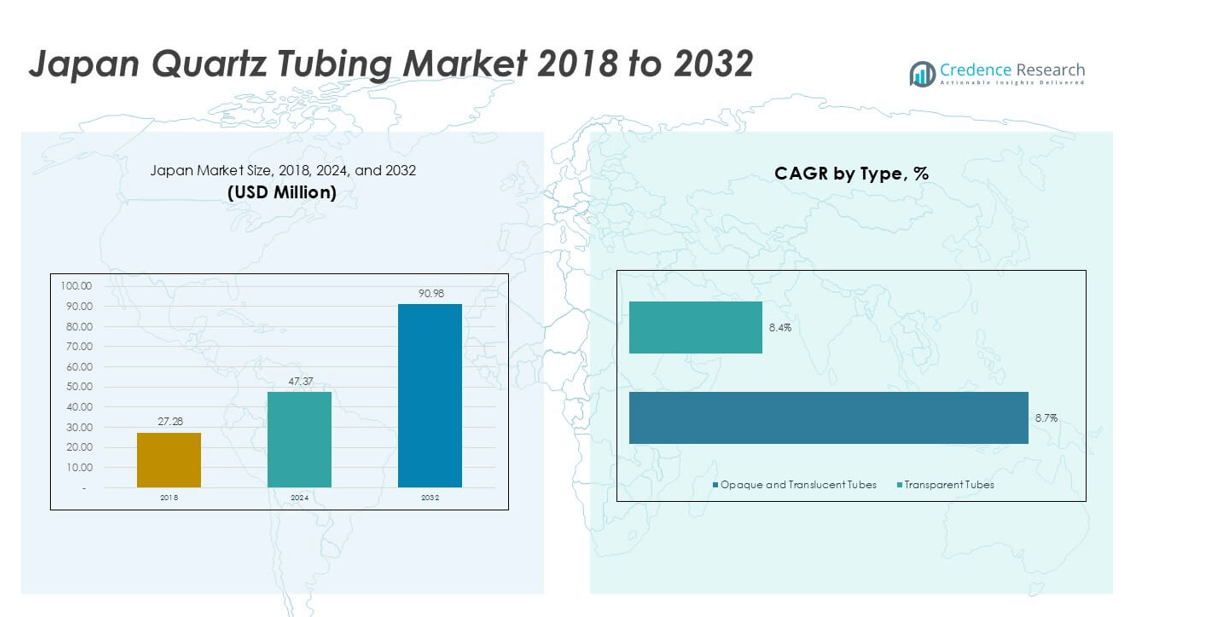
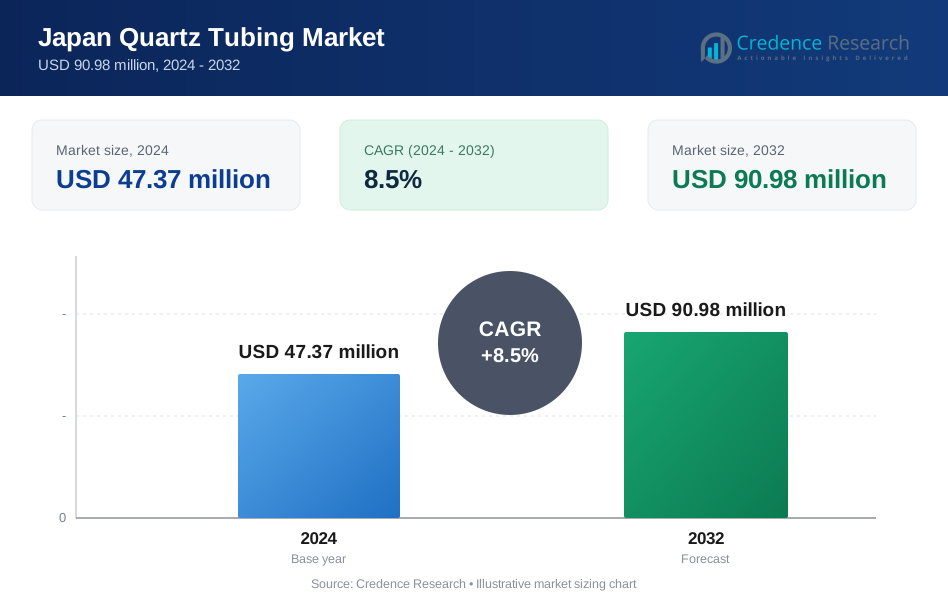
Japan Quartz Tubing market size was valued at USD 27.28 million in 2018 to USD 47.37 million in 2024 and is anticipated to reach USD 90.98 million by 2032, at a CAGR of 8.5% during the forecast period.
| REPORT ATTRIBUTE | DETAILS |
|---|---|
| Historical Period | 2020-2023 |
| Base Year | 2024 |
| Forecast Period | 2025-2032 |
| Japan Quartz Tubing Market Size 2024 | USD 47.37 million |
| Japan Quartz Tubing Market, CAGR | 8.5% |
| Japan Quartz Tubing Market Size 2032 | USD 90.98 million |
The Japan quartz tubing market is led by a mix of established domestic manufacturers and global material specialists. Leading players compete through high-purity production, tight dimensional control, and long-term supply relationships with semiconductor fabs and equipment OEMs. Domestic suppliers benefit from proximity to customers and strong process collaboration, while global firms leverage advanced material science and broader product portfolios. Regionally, the Kanto region dominates the market with an exact share of 38%, supported by dense semiconductor fabrication, research institutes, and equipment manufacturing hubs. Kansai and Chubu follow with smaller but stable shares, driven by electronics, industrial processing, and specialty manufacturing. Kyushu shows rising importance due to semiconductor capacity expansion, while Hokkaido and Tohoku remain niche, research-oriented markets.
Market Insights
- The Japan quartz tubing market reached USD 47.37 million in 2024 and is forecast to grow at about 8.5% CAGR through 2032, driven by strong semiconductor and industrial demand.
- Semiconductor manufacturing remains the main growth driver, supported by fab expansion, equipment upgrades, and strict purity requirements that favor premium quartz tubing with higher replacement frequency.
- Market trends focus on high-purity transparent tubes, which hold about 62% segment share, along with rising demand for customized dimensions and tighter tolerances across advanced manufacturing applications.
- Competition is moderately consolidated, with domestic and global players competing on quality, customization, and long-term OEM relationships, while automation and digital quality control strengthen supplier differentiation.
- Regionally, Kanto leads with around 38% share, followed by Kansai at 22%, Chubu at 18%, Kyushu at 15%, and Hokkaido–Tohoku at 7%, reflecting fab density and industrial activity.
Market Segmentation Analysis:
By Type
The Japan quartz tubing market shows clear dominance by transparent tubes. Transparent tubes account for about 62% of total market share. Strong demand comes from semiconductor and precision industrial processes. These applications require high purity and optical clarity. Transparent tubes support stable thermal performance and low contamination. Opaque and translucent tubes hold the remaining share. Demand comes from insulation and specialized industrial uses. However, limited optical requirements restrict wider adoption. Ongoing semiconductor capacity upgrades continue to favor transparent tubing across Japanese manufacturing clusters.
- For instance, Tosoh Quartz supplies transparent fused-quartz tubes with metallic impurities below 1 ppm and thermal expansion near 0.55 × 10⁻⁶/K, supporting diffusion and oxidation tools used in Japanese semiconductor fabs.
By Application
The semiconductor segment leads the Japan quartz tubing market with nearly 48% market share. Growth is driven by wafer fabrication, diffusion furnaces, and oxidation processes. High thermal resistance and ultra-low impurity levels support yield control. Industrial applications rank second, supported by chemical processing and high-temperature equipment. Lighting holds a smaller share due to LED adoption. Semiconductor fabs prioritize domestic sourcing and quality assurance. Continued investment in advanced chip manufacturing remains the primary driver supporting long-term demand growth.
- For instance, Shin-Etsu Quartz Products produces semiconductor-grade quartz tubing rated for continuous use above 1,100 °C with hydroxyl content under 10 ppm, enabling clean furnace operation in advanced Japanese wafer-processing lines.
Key Growth Drivers
Expansion of Semiconductor Manufacturing Capacity
Semiconductor manufacturing expansion remains the strongest growth driver in Japan’s quartz tubing market. Quartz tubing plays a critical role in diffusion, oxidation, and LPCVD processes. Japanese fabs require ultra-high purity and thermal stability. Advanced logic and memory nodes demand tighter dimensional tolerances. This requirement increases replacement cycles for quartz components. Government support for domestic chip production strengthens capital investment. New fabs and tool upgrades raise tubing consumption per toolset. Yield sensitivity pushes demand toward premium-grade quartz. Long production runs accelerate wear rates. Suppliers benefit from long-term supply contracts. Localization reduces supply chain risk. Equipment OEM alignment further strengthens demand. This driver provides stable, technology-led volume growth across forecast years.
- For instance, Shin-Etsu Quartz Products supplies semiconductor-grade quartz tubing with metal impurities below 1 ppm and certified continuous-use stability above 1,100 °C, supporting diffusion and LPCVD furnaces in advanced Japanese logic and memory fabs.
Growth in High-Temperature Industrial Processing
Industrial processing represents a key structural growth driver. Quartz tubing supports extreme temperatures and chemical resistance. Japanese industries use quartz in chemicals, metallurgy, and specialty glass. Process electrification increases thermal load requirements. Quartz outperforms metal alternatives in purity-sensitive environments. Hydrogen-related process development adds incremental demand. Precision furnace systems rely on consistent tubing performance. Industrial automation improves throughput, increasing component stress. Replacement demand grows with continuous operations. Domestic manufacturers favor proven material reliability. Compliance with strict safety standards supports quartz adoption. This driver ensures diversified demand beyond semiconductors. Industrial end users provide steady baseline consumption.
Strong Focus on Domestic Advanced Manufacturing
Japan’s emphasis on advanced manufacturing supports sustained quartz tubing demand. Domestic producers prioritize precision and process control. Quartz tubing enables consistent outcomes in high-spec equipment. Industries value long equipment lifecycles and reliability. Local suppliers meet strict quality documentation requirements. Shorter lead times improve production planning. High-value manufacturing favors premium materials over cost substitutes. Government programs encourage reshoring of critical components. Advanced manufacturing clusters drive regional demand concentration. Continuous improvement cultures increase material upgrade rates. This driver reinforces demand stability. It also supports supplier pricing power and margin resilience.
Key Trends & Opportunities
Shift Toward Customized and High-Purity Quartz Solutions
Customization represents a major trend shaping market opportunities. End users require specific diameters, wall thicknesses, and lengths. Semiconductor and laboratory users demand ultra-low impurity profiles. Customized tubing improves system integration and yield control. Small-batch production capabilities gain importance. Flexible suppliers capture higher margins. Technical collaboration strengthens long-term customer relationships. Custom solutions reduce substitution risk from imports. Rapid prototyping supports faster tool qualification. Niche industrial applications expand addressable demand. This trend favors technologically advanced domestic producers. Customization becomes a key competitive differentiator.
- For instance, Shin-Etsu Quartz Products delivers custom semiconductor quartz tubes with metallic impurities below 1 ppm and diameter tolerances controlled within ±0.1 mm, supporting rapid qualification for diffusion and oxidation tools in Japanese fabs.
Adoption of Smart Manufacturing and Quality Control
Digital manufacturing adoption creates new opportunities for suppliers. Inline inspection improves dimensional accuracy. Real-time defect detection reduces scrap rates. Data-driven quality systems enhance traceability. Semiconductor customers prefer digitally enabled suppliers. Smart manufacturing supports consistent purity performance. Automation improves throughput and labor efficiency. Predictive maintenance reduces unplanned downtime. Energy optimization lowers operating costs. These capabilities support premium positioning. Export competitiveness also improves. This trend encourages long-term supplier investment in digital infrastructure.
- For instance, Tosoh Quartz uses automated optical inspection systems capable of detecting surface defects down to 50 µm and maintains process control for fused-silica tubing rated for continuous use above 1,100 °C, ensuring stable quality for high-temperature semiconductor and industrial applications.
Key Challenges
Volatility in Raw Material Quality and Supply
Raw material consistency presents a major market challenge. High-purity quartz feedstock availability remains limited. Quality variation impacts final tubing performance. Tight impurity limits increase rejection rates. Global competition for premium quartz intensifies supply pressure. Import dependence exposes producers to logistics risk. Price volatility affects cost planning. Inventory buffering raises working capital needs. Qualification of new sources requires long timelines. Semiconductor customers resist material changes. These factors constrain supply flexibility. Managing raw material risk remains critical for producers.
High Capital and Technology Investment Requirements
Quartz tubing manufacturing requires significant capital investment. Precision melting and forming equipment is costly. Advanced purification processes raise operating expenses. Continuous R&D is necessary to meet evolving specifications. Skilled labor shortages increase training costs. Equipment upgrades demand long payback periods. Smaller players face entry barriers. Price competition limits cost recovery speed. Compliance with safety and environmental rules adds complexity. Customers expect zero-defect performance. These pressures strain margins. High investment intensity limits rapid capacity expansion.
Regional Analysis
Kanto Region
The Kanto region holds the largest share of the Japan quartz tubing market at about 38%. Strong demand comes from Tokyo and surrounding prefectures. The region hosts major semiconductor fabs, research labs, and equipment suppliers. High concentration of advanced manufacturing drives steady consumption. Frequent tool upgrades increase replacement demand. Customers require ultra-high purity and tight tolerances. Proximity to OEMs supports close technical collaboration. Well-developed logistics reduce lead times. Government-backed semiconductor investments further strengthen demand. Kanto remains the primary revenue center for quartz tubing suppliers.
Kansai Region
The Kansai region accounts for nearly 22% of the market share. Osaka, Kyoto, and Hyogo support diverse industrial demand. Semiconductor materials, electronics, and chemical processing drive consumption. Kansai benefits from a strong base of specialty manufacturers. Quartz tubing supports high-temperature and purity-sensitive processes. Lighting and industrial furnace applications remain relevant. Local firms value long-term supplier relationships. Moderate semiconductor expansion supports stable growth. Research institutes contribute to niche demand. Kansai offers balanced demand across applications with steady replacement cycles.
Chubu Region
The Chubu region represents around 18% of Japan’s quartz tubing market. Aichi and nearby areas anchor advanced manufacturing activity. Automotive electronics and industrial equipment drive demand. Power devices and sensors increase semiconductor-related usage. Quartz tubing supports precision thermal processing. Industrial furnaces remain a key application. Strong engineering culture favors high-quality materials. Localized supply chains support stable procurement. Capital investment grows at a measured pace. Chubu shows consistent demand growth with lower volatility than metro regions.
Kyushu Region
Kyushu holds approximately 15% market share and shows strong growth momentum. The region hosts major semiconductor fabs. Government incentives attract new capacity investments. Quartz tubing demand rises with wafer production expansion. High utilization rates increase component replacement needs. Local clusters support supplier entry. Logistics links to Asia improve export-oriented manufacturing. Industrial applications also contribute incremental demand. Skilled workforce availability supports advanced processes. Kyushu is a fast-growing regional market driven mainly by semiconductors.
Hokkaido and Tohoku Region
Hokkaido and Tohoku together account for about 7% of the market. Demand remains smaller but stable. Semiconductor back-end processes and research facilities support usage. Industrial and laboratory applications dominate consumption. Lower fab density limits volume growth. However, regional development programs support gradual expansion. Clean energy and materials research create niche opportunities. Suppliers focus on specialized orders rather than scale. Replacement demand remains consistent. This region offers selective growth tied to targeted industrial investments.]
Market Segmentations:
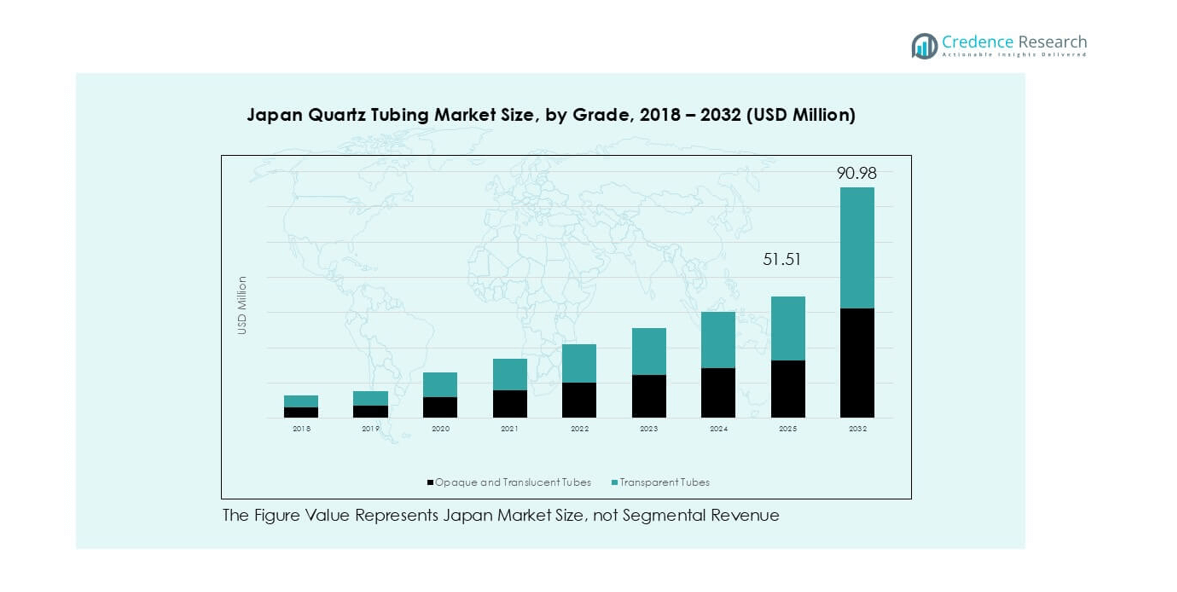
By Type
- Opaque and Translucent Tubes
- Transparent Tubes
By Application
- Industrial Applications
- Semiconductor
- Lighting
By Geography
- Kanto Region
- Kansai Region
- Chubu Region
- Kyushu Region
- Hokkaido and Tohoku Region
Competitive Landscape
Japan’s quartz tubing competitive landscape remains moderately consolidated, led by established global suppliers and specialized Japanese producers. Leading companies compete on ultra-high purity, tight dimensional control, and consistent thermal performance for semiconductor and industrial customers. Suppliers strengthen positions through long-term agreements with fabs and equipment OEMs, supported by rigorous qualification and traceability standards. Product differentiation centers on low-impurity grades, customized geometries, and high-yield forming processes that reduce micro-defects. Global players leverage advanced material science and broad portfolios, while local firms emphasize fast lead times, technical support, and reliability. Competition also intensifies around capacity expansion, precision machining, and contamination-control capabilities. Firms invest in automation and in-line inspection to improve yield and lower scrap. Pricing remains value-based for semiconductor grades, while industrial grades face stronger price pressure from imports.
Key Player Analysis
- OHARA QUARTZ
- Heraeus
- QSIL
- TOSOH
- Shin-Etsu Quartz Products Co., Ltd
- Aoxin Quartz
- Sentro Tech
- proQuarz GmbH
- ATOCK CO., LTD
- Lianyungang Guoyi Quartz Products Co., Ltd
Recent Developments
- In Jan 2025, Heraeus combined high-performance materials units into Heraeus Covantics to expand its technology leadership in high-purity quartz and fused silica products.
- In Nov 2024, Momentive Technologies promoted two long-serving executives into global quartz and ceramics leadership roles, strengthening its quartz business focus.
Report Coverage
The research report offers an in-depth analysis based on Type, Application and Geography. It details leading market players, providing an overview of their business, product offerings, investments, revenue streams, and key applications. Additionally, the report includes insights into the competitive environment, SWOT analysis, current market trends, as well as the primary drivers and constraints. Furthermore, it discusses various factors that have driven market expansion in recent years. The report also explores market dynamics, regulatory scenarios, and technological advancements that are shaping the industry. It assesses the impact of external factors and global economic changes on market growth. Lastly, it provides strategic recommendations for new entrants and established companies to navigate the complexities of the market.
Future Outlook
- Semiconductor fab expansion will remain the primary demand engine across forecast years.
- Demand for ultra-high purity quartz tubing will continue to increase.
- Transparent tubing will maintain dominance due to advanced process requirements.
- Custom dimensions and tighter tolerances will gain greater importance.
- Replacement demand will rise with higher tool utilization rates.
- Domestic sourcing will grow to reduce supply chain risk.
- Automation and digital quality control will shape supplier competitiveness.
- Industrial applications will provide steady baseline volume growth.
- Kyushu will show faster growth than mature regions.
- Supplier focus will shift toward value-added and long-term contracts.
Request a Free Sample
Fill in your details and we'll send you a free sample report.
- Sample data tables & charts
- Research methodology
Need a Custom Version of This Report?
Tailor the scope, geography, or segments to your exact requirements.
- Custom geography or segment scope
- Direct access to our analyst team
Frequently Asked Questions
What is the current market size for the Japan Quartz Tubing market, and what is its projected size in 2032?
At what Compound Annual Growth Rate is the Japan Quartz Tubing market projected to grow between 2024 and 2032?
Which Japan Quartz Tubing market segment held the largest share in 2024?
What are the primary factors fueling the growth of the Japan Quartz Tubing market?
Who are the leading companies in the Japan Quartz Tubing market?
Table of Content
Chapter 1. Report Introduction
- 1.1 Report Description & Purpose
- 1.1.1 Report Title & Market Definition
- 1.1.2 Unique Selling Propositions (USP) & Key Differentiators
- 1.1.3 Value Proposition for Stakeholders
- 1.2 Research Objectives
- 1.2.1 Market Sizing Objectives (Volume & Revenue)
- 1.2.2 Segmentation Objectives
- 1.2.3 Competitive Intelligence Objectives
- 1.2.4 Forecast & Scenario Objectives
- 1.3 Report Scope
- 1.3.1 Japan Quartz Tubing Scope – Types & Subtypes Covered
- 1.3.2 Geographic Scope – Regions & Countries Covered
- 1.3.3 Historical Period, Base Year & Forecast Period (2024; forecast to 2032)
- 1.3.4 Inclusions & Exclusions
- 1.4 HS Code & Classification Framework
- 1.5 Currency, Units & Pricing Basis
- 1.6 Target Stakeholders
- 1.7 Limitations & Assumptions
Chapter 2. Executive Summary
- 2.1 Global Japan Quartz Tubing Market Snapshot
- 2.1.1 Market Size – Historical (2024) & Forecast (2024-2032) (2024: USD 47.37 million → 2032: USD 90.98 million)
- 2.1.2 Volume & Revenue – Global Totals
- 2.1.3 Key Market Highlights – Top Five Facts
- 2.2 Japan Quartz Tubing Market Segmentation Snapshot
- 2.2.1 Market Split by Region – 2024 vs. 2032
- 2.3 Competitive Snapshot
- 2.3.1 Top 10 Players by Revenue Share – 2024
- 2.3.2 Top 10 Players by Volume Share – 2024
- 2.3.3 Recent Strategic Developments (18-Month Summary)
- 2.4 Key Investment Highlights & Strategic Conclusions
Chapter 3. Japan Quartz Tubing Market Dynamics & Industry Analysis
- 3.1 Market Overview & Context
- 3.1.1 Japan Quartz Tubing Market Position in the Broader Automotive Value Chain
- 3.1.2 OEM vs. Replacement Market Dynamics
- 3.1.3 Market Maturity & Development Stage by Region
- 3.2 Japan Quartz Tubing Market Drivers
- 3.3 Japan Quartz Tubing Market Restraints & Challenges
- 3.4 Japan Quartz Tubing Market Opportunities
- 3.5 Porter's Five Forces Analysis
- 3.5.1 Threat of New Entrants
- 3.5.2 Bargaining Power of Suppliers
- 3.5.3 Bargaining Power of Buyers
- 3.5.4 Threat of Substitutes
- 3.5.5 Competitive Rivalry – Intensity Assessment
- 3.6 Japan Quartz Tubing Value Chain Analysis
- 3.6.1 Upstream – Raw Material/Input Suppliers
- 3.6.1.1 Raw Material/Input 1
- 3.6.1.2 Raw Material/Input 2
- 3.6.1.3 Raw Material/Input 3
- 3.6.2 Midstream – Production/Manufacturing/Service Delivery
- 3.6.2.1 Production/Process Overview
- 3.6.2.2 Key Facility Locations & Capacity by Manufacturer
- 3.6.3 Downstream – Distribution & End Consumer
- 3.6.3.1 Primary Channel – B2B/OEM
- 3.6.3.2 Secondary Channels – Dealer, Retail, Online, Direct
- 3.6.4 Value Chain Profitability Analysis
- 3.6.1 Upstream – Raw Material/Input Suppliers
- 3.7 PESTEL Analysis
- 3.7.1 Political Factors
- 3.7.2 Economic Factors
- 3.7.3 Social Factors
- 3.7.4 Technological Factors
- 3.7.5 Environmental Factors
- 3.7.6 Legal Factors
- 3.8 Japan Quartz Tubing Supply Chain Analysis
- 3.8.1 Raw Material/Input Supply Risk Assessment
- 3.8.2 Manufacturing Concentration Risk (Geographic Exposure)
- 3.8.3 Trade Disruption Impact Analysis
- 3.9 Regulatory & Policy Landscape
Note: The regulatory and policy landscape section covers regulations based on their applicability to the market, Japan Quartz Tubing category, geography, and scope of the study. Only regulatory frameworks with a material impact on operations, compliance, trade, sustainability, or market access are analyzed in detail.
Chapter 4. Key Investment Pockets & Opportunity Analysis
- 4.1 Japan Quartz Tubing Market Attractiveness Analysis
- 4.1.1 By Region – Investment Attractiveness Matrix (Volume × CAGR)
- 4.2 Absolute Revenue Growth Opportunity
- 4.2.1 By Region – Absolute USD Growth Through 2032
- 4.3 Incremental Volume Opportunity
- 4.3.1 By Region – Incremental Volume Through 2032
- 4.3.2 Segment – Incremental Volume
- 4.4 Emerging Submarket Opportunity Deep Dive (Subject to Applicability)
- 4.5 Emerging Market Opportunity Scorecards
- 4.5.1 United States
- 4.5.2 Europe
- 4.5.3 Asia
- 4.5.4 Middle East & Africa
Note: Emerging Market Opportunity Scorecards will be included based on relevance and strategic importance. Regions listed are indicative and may vary depending on data availability and market dynamics.
Chapter 5. Japan Quartz Tubing Import-Export Analysis & Trade Flows
- 5.1 Global Trade Overview
- 5.1.1 Global Export Value by Country (2024)
- 5.1.2 Global Export Volume by Country (2024)
- 5.1.3 Global Import Value by Country (2024)
- 5.1.4 Global Import Volume by Country (2024)
- 5.1.5 Net Trade Balance by Country (2024)
- 5.2 Export Analysis – Segment
- 5.2.1 Type 1 (HS Code)
- 5.2.2 Type 2 (HS Code)
- 5.2.3 Type 3 (HS Code)
- 5.2.4 Type 4 (HS Code)
- 5.2.5 Type 5 (HS Code)
- 5.3 Import Analysis – Segment
- 5.3.1 Type 1 (HS Code)
- 5.3.2 Type 2 (HS Code)
- 5.3.3 Type 3 (HS Code)
- 5.3.4 Type 4 (HS Code)
- 5.3.5 Type 5 (HS Code)
- 5.4 Average Unit Trade Prices
- 5.4.1 Average Export Price – Segment & Country
- 5.4.2 Average Import Price – Segment & Source Country
- 5.4.3 Price Trends (2024)
- 5.5 Key Trade Route Analysis
- 5.5.1 Trade Route 1
- 5.5.2 Trade Route 2
- 5.5.3 Trade Route 3
- 5.5.4 Trade Route 4
- 5.5.5 Trade Route 5
- 5.6 Trade Policy Impact Assessment
- 5.6.1 US Anti-Dumping & Section 301 Tariffs
- 5.6.2 EU Customs Union Impact
- 5.6.3 Major Free Trade Agreements
- 5.6.4 USMCA Rules of Origin
Note: Trade policy analysis will be included only where relevant to the Japan Quartz Tubing market.
Chapter 6. Competitive Landscape & Company Benchmarking
- 6.1 Japan Quartz Tubing Market Concentration & Structure
- 6.1.1 Herfindahl-Hirschman Index (HHI) – vs. 2024
- 6.1.2 Tier 1, Tier 2 & Tier 3 Market Structure
- 6.1.3 Global, Regional & Local Player Dynamics
- 6.2 Japan Quartz Tubing Market Share Analysis – 2024
- 6.2.1 Global Revenue Share by Company
- 6.2.2 Global Volume Share by Company
- 6.2.3 Regional Revenue Share
- 6.2.4 Market Share Evolution ( vs. 2024)
- 6.2.5 OEM Segment Share by Company
- 6.2.6 Replacement Segment Share by Company
- 6.3 Production/Delivery Capacity & Facility Analysis
- 6.3.1 Global Installed Capacity
- 6.3.2 Capacity Utilization Rates
- 6.3.3 Production/Output Volume
- 6.3.4 Facility Locations & Capacity Map
- 6.3.5 Planned Capacity Additions
- 6.4 Japan Quartz Tubing Competitive Benchmarking Matrix
- 6.4.1 Revenue, Volume, CAGR & Profitability Comparison
- 6.4.2 Channel Revenue Mix
- 6.4.3 Geographic Revenue Exposure
- 6.4.4 R&D Intensity
- 6.4.5 Sustainability Maturity
- 6.5 Strategic Developments in Japan Quartz Tubing (Last 24 Months)
- 6.5.1 Mergers, Acquisitions & Divestments
- 6.5.2 New Japan Quartz Tubing Launches
- 6.5.3 Facility Expansions
- 6.5.4 Strategic Alliances, Joint Ventures & Partnerships
- 6.5.5 Distribution Expansion & Market Entry
- 6.5.6 Sustainability & ESG Initiatives
- 6.6 Competitive Strategy Mapping
- 6.6.1 Leader, Challenger, Follower & Niche Classification
- 6.6.2 Pricing Strategy Comparison
- 6.6.3 Channel Strategy Matrix
Note: Strategic developments are included based on their materiality and the availability of reliable information.
Chapter 7. Global Japan Quartz Tubing Market – By Distribution Channel
- 7.1 Segment Overview
- 7.1.1 Volume & Revenue Split by Channel (2024 & 2032)
- 7.1.2 Channel Mix Evolution (2024-2032)
Chapter 8. Regional Market Analysis – Global Overview
- 8.1 Global Regional Overview
- 8.1.1 Regional Volume Share
- 8.1.2 Regional Revenue Share
- 8.1.3 Regional Volume by Region
- 8.1.4 Regional Revenue by Region
- 8.1.5 Regional Forecast Through 2032
- 8.2 Cross-Regional Segment Analysis
- 8.2.1 By Distribution Channel
- 8.2.2 By Brand/Price Tier
Chapter 9. North America Japan Quartz Tubing Market
- 9.1 United States
- 9.2 Canada
- 9.3 Mexico
Chapter 10. Europe Japan Quartz Tubing Market
- 10.1 Germany
- 10.2 France
- 10.3 Italy
- 10.4 United Kingdom
- 10.5 Spain
- 10.6 Poland
- 10.7 Russia
- 10.8 Netherlands
- 10.9 Belgium
- 10.10 Sweden
- 10.11 Denmark
- 10.12 Norway
- 10.13 Rest of Europe
Chapter 11. Asia Pacific Japan Quartz Tubing Market
- 11.1 China
- 11.2 India
- 11.3 Japan
- 11.4 South Korea
- 11.5 Thailand
- 11.6 Indonesia
- 11.7 Vietnam
- 11.8 Malaysia
- 11.9 Australia
- 11.10 Rest of Asia Pacific
Chapter 12. Latin America Japan Quartz Tubing Market
- 12.1 Brazil
- 12.2 Argentina
- 12.3 Colombia
- 12.4 Chile
- 12.5 Rest of Latin America
Chapter 13. Middle East Japan Quartz Tubing Market
- 13.1 Saudi Arabia
- 13.2 United Arab Emirates
- 13.3 Turkey
- 13.4 Israel
- 13.5 Iran
- 13.6 Rest of the Middle East
Chapter 14. Africa Japan Quartz Tubing Market
- 14.1 South Africa
- 14.2 Egypt
- 14.3 Nigeria
- 14.4 Morocco
- 14.5 Rest of Africa
Chapter 15. Japan Quartz Tubing Company Profiles
- 15.1 [Company 01]
- 15.1.1 Company Overview
- 15.1.2 Key Management Personnel
- 15.1.3 Products & Services Portfolio
- 15.1.4 Financial Performance
- 15.1.5 Key Market Focus & Geographic Presence
- 15.1.6 Recent Developments & Strategic Initiatives
Note: The company profile list is preliminary and may change based on research findings, market developments, data availability, and client requirements.
Chapter 16. Appendices
- Appendix A – List of Abbreviations & Acronyms
- Appendix B – Industry Classification Code Reference – Full Series
- Appendix C – Production & Capacity Data Tables
- Appendix D – End-Use & Demand Base Tables
- Appendix E – Consumption & Replacement Rate Assumptions
- Appendix F – ASP Reference Tables
- Appendix G – Manufacturing & Facility Database
- Appendix H – Import-Export Data Tables
- Appendix I – Regulatory Summary Tables
- Appendix J – Primary Research Participant List (Anonymized)
- Appendix K – Primary Research Questionnaire Framework
- Appendix L – Data Sources & Bibliography
- Appendix M – Market Size Divergence & Source Comparison
Chapter 17. Research Methodology
- 17.1 Research Framework & Philosophy
- 17.2 Secondary Research – Sources, Hierarchy & Data Extraction
- 17.3 Data Modeling – Bottom-Up & Top-Down Market Sizing
- 17.4 Primary Research – Stakeholder Framework, LOI & Sample Sizes
- 17.5 Forecast Methodology – Regression, Scenario & Sensitivity Analysis
- 17.6 Quality Control – Four-Layer Validation Framework
- 17.7 Limitations & Standard Assumptions
- 17.8 Disclaimer
