
Market Overview:
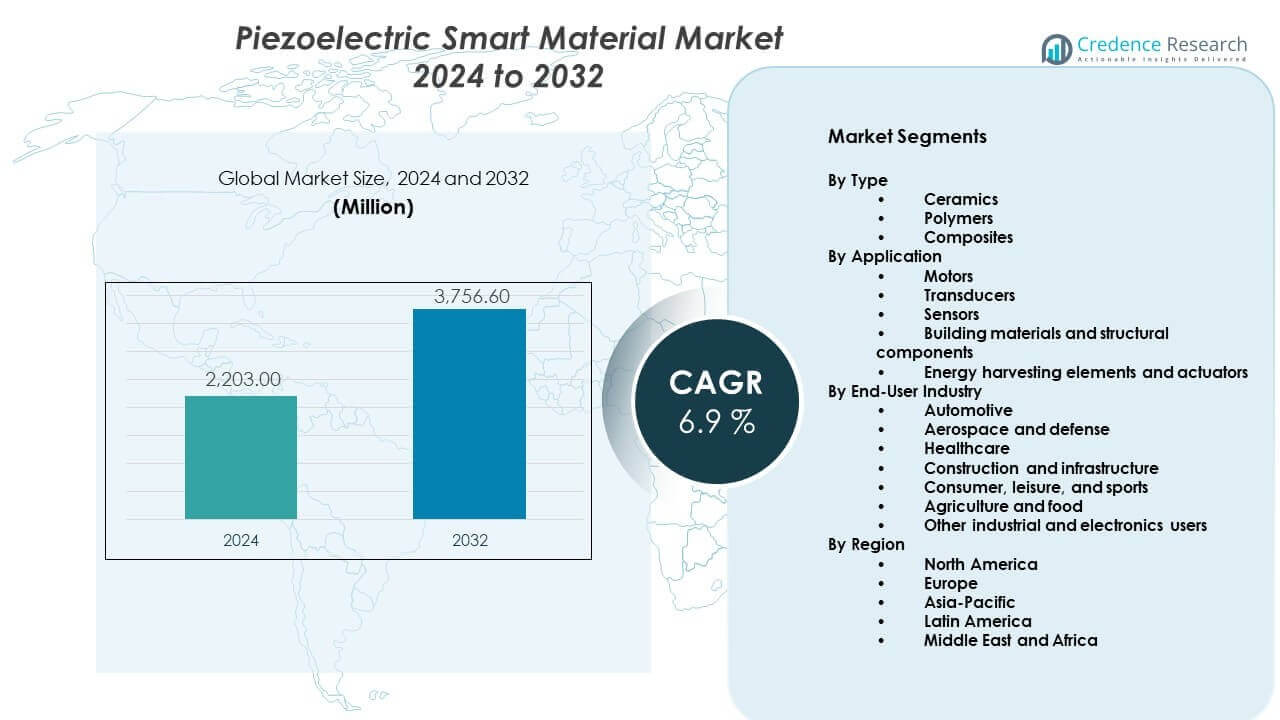
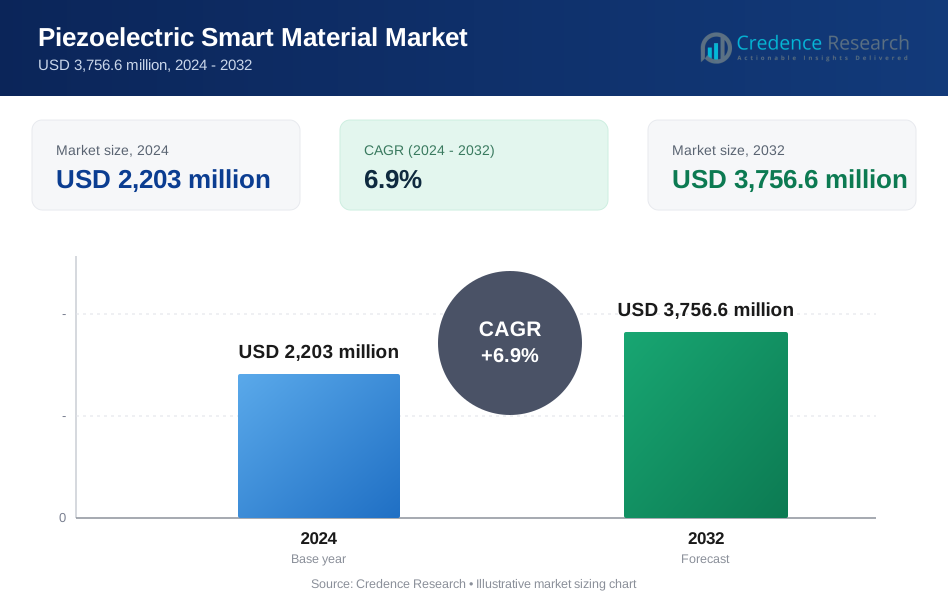
The Piezoelectric smart material market is projected to grow from USD 2,203 million in 2024 to an estimated USD 3,756.6 million by 2032. This expansion reflects a compound annual growth rate of 6.9% from 2024 to 2032.
| REPORT ATTRIBUTE | DETAILS |
|---|---|
| Historical Period | 2020-2023 |
| Base Year | 2024 |
| Forecast Period | 2025-2032 |
| Piezoelectric Smart Material Market Size 2024 | USD 2,203 million |
| Piezoelectric Smart Material Market, CAGR | 6.9% |
| Piezoelectric Smart Material Market Size 2032 | USD 3,756.6 million |
Market growth is driven by rising automation across industries and strong demand for precise sensing solutions. Manufacturers use piezoelectric materials for accurate motion control and vibration sensing. Electronics miniaturization supports wider integration in compact devices. Healthcare equipment depends on stable pressure and motion control for diagnostics. Automotive systems rely on these materials for fuel management and safety features. Energy harvesting needs also support demand in low-power devices. Improved material durability increases confidence among end users.
Asia Pacific leads the market due to strong electronics and automotive manufacturing bases. China, Japan, and South Korea dominate production and consumption due to large-scale industrial output. North America shows stable growth supported by aerospace, defense, and medical innovation. The United States invests in advanced manufacturing systems using smart materials. Europe remains strong due to automotive engineering and industrial automation. Emerging regions grow steadily as infrastructure upgrades and industrial digitization expand adoption.
Market Insights:
- The market size stood at USD 2,203 million in 2024 and is projected to reach USD 3,756.6 million by 2032, expanding at a CAGR of 6.9% during the forecast period.
- Asia-Pacific leads with about 35% share, followed by North America at 28% and Europe at 25%, driven by strong electronics, automotive, healthcare, and industrial manufacturing bases.
- Asia-Pacific also remains the fastest-growing region, supported by large-scale production capacity, infrastructure upgrades, and rising adoption of smart sensors across industries.
- By type, ceramics account for nearly 55% share due to high sensitivity, durability, and wide use across automotive, industrial, and medical applications.
- By application, sensors hold around 40% share, supported by rising demand for pressure, vibration, and motion detection in automation, healthcare, and smart infrastructure.
Market Drivers:
Rising Demand For Precision Control Across Industrial And Electronic Systems
Manufacturers seek high precision in sensing and actuation systems across industries. Piezoelectric materials deliver fast response and repeatable output under controlled conditions. Industrial automation depends on stable motion control components to maintain process accuracy. Electronics producers value compact form factors that support dense circuit layouts. The Piezoelectric smart material market benefits from rising precision requirements across equipment design. Equipment designers prefer materials with low signal distortion and high sensitivity. System reliability supports long production cycles in manufacturing environments. Performance consistency strengthens long-term procurement and supplier selection decisions.
- For instance, TDK Corporation supplies multilayer piezo actuators with response times below 1 ms for factory automation systems.
Expansion Of Automotive Applications Focused On Safety And Efficiency
Vehicle systems require accurate pressure, vibration, and motion control solutions. Piezo materials support fuel injection systems and advanced braking functions. Automakers use sensor-based controls to meet strict emission standards. Driver assistance systems depend on reliable feedback signals for safe operation. The Piezoelectric smart material market gains traction within modern mobility platforms. Electric vehicles require compact and energy-efficient components. Material durability supports exposure to heat and mechanical stress. OEM adoption drives stable volume demand across vehicle segments.
- For instance, Bosch uses piezo fuel injectors capable of over 5 injections per combustion cycle for diesel engines.
Growing Adoption Within Medical Devices And Diagnostic Equipment
Healthcare devices require controlled motion and high sensitivity for accurate diagnostics. Piezo components enable precise imaging, pumping, and monitoring functions. Medical tools depend on stable frequency output during extended use. Device miniaturization supports wider clinical and home-care adoption. The Piezoelectric smart material market aligns with ongoing healthcare innovation. Hospitals prefer components with long service life and minimal drift. Regulatory compliance favors materials with proven performance history. Consistent accuracy supports improved patient outcomes and device trust.
Increased Focus On Energy Harvesting And Smart Infrastructure Systems
Low-power systems require alternative energy sources for remote operation. Piezo materials convert mechanical stress into usable electrical energy. Smart infrastructure deploys sensors in locations with limited power access. Maintenance reduction supports adoption of self-powered sensing systems. The Piezoelectric smart material market supports long-term smart city deployments. Infrastructure planners value autonomous monitoring solutions. Long operational life reduces service intervention needs. System efficiency supports public and private investment priorities.
Market Trends:
Shift Toward Lead-Free And Environmentally Safer Material Compositions
Environmental standards influence material selection across end-use industries. Manufacturers focus on reducing lead content in piezoelectric formulations. Compliance needs shape research and product development priorities. End users prefer safer material profiles for long-term deployment. The Piezoelectric smart material market reflects stronger sustainability alignment. Regulatory acceptance improves market access across regions. Certification supports broader industrial use. Green material adoption strengthens supplier credibility.
- For instance, Murata Manufacturing Co., Ltd. commercialized lead-free piezo ceramics meeting RoHS standards for consumer electronics.
Integration Of Piezoelectric Materials With Digital And Smart Control Systems
Industrial systems adopt sensors compatible with digital control platforms. Piezo components support real-time signal processing needs. Smart factories require fast and accurate feedback loops. System designers favor materials that integrate with IoT frameworks. The Piezoelectric smart material market aligns with connected manufacturing trends. Embedded intelligence improves operational visibility. Digital calibration enhances measurement accuracy. Integration supports scalable automation architectures.
- For instance, TE Connectivity integrates piezo sensors with digital outputs supporting kHz-level signal sampling.
Rising Customization For Application-Specific Performance Requirements
End users demand materials tuned for specific operating conditions. Manufacturers adjust sensitivity and frequency response levels. Custom solutions improve efficiency across targeted applications. Industry-specific requirements guide material engineering strategies. The Piezoelectric smart material market supports tailored performance delivery. Aerospace and medical sectors seek precise specifications. Collaboration shortens development cycles. Customization strengthens long-term customer relationships.
Advancement In Thin Film And Flexible Piezoelectric Technologies
Flexible electronics gain traction across consumer and medical devices. Thin film piezo materials support lightweight system designs. Wearable devices require mechanical flexibility and durability. Manufacturers invest in advanced deposition techniques. The Piezoelectric smart material market expands into flexible applications. Design freedom improves product innovation. Reduced material thickness supports compact layouts. Technology progress enables new device categories.
Market Challenges Analysis:
High Manufacturing Costs And Process Complexity Constraints
Material production requires strict control over processing conditions. Advanced equipment increases capital investment requirements. Quality consistency remains difficult at scale. Minor defects can impact functional performance. The Piezoelectric smart material market faces pricing pressure from buyers. Cost sensitivity limits adoption in low-margin sectors. Skilled workforce availability affects output stability. Process optimization remains a key challenge.
Performance Stability Issues Under Harsh Environmental Conditions
Temperature changes affect electrical response characteristics. Moisture exposure reduces long-term material stability. Mechanical stress accelerates fatigue in demanding applications. Designers must add protective system measures. The Piezoelectric smart material market must address durability limits. Extended testing increases development timelines. Environmental constraints restrict certain deployments. Reliability improvement remains a focus area.
Market Opportunities:
Growing Adoption Across Wearable Electronics And Health Monitoring Devices
Wearable products require compact and responsive sensing solutions. Piezo materials support motion and pressure detection functions. Health monitoring devices gain wider consumer acceptance. Energy efficiency remains critical for battery-powered systems. The Piezoelectric smart material market benefits from wearable growth trends. Flexible designs improve user comfort. Device innovation supports premium product offerings. Consumer health awareness drives demand.
Expansion Within Smart Manufacturing And Predictive Maintenance Systems
Industries adopt sensors for equipment health monitoring. Piezo components enable accurate vibration and stress detection. Predictive maintenance reduces unexpected downtime. Manufacturers invest in smart production environments. The Piezoelectric smart material market aligns with digital manufacturing goals. Operational efficiency drives sensor integration. Data-driven maintenance improves asset utilization. Automation expansion supports long-term market growth.
Market Segmentation Analysis:
By Type
Ceramics dominate due to high sensitivity, strong electromechanical coupling, and stable performance in demanding systems. These materials support precision applications across automotive, industrial, and medical devices. Polymers gain adoption where flexibility, low weight, and impact resistance matter. These materials suit wearable electronics and flexible sensors. Composites combine ceramic performance with polymer flexibility to balance sensitivity and durability. This type supports customized designs across advanced engineering uses. Material selection depends on cost targets, mechanical needs, and operating conditions.
- For instance, CeramTec GmbH produces piezoceramics with coupling coefficients above 70% for medical ultrasound.
By Application
Motors rely on piezo materials for precise motion control and fast response. Transducers use these materials to convert mechanical signals with high accuracy. Sensors form a major application area due to demand for pressure, vibration, and force detection. Building materials and structural components integrate piezo elements for structural health monitoring. Energy harvesting elements and actuators support low-power systems and smart infrastructure. Application growth aligns with automation and smart system deployment. Performance reliability remains a key selection factor.
- For instance, Kistler Group deploys piezo sensors measuring forces above 300 kN in industrial testing systems.
By End-User Industry
Automotive leads usage through fuel systems, braking, and safety controls. Aerospace and defense depend on accuracy and durability under extreme conditions. Healthcare adopts these materials for imaging, pumps, and monitoring devices. Construction and infrastructure use smart materials for condition monitoring. Consumer, leisure, and sports products apply compact sensors and actuators. Agriculture and food sectors adopt sensing for process control. Other industrial and electronics users expand demand across factory automation. The Piezoelectric smart material market reflects broad multi-industry adoption trends.
Segmentation:
By Type
- Ceramics
- Polymers
- Composites
By Application
- Motors
- Transducers
- Sensors
- Building materials and structural components
- Energy harvesting elements and actuators
By End-User Industry
- Automotive
- Aerospace and defense
- Healthcare
- Construction and infrastructure
- Consumer, leisure, and sports
- Agriculture and food
- Other industrial and electronics users
By Region
- North America
- U.S.
- Canada
- Mexico
- Europe
- Germany
- France
- U.K.
- Italy
- Spain
- Rest of Europe
- Asia Pacific
- China
- Japan
- India
- South Korea
- South-east Asia
- Rest of Asia Pacific
- Latin America
- Brazil
- Argentina
- Rest of Latin America
- Middle East & Africa
- GCC Countries
- South Africa
- Rest of the Middle East and Africa
Regional Analysis:
North America
North America holds a significant share of the global market, accounting for around 28%. The region benefits from strong demand across aerospace, defense, and medical device manufacturing. The United States leads due to high investment in advanced sensors and precision control systems. Research activity supports material innovation and product reliability. Industrial automation sustains steady adoption across manufacturing facilities. The Piezoelectric smart material market maintains stable growth in this region due to mature end-user industries.
Europe
Europe represents nearly 25% of the global market share, supported by automotive engineering and industrial automation strength. Germany, France, and the United Kingdom drive demand through advanced manufacturing systems. Automotive applications rely on piezo components for safety and efficiency control. Healthcare technology also supports steady material use. Strict quality standards favor proven material performance. The Piezoelectric smart material market benefits from strong regulatory compliance and engineering expertise across Europe.
Asia-Pacific and Rest of the World
Asia-Pacific leads with approximately 35% market share due to large-scale electronics and automotive production. China, Japan, and South Korea dominate consumption through high-volume manufacturing. Cost-efficient production supports competitive supply chains. Infrastructure modernization supports sensor deployment. Latin America holds about 7% share with gradual industrial adoption. Middle East and Africa account for nearly 5%, supported by infrastructure and energy projects. The Piezoelectric smart material market gains momentum in emerging regions due to expanding industrial activity.
Key Player Analysis:
- Arkema
- APC International, Ltd.
- CeramTec GmbH
- CTS Corporation
- KYOCERA Corporation
- AAC Technologies
- Solvay
- Murata Manufacturing Co., Ltd.
- TDK Corporation
- TE Connectivity
- Morgan Advanced Materials
- PI Ceramic / Physik Instrumente (PI) GmbH & Co. KG
- Kistler Group
Competitive Analysis:
The Piezoelectric smart material market shows a partially consolidated structure with global and regional suppliers competing on performance and reliability. Large manufacturers focus on advanced ceramics, polymers, and composite formulations to serve high-precision applications. Product quality, material consistency, and long service life define competitive strength. Companies invest in application-specific solutions for automotive, healthcare, and industrial automation. Technology depth supports differentiation across sensors, actuators, and transducers. Strategic partnerships strengthen access to end-user industries. Cost control and scalable manufacturing support volume demand. The Piezoelectric smart material market maintains competition through innovation focus and strong customer integration.
Recent Developments:
- In September 2025, Arkema showcased major innovations at K2025 Düsseldorf, including expansion of Kynar® PVDF production in the US and launching a new Rilsan® Clear polyamide production facility in Singapore (operational Q1 2026), advancing its Piezotech® electroactive polymers portfolio for sensors, actuators, and energy harvesting.
Report Coverage:
The research report offers an in-depth analysis based on type, application, end-user industry, and region. It details leading market players, providing an overview of their business, product offerings, investments, revenue streams, and key applications. Additionally, the report includes insights into the competitive environment, SWOT analysis, current market trends, as well as the primary drivers and constraints. Furthermore, it discusses various factors that have driven market expansion in recent years. The report also explores market dynamics, regulatory scenarios, and technological advancements that are shaping the industry. It assesses the impact of external factors and global economic changes on market growth. Lastly, it provides strategic recommendations for new entrants and established companies to navigate the complexities of the market.
Future Outlook:
- Demand will rise with wider adoption of smart sensing systems.
- Automotive safety and efficiency needs will support steady material use.
- Healthcare devices will rely more on precise motion control materials.
- Flexible and thin film technologies will expand application scope.
- Lead-free material development will gain regulatory support.
- Smart infrastructure projects will increase sensor deployment.
- Custom material solutions will strengthen supplier relationships.
- Energy harvesting use cases will support low-power systems.
- Asia-Pacific manufacturing expansion will shape supply chains.
- Continuous research will improve durability and performance stability.
Request a Free Sample
Fill in your details and we'll send you a free sample report.
- Sample data tables & charts
- Research methodology
Need a Custom Version of This Report?
Tailor the scope, geography, or segments to your exact requirements.
- Custom geography or segment scope
- Direct access to our analyst team
Frequently Asked Questions
What is the current market size for Piezoelectric smart material market, and what is its projected size in 2032?
At what Compound Annual Growth Rate is the Piezoelectric smart material market projected to grow between 2025 and 2032?
Which Piezoelectric smart material market segment held the largest share in 2024?
What are the primary factors fueling the growth of the Piezoelectric smart material market?
Who are the leading companies in the Piezoelectric smart material market?
Which region commanded the largest share of the Piezoelectric smart material market in 2024?
Table of Content
Chapter 1. Report Introduction
- 1.1 Report Description & Purpose
- 1.1.1 Report Title & Market Definition
- 1.1.2 Unique Selling Propositions (USP) & Key Differentiators
- 1.1.3 Value Proposition for Stakeholders
- 1.2 Research Objectives
- 1.2.1 Market Sizing Objectives (Volume & Revenue)
- 1.2.2 Segmentation Objectives
- 1.2.3 Competitive Intelligence Objectives
- 1.2.4 Forecast & Scenario Objectives
- 1.3 Report Scope
- 1.3.1 Piezoelectric Smart Material Scope – Types & Subtypes Covered
- 1.3.2 Geographic Scope – Regions & Countries Covered
- 1.3.3 Historical Period, Base Year & Forecast Period (2024; forecast to 2032)
- 1.3.4 Inclusions & Exclusions
- 1.4 HS Code & Classification Framework
- 1.5 Currency, Units & Pricing Basis
- 1.6 Target Stakeholders
- 1.7 Limitations & Assumptions
Chapter 2. Executive Summary
- 2.1 Global Piezoelectric Smart Material Market Snapshot
- 2.1.1 Market Size – Historical (2024) & Forecast (2024-2032) (2024: USD 2,203 million → 2032: USD 3,756.6 million)
- 2.1.2 Volume & Revenue – Global Totals
- 2.1.3 Key Market Highlights – Top Five Facts
- 2.2 Piezoelectric Smart Material Market Segmentation Snapshot
- 2.2.1 Market Split by Region – 2024 vs. 2032
- 2.3 Competitive Snapshot
- 2.3.1 Top 10 Players by Revenue Share – 2024
- 2.3.2 Top 10 Players by Volume Share – 2024
- 2.3.3 Recent Strategic Developments (18-Month Summary)
- 2.4 Key Investment Highlights & Strategic Conclusions
Chapter 3. Piezoelectric Smart Material Market Dynamics & Industry Analysis
- 3.1 Market Overview & Context
- 3.1.1 Piezoelectric Smart Material Market Position in the Broader Automotive Value Chain
- 3.1.2 OEM vs. Replacement Market Dynamics
- 3.1.3 Market Maturity & Development Stage by Region
- 3.2 Piezoelectric Smart Material Market Drivers
- 3.3 Piezoelectric Smart Material Market Restraints & Challenges
- 3.4 Piezoelectric Smart Material Market Opportunities
- 3.5 Porter's Five Forces Analysis
- 3.5.1 Threat of New Entrants
- 3.5.2 Bargaining Power of Suppliers
- 3.5.3 Bargaining Power of Buyers
- 3.5.4 Threat of Substitutes
- 3.5.5 Competitive Rivalry – Intensity Assessment
- 3.6 Piezoelectric Smart Material Value Chain Analysis
- 3.6.1 Upstream – Raw Material/Input Suppliers
- 3.6.1.1 Raw Material/Input 1
- 3.6.1.2 Raw Material/Input 2
- 3.6.1.3 Raw Material/Input 3
- 3.6.2 Midstream – Production/Manufacturing/Service Delivery
- 3.6.2.1 Production/Process Overview
- 3.6.2.2 Key Facility Locations & Capacity by Manufacturer
- 3.6.3 Downstream – Distribution & End Consumer
- 3.6.3.1 Primary Channel – B2B/OEM
- 3.6.3.2 Secondary Channels – Dealer, Retail, Online, Direct
- 3.6.4 Value Chain Profitability Analysis
- 3.6.1 Upstream – Raw Material/Input Suppliers
- 3.7 PESTEL Analysis
- 3.7.1 Political Factors
- 3.7.2 Economic Factors
- 3.7.3 Social Factors
- 3.7.4 Technological Factors
- 3.7.5 Environmental Factors
- 3.7.6 Legal Factors
- 3.8 Piezoelectric Smart Material Supply Chain Analysis
- 3.8.1 Raw Material/Input Supply Risk Assessment
- 3.8.2 Manufacturing Concentration Risk (Geographic Exposure)
- 3.8.3 Trade Disruption Impact Analysis
- 3.9 Regulatory & Policy Landscape
Note: The regulatory and policy landscape section covers regulations based on their applicability to the market, Piezoelectric Smart Material category, geography, and scope of the study. Only regulatory frameworks with a material impact on operations, compliance, trade, sustainability, or market access are analyzed in detail.
Chapter 4. Key Investment Pockets & Opportunity Analysis
- 4.1 Piezoelectric Smart Material Market Attractiveness Analysis
- 4.1.1 By Region – Investment Attractiveness Matrix (Volume × CAGR)
- 4.2 Absolute Revenue Growth Opportunity
- 4.2.1 By Region – Absolute USD Growth Through 2032
- 4.3 Incremental Volume Opportunity
- 4.3.1 By Region – Incremental Volume Through 2032
- 4.3.2 Segment – Incremental Volume
- 4.4 Emerging Submarket Opportunity Deep Dive (Subject to Applicability)
- 4.5 Emerging Market Opportunity Scorecards
- 4.5.1 United States
- 4.5.2 Europe
- 4.5.3 Asia
- 4.5.4 Middle East & Africa
Note: Emerging Market Opportunity Scorecards will be included based on relevance and strategic importance. Regions listed are indicative and may vary depending on data availability and market dynamics.
Chapter 5. Piezoelectric Smart Material Import-Export Analysis & Trade Flows
- 5.1 Global Trade Overview
- 5.1.1 Global Export Value by Country (2024)
- 5.1.2 Global Export Volume by Country (2024)
- 5.1.3 Global Import Value by Country (2024)
- 5.1.4 Global Import Volume by Country (2024)
- 5.1.5 Net Trade Balance by Country (2024)
- 5.2 Export Analysis – Segment
- 5.2.1 Type 1 (HS Code)
- 5.2.2 Type 2 (HS Code)
- 5.2.3 Type 3 (HS Code)
- 5.2.4 Type 4 (HS Code)
- 5.2.5 Type 5 (HS Code)
- 5.3 Import Analysis – Segment
- 5.3.1 Type 1 (HS Code)
- 5.3.2 Type 2 (HS Code)
- 5.3.3 Type 3 (HS Code)
- 5.3.4 Type 4 (HS Code)
- 5.3.5 Type 5 (HS Code)
- 5.4 Average Unit Trade Prices
- 5.4.1 Average Export Price – Segment & Country
- 5.4.2 Average Import Price – Segment & Source Country
- 5.4.3 Price Trends (2024)
- 5.5 Key Trade Route Analysis
- 5.5.1 Trade Route 1
- 5.5.2 Trade Route 2
- 5.5.3 Trade Route 3
- 5.5.4 Trade Route 4
- 5.5.5 Trade Route 5
- 5.6 Trade Policy Impact Assessment
- 5.6.1 US Anti-Dumping & Section 301 Tariffs
- 5.6.2 EU Customs Union Impact
- 5.6.3 Major Free Trade Agreements
- 5.6.4 USMCA Rules of Origin
Note: Trade policy analysis will be included only where relevant to the Piezoelectric Smart Material market.
Chapter 6. Competitive Landscape & Company Benchmarking
- 6.1 Piezoelectric Smart Material Market Concentration & Structure
- 6.1.1 Herfindahl-Hirschman Index (HHI) – vs. 2024
- 6.1.2 Tier 1, Tier 2 & Tier 3 Market Structure
- 6.1.3 Global, Regional & Local Player Dynamics
- 6.2 Piezoelectric Smart Material Market Share Analysis – 2024
- 6.2.1 Global Revenue Share by Company
- 6.2.2 Global Volume Share by Company
- 6.2.3 Regional Revenue Share
- 6.2.4 Market Share Evolution ( vs. 2024)
- 6.2.5 OEM Segment Share by Company
- 6.2.6 Replacement Segment Share by Company
- 6.3 Production/Delivery Capacity & Facility Analysis
- 6.3.1 Global Installed Capacity
- 6.3.2 Capacity Utilization Rates
- 6.3.3 Production/Output Volume
- 6.3.4 Facility Locations & Capacity Map
- 6.3.5 Planned Capacity Additions
- 6.4 Piezoelectric Smart Material Competitive Benchmarking Matrix
- 6.4.1 Revenue, Volume, CAGR & Profitability Comparison
- 6.4.2 Channel Revenue Mix
- 6.4.3 Geographic Revenue Exposure
- 6.4.4 R&D Intensity
- 6.4.5 Sustainability Maturity
- 6.5 Strategic Developments in Piezoelectric Smart Material (Last 24 Months)
- 6.5.1 Mergers, Acquisitions & Divestments
- 6.5.2 New Piezoelectric Smart Material Launches
- 6.5.3 Facility Expansions
- 6.5.4 Strategic Alliances, Joint Ventures & Partnerships
- 6.5.5 Distribution Expansion & Market Entry
- 6.5.6 Sustainability & ESG Initiatives
- 6.6 Competitive Strategy Mapping
- 6.6.1 Leader, Challenger, Follower & Niche Classification
- 6.6.2 Pricing Strategy Comparison
- 6.6.3 Channel Strategy Matrix
Note: Strategic developments are included based on their materiality and the availability of reliable information.
Chapter 7. Global Piezoelectric Smart Material Market – By Distribution Channel
- 7.1 Segment Overview
- 7.1.1 Volume & Revenue Split by Channel (2024 & 2032)
- 7.1.2 Channel Mix Evolution (2024-2032)
Chapter 8. Regional Market Analysis – Global Overview
- 8.1 Global Regional Overview
- 8.1.1 Regional Volume Share
- 8.1.2 Regional Revenue Share
- 8.1.3 Regional Volume by Region
- 8.1.4 Regional Revenue by Region
- 8.1.5 Regional Forecast Through 2032
- 8.2 Cross-Regional Segment Analysis
- 8.2.1 By Distribution Channel
- 8.2.2 By Brand/Price Tier
Chapter 9. North America Piezoelectric Smart Material Market
- 9.1 United States
- 9.2 Canada
- 9.3 Mexico
Chapter 10. Europe Piezoelectric Smart Material Market
- 10.1 Germany
- 10.2 France
- 10.3 Italy
- 10.4 United Kingdom
- 10.5 Spain
- 10.6 Poland
- 10.7 Russia
- 10.8 Netherlands
- 10.9 Belgium
- 10.10 Sweden
- 10.11 Denmark
- 10.12 Norway
- 10.13 Rest of Europe
Chapter 11. Asia Pacific Piezoelectric Smart Material Market
- 11.1 China
- 11.2 India
- 11.3 Japan
- 11.4 South Korea
- 11.5 Thailand
- 11.6 Indonesia
- 11.7 Vietnam
- 11.8 Malaysia
- 11.9 Australia
- 11.10 Rest of Asia Pacific
Chapter 12. Latin America Piezoelectric Smart Material Market
- 12.1 Brazil
- 12.2 Argentina
- 12.3 Colombia
- 12.4 Chile
- 12.5 Rest of Latin America
Chapter 13. Middle East Piezoelectric Smart Material Market
- 13.1 Saudi Arabia
- 13.2 United Arab Emirates
- 13.3 Turkey
- 13.4 Israel
- 13.5 Iran
- 13.6 Rest of the Middle East
Chapter 14. Africa Piezoelectric Smart Material Market
- 14.1 South Africa
- 14.2 Egypt
- 14.3 Nigeria
- 14.4 Morocco
- 14.5 Rest of Africa
Chapter 15. Piezoelectric Smart Material Company Profiles
- 15.1 [Company 01]
- 15.1.1 Company Overview
- 15.1.2 Key Management Personnel
- 15.1.3 Products & Services Portfolio
- 15.1.4 Financial Performance
- 15.1.5 Key Market Focus & Geographic Presence
- 15.1.6 Recent Developments & Strategic Initiatives
Note: The company profile list is preliminary and may change based on research findings, market developments, data availability, and client requirements.
Chapter 16. Appendices
- Appendix A – List of Abbreviations & Acronyms
- Appendix B – Industry Classification Code Reference – Full Series
- Appendix C – Production & Capacity Data Tables
- Appendix D – End-Use & Demand Base Tables
- Appendix E – Consumption & Replacement Rate Assumptions
- Appendix F – ASP Reference Tables
- Appendix G – Manufacturing & Facility Database
- Appendix H – Import-Export Data Tables
- Appendix I – Regulatory Summary Tables
- Appendix J – Primary Research Participant List (Anonymized)
- Appendix K – Primary Research Questionnaire Framework
- Appendix L – Data Sources & Bibliography
- Appendix M – Market Size Divergence & Source Comparison
Chapter 17. Research Methodology
- 17.1 Research Framework & Philosophy
- 17.2 Secondary Research – Sources, Hierarchy & Data Extraction
- 17.3 Data Modeling – Bottom-Up & Top-Down Market Sizing
- 17.4 Primary Research – Stakeholder Framework, LOI & Sample Sizes
- 17.5 Forecast Methodology – Regression, Scenario & Sensitivity Analysis
- 17.6 Quality Control – Four-Layer Validation Framework
- 17.7 Limitations & Standard Assumptions
- 17.8 Disclaimer
