
Market Overview
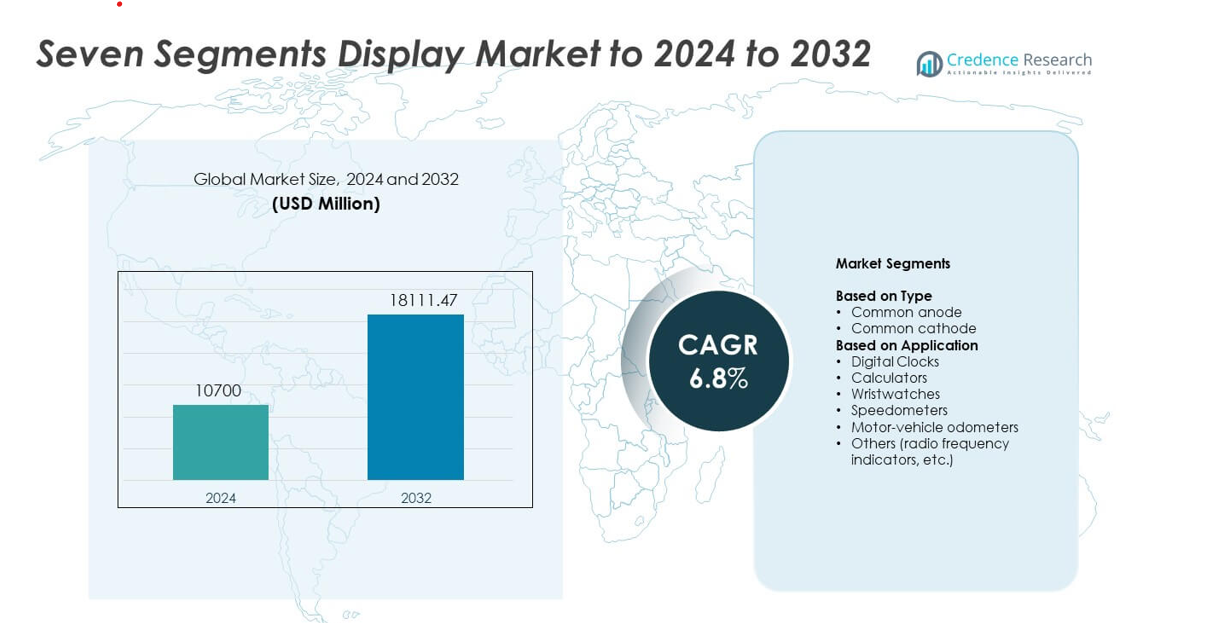
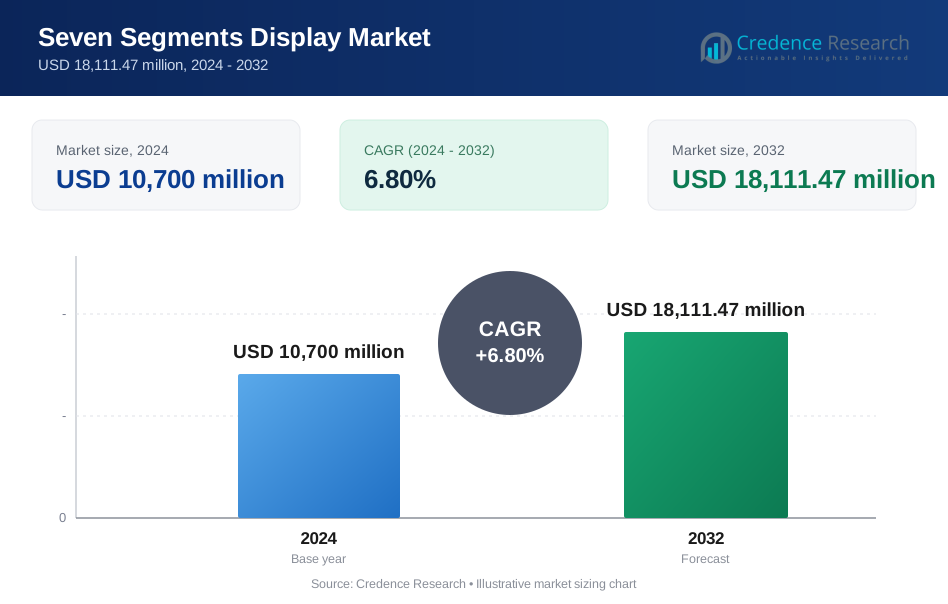
Seven Segments Display Market size was valued at USD 10,700 million in 2024 and is anticipated to reach USD 18,111.47 million by 2032, at a CAGR of 6.8% during the forecast period.
| REPORT ATTRIBUTE | DETAILS |
|---|---|
| Historical Period | 2020-2023 |
| Base Year | 2024 |
| Forecast Period | 2025-2032 |
| Seven Segments Display Market Size 2024 | USD 10,700 million |
| Seven Segments Display Market, CAGR | 6.8% |
| Seven Segments Display Market Size 2032 | USD 18,111.47 million |
NEC Corporation, Everlight Electronics, Lumex, Asian Electronics, Maxim Integrated, Nichia, Kingbright, LITE-ON, Avago, and Broadcom stand among the top players shaping the seven segments display market. North America leads the industry with about 32% share, supported by strong demand from industrial controls, automotive dashboards, and consumer devices. Asia-Pacific follows closely due to its vast electronics manufacturing base and rising use of compact LED indicators in appliances and low-cost equipment. Europe remains a stable market with steady adoption across automation, medical devices, and measurement tools. Competition stays intense as manufacturers focus on improving brightness, energy efficiency, and longer operational life while supporting high-volume production for global supply chains.
Market Insights
- The seven segments display market reached USD 10,700 million in 2024, is projected to rise to USD 18,111.47 million by 2032, and will expand at a 6.8% CAGR.
- Growth is driven by rising demand in industrial control panels, consumer electronics, and automotive dashboards where numeric indicators support clear, low-power information display.
- Trends include wider adoption of energy-efficient LED segments, compact module designs, and improved brightness uniformity that supports slim and portable devices.
- Competition intensifies as suppliers improve product life, thermal stability, and mass-production efficiency while facing cost pressure from low-margin display components.
- North America leads with about 26.4% share, Asia-Pacific grows fastest due to strong electronics manufacturing, and industrial applications hold the largest segment share due to heavy use in meters and diagnostic equipment.
Market Segmentation Analysis:
By Type
Common anode led the Seven Segments Display Market in 2024 with about 58% share. Strong demand came from consumer electronics and industrial devices that prefer stable brightness and lower power loss. Manufacturers use common anode designs because they work well with standard microcontrollers and simplify circuit layouts. The design also supports wide use in automotive dashboards and low-cost digital meters. Common cathode followed in use across compact devices, yet its share stayed lower due to higher driver requirements and limited compatibility with certain control systems.
- For instance, Samsung’s LM301B EVO mid-power LED reaches a typical luminous efficacy of 230 lm/W at 5000 K and 0.2 W, supporting highly efficient general lighting (e.g., offices, schools, warehouses) and horticulture lighting designs.
By Application
Digital clocks dominated the application segment in 2024 with nearly 34% share. High adoption came from consumer electronics, home devices, and commercial timers that rely on clear numeric output and long operating life. The segment grew as smart home products expanded and demand for low-cost display modules remained strong. Calculators and wristwatches continued stable production, while speedometers and motor-vehicle odometers gained steady use in basic instrument clusters. Other uses, including radio frequency indicators, supported niche demand across communication and measurement tools.
- For instance, Casio reported G-SHOCK timepiece unit sales of around 1.6 million in a single quarter, reflecting large-scale use of simple numeric digital displays in clocks and watches.
Key Growth Drivers
Rising demand in consumer and industrial electronics
Growing use of seven-segment displays in clocks, meters, and basic electronic devices drives steady adoption. Many manufacturers prefer this display type because it offers low cost, simple integration, and long operating life. Industrial systems such as panel meters and counters also rely on durable numeric displays that perform well in harsh settings. Expansion in low-power devices and stable demand from education tools further support market growth.
- For instance, Raspberry Pi has sold more than 68 million single-board computers (SBCs and compute modules) worldwide as of March 2025.
Expansion of automotive instrument clusters
Automotive applications sustain strong demand due to wide use in odometers, speedometers, and warning indicators. Seven-segment displays offer clear visibility, fast response, and reliable performance across varying temperatures. Their low failure rate makes them suitable for essential vehicle readouts. Growth in two-wheelers and economy vehicles, which still depend on simpler dashboard modules, strengthens long-term usage and drives consistent production volumes.
- For instance, the total annual global demand for motorcycles is approximately 49.4 million units, with production in India alone exceeding 21 million units and China at around 17 million units annually
Growth of low-cost embedded systems
Seven-segment displays remain popular in low-power embedded boards and training platforms used in education, hobby electronics, and small industrial tools. Developers choose these displays because they support easy interfacing and require minimal programming effort. Expanding microcontroller adoption increases the need for simple numeric output modules. Broad availability across global supply chains keeps prices stable and encourages scale across small and medium device makers.
Key Trends and Opportunities
Shift toward energy-efficient display modules
Manufacturers invest in displays with lower power draw to serve battery-powered devices and portable tools. LED-based seven-segment units improve efficiency while maintaining brightness and long service life. The trend supports greater use in handheld meters, compact timers, and consumer gadgets. Energy-focused product lines also help companies meet regulatory and sustainability goals, creating new upgrade opportunities across multiple industries.
- For instance, ams OSRAM’s DURIS E 2835 LED family is documented to achieve a typical luminous efficacy of about 225 lm/W (CRI 80 at 4000 K) at 0.5 W input power in high-performance general lighting applications such as downlights and linear luminaires.
Rising adoption in smart and connected devices
Growth in simple IoT equipment opens new avenues for seven-segment displays as numeric indicators for sensors, power units, and control panels. Many low-cost smart devices require quick-read outputs rather than complex screens. This shift encourages manufacturers to integrate compact displays that balance clarity and affordability. Increased use in home systems, small appliances, and industrial IoT nodes expands market reach.
- For instance, one study by the analyst firm Berg Insightestimated the installed base of connected building automation devices would reach 483 million units worldwide by 2022, reflecting the rapid growth of IoT integration in commercial buildings.
Opportunity in cost-sensitive emerging markets
Developing regions continue to prefer seven-segment displays due to affordability, easy repair, and stable supply. Demand rises in education products, low-cost meters, and household electronics that favor simple numeric output. Local manufacturing growth and rising small-scale electronics production create further opportunities. These markets offer strong volume potential for suppliers focused on durable and inexpensive display modules.
Key Challenges
Competition from advanced display technologies
Wider use of LCD and OLED modules reduces long-term demand in premium devices. These technologies offer multi-color output, higher detail, and flexible layouts, which attract many manufacturers. As feature-rich devices expand, seven-segment displays face limited roles outside basic numeric applications. The shift pressures suppliers to focus on cost leadership or niche industrial uses.
Limited functionality compared to modern interfaces
Seven-segment displays present only numeric data, restricting adoption in devices that require icons, text, or complex visuals. Consumer preference for richer interfaces affects markets such as wearables and advanced home gadgets. Developers may favor compact graphic displays that provide broader information in the same space. This constraint slows growth in innovation-driven product categories and narrows future application scope.
Regional Analysis
North America
North America held about 32% share of the Seven Segments Display Market in 2024, supported by strong demand from consumer electronics, industrial meters, and automotive clusters. Many device makers in the United States and Canada rely on stable numeric displays for timers, counters, and low-cost embedded systems. Growth continued as manufacturing plants upgraded control panels and as household electronics maintained steady sales. Adoption in educational kits and test equipment also helped sustain regional demand. Stable supply chains and ongoing use in basic digital devices kept the region influential in overall market activity.
Europe
Europe accounted for nearly 27% share in 2024, backed by strong industrial automation activity and broad use in automotive instrument panels. Manufacturers across Germany, France, Italy, and the UK integrated seven-segment modules into meters, safety equipment, and compact control systems. Demand stayed stable as industrial retrofits and small appliance production remained active. Use in consumer clocks, ovens, and basic household devices also supported shipments. Regulatory focus on energy-efficient components encouraged the adoption of improved LED segments, reinforcing the region’s consistent contribution to global market volumes.
Asia Pacific
Asia Pacific led the market with about 34% share in 2024, driven by large-scale electronics manufacturing across China, Japan, South Korea, and India. High production volumes in calculators, clocks, low-cost appliances, and learning kits strengthened regional dominance. Automotive and industrial equipment makers also used seven-segment displays in dashboards and panel meters. Expanding IoT device manufacturing created new demand for simple numeric indicators. Lower production costs and wide supplier networks supported high exports, keeping Asia Pacific the most significant contributor to the global Seven Segments Display Market.
Latin America
Latin America represented nearly 4% share in 2024, and demand grew from household electronics, automotive dashboards, and basic industrial tools. Markets in Brazil, Mexico, and Argentina used seven-segment displays in timers, low-cost appliances, and panel meters. Growth also came from education kits and entry-level electronic products. The region’s electronics supply chain continues to expand slowly, creating space for cost-effective display modules. Although competition from imported alternatives remains strong, steady adoption in consumer and industrial applications supports the region’s moderate but stable presence in the global market.
Middle East and Africa
Middle East and Africa held about 3% share in 2024, supported mainly by industrial applications, basic instrumentation, and affordable household electronics. Demand in GCC countries came from control panels, timers, and meters used in construction and energy projects. Broader regional adoption grew in low-cost appliances and educational electronics. Limited local manufacturing kept reliance on imported components high, yet stable needs in utility meters and digital counters maintained consistent usage. Slow but steady growth is expected as infrastructure and consumer electronics markets expand across key developing economies.
Market Segmentations:
By Type
- Common anode
- Common cathode
By Application
- Digital Clocks
- Calculators
- Wristwatches
- Speedometers
- Motor-vehicle odometers
- Others (radio frequency indicators, etc.)
By Geography
- North America
- U.S.
- Canada
- Mexico
- Europe
- Germany
- France
- U.K.
- Italy
- Spain
- Rest of Europe
- Asia Pacific
- China
- Japan
- India
- South Korea
- South-east Asia
- Rest of Asia Pacific
- Latin America
- Brazil
- Argentina
- Rest of Latin America
- Middle East & Africa
- GCC Countries
- South Africa
- Rest of the Middle East and Africa
Competitive Landscape
NEC Corporation, Everlight Electronics Co. Ltd., Lumex Inc., Asian Electronics, Maxim Integrated Products Inc., Nichia Corporation, Kingbright Electronic Co. Ltd., LITE-ON Technology Corporation, Avago Technologies, and Broadcom Inc. lead competition in the seven segments display market. The landscape shows steady innovation as suppliers improve brightness, durability, and power savings to meet new design needs. Many producers now focus on compact modules that support slim devices and tighter layouts. Firms also enhance color uniformity and viewing angles to support industrial meters, appliances, and control panels. Strong demand from consumer electronics and automotive equipment drives wider use of robust LED segments with longer service life. Most competitors invest in better packaging and thermal control to raise stability in harsh settings. Global distribution networks help reach diverse buyers, while ongoing product updates support design flexibility for engineers. The competitive field remains active as companies push reliable, low-cost, and energy-efficient digit displays.
Key Player Analysis
- NEC Corporation
- Everlight Electronics Co. Ltd.
- Lumex Inc.
- Asian Electronics
- Maxim Integrated Products Inc.
- Nichia Corporation
- Kingbright Electronic Co. Ltd.
- LITE-ON Technology Corporation
- Avago Technologies
- Broadcom Inc.
Recent Developments
- In 2025, Nichia Corporation launched additions to its PLS (Pixelated Light Solution) micro-pixelated LED line, including the µPLS Mini and DominoPLS.
- In 2025, Asian Electronics continues to expand its GALAXY-brand seven-segment LED portfolio, including multi-digit 0.56-inch modules for instruments, appliances, and industrial panels, with RoHS-compliant, low-current designs.
- In 2024, Avago (now Broadcom) seven-segment HDSP series received updated design documentation from Broadcom for 14.2-mm (0.56-inch) AlInGaP LED displays, reinforcing the legacy Avago numeric display line in high-visibility panels.
Report Coverage
The research report offers an in-depth analysis based on Type, Application, and Geography. It details leading market players, providing an overview of their business, product offerings, investments, revenue streams, and key applications. Additionally, the report includes insights into the competitive environment, SWOT analysis, current market trends, as well as the primary drivers and constraints. Furthermore, it discusses various factors that have driven market expansion in recent years. The report also explores market dynamics, regulatory scenarios, and technological advancements that are shaping the industry. It assesses the impact of external factors and global economic changes on market growth. Lastly, it provides strategic recommendations for new entrants and established companies to navigate the complexities of the market.
Future Outlook
- Demand will rise across low-cost consumer electronics and basic digital devices.
- Automotive clusters will continue using numeric displays for essential readouts.
- Industrial meters and control panels will sustain steady long-term adoption.
- Energy-efficient LED segments will gain wider preference among manufacturers.
- Emerging markets will drive strong volume growth through cost-focused production.
- IoT devices will use more simple numeric indicators for quick data visibility.
- Educational tools and learning kits will expand usage in training environments.
- Suppliers will focus on durability and longer operating life to stay competitive.
- Competition from advanced displays will push firms toward niche applications.
- Product upgrades will emphasize lower power use and compact module design.
Request a Free Sample
Fill in your details and we'll send you a free sample report.
- Sample data tables & charts
- Research methodology
Need a Custom Version of This Report?
Tailor the scope, geography, or segments to your exact requirements.
- Custom geography or segment scope
- Direct access to our analyst team
Frequently Asked Questions
What is the current market size for Seven Segments Display Market, and what is its projected size in 2032?
At what Compound Annual Growth Rate is the Seven Segments Display Market projected to grow beeen 2024 and 2032?
Which Seven Segments Display Market segment held the largest share in 2024?
What are the primary factors fueling the growth of the Seven Segments Display Market?
Who are the leading companies in the Seven Segments Display Market?
Table of Content
Chapter 1. Report Introduction
- 1.1 Report Description & Purpose
- 1.1.1 Report Title & Market Definition
- 1.1.2 Unique Selling Propositions (USP) & Key Differentiators
- 1.1.3 Value Proposition for Stakeholders
- 1.2 Research Objectives
- 1.2.1 Market Sizing Objectives (Volume & Revenue)
- 1.2.2 Segmentation Objectives
- 1.2.3 Competitive Intelligence Objectives
- 1.2.4 Forecast & Scenario Objectives
- 1.3 Report Scope
- 1.3.1 Seven Segments Display Scope – Types & Subtypes Covered
- 1.3.2 Geographic Scope – Regions & Countries Covered
- 1.3.3 Historical Period, Base Year & Forecast Period (2024; forecast to 2032)
- 1.3.4 Inclusions & Exclusions
- 1.4 HS Code & Classification Framework
- 1.5 Currency, Units & Pricing Basis
- 1.6 Target Stakeholders
- 1.7 Limitations & Assumptions
Chapter 2. Executive Summary
- 2.1 Global Seven Segments Display Market Snapshot
- 2.1.1 Market Size – Historical (2024) & Forecast (2024-2032) (2024: USD 10,700 million → 2032: USD 18,111.47 million)
- 2.1.2 Volume & Revenue – Global Totals
- 2.1.3 Key Market Highlights – Top Five Facts
- 2.2 Seven Segments Display Market Segmentation Snapshot
- 2.2.1 Market Split by Region – 2024 vs. 2032
- 2.3 Competitive Snapshot
- 2.3.1 Top 10 Players by Revenue Share – 2024
- 2.3.2 Top 10 Players by Volume Share – 2024
- 2.3.3 Recent Strategic Developments (18-Month Summary)
- 2.4 Key Investment Highlights & Strategic Conclusions
Chapter 3. Seven Segments Display Market Dynamics & Industry Analysis
- 3.1 Market Overview & Context
- 3.1.1 Seven Segments Display Market Position in the Broader Automotive Value Chain
- 3.1.2 OEM vs. Replacement Market Dynamics
- 3.1.3 Market Maturity & Development Stage by Region
- 3.2 Seven Segments Display Market Drivers
- 3.3 Seven Segments Display Market Restraints & Challenges
- 3.4 Seven Segments Display Market Opportunities
- 3.5 Porter's Five Forces Analysis
- 3.5.1 Threat of New Entrants
- 3.5.2 Bargaining Power of Suppliers
- 3.5.3 Bargaining Power of Buyers
- 3.5.4 Threat of Substitutes
- 3.5.5 Competitive Rivalry – Intensity Assessment
- 3.6 Seven Segments Display Value Chain Analysis
- 3.6.1 Upstream – Raw Material/Input Suppliers
- 3.6.1.1 Raw Material/Input 1
- 3.6.1.2 Raw Material/Input 2
- 3.6.1.3 Raw Material/Input 3
- 3.6.2 Midstream – Production/Manufacturing/Service Delivery
- 3.6.2.1 Production/Process Overview
- 3.6.2.2 Key Facility Locations & Capacity by Manufacturer
- 3.6.3 Downstream – Distribution & End Consumer
- 3.6.3.1 Primary Channel – B2B/OEM
- 3.6.3.2 Secondary Channels – Dealer, Retail, Online, Direct
- 3.6.4 Value Chain Profitability Analysis
- 3.6.1 Upstream – Raw Material/Input Suppliers
- 3.7 PESTEL Analysis
- 3.7.1 Political Factors
- 3.7.2 Economic Factors
- 3.7.3 Social Factors
- 3.7.4 Technological Factors
- 3.7.5 Environmental Factors
- 3.7.6 Legal Factors
- 3.8 Seven Segments Display Supply Chain Analysis
- 3.8.1 Raw Material/Input Supply Risk Assessment
- 3.8.2 Manufacturing Concentration Risk (Geographic Exposure)
- 3.8.3 Trade Disruption Impact Analysis
- 3.9 Regulatory & Policy Landscape
Note: The regulatory and policy landscape section covers regulations based on their applicability to the market, Seven Segments Display category, geography, and scope of the study. Only regulatory frameworks with a material impact on operations, compliance, trade, sustainability, or market access are analyzed in detail.
Chapter 4. Key Investment Pockets & Opportunity Analysis
- 4.1 Seven Segments Display Market Attractiveness Analysis
- 4.1.1 By Region – Investment Attractiveness Matrix (Volume × CAGR)
- 4.2 Absolute Revenue Growth Opportunity
- 4.2.1 By Region – Absolute USD Growth Through 2032
- 4.3 Incremental Volume Opportunity
- 4.3.1 By Region – Incremental Volume Through 2032
- 4.3.2 Segment – Incremental Volume
- 4.4 Emerging Submarket Opportunity Deep Dive (Subject to Applicability)
- 4.5 Emerging Market Opportunity Scorecards
- 4.5.1 United States
- 4.5.2 Europe
- 4.5.3 Asia
- 4.5.4 Middle East & Africa
Note: Emerging Market Opportunity Scorecards will be included based on relevance and strategic importance. Regions listed are indicative and may vary depending on data availability and market dynamics.
Chapter 5. Seven Segments Display Import-Export Analysis & Trade Flows
- 5.1 Global Trade Overview
- 5.1.1 Global Export Value by Country (2024)
- 5.1.2 Global Export Volume by Country (2024)
- 5.1.3 Global Import Value by Country (2024)
- 5.1.4 Global Import Volume by Country (2024)
- 5.1.5 Net Trade Balance by Country (2024)
- 5.2 Export Analysis – Segment
- 5.2.1 Type 1 (HS Code)
- 5.2.2 Type 2 (HS Code)
- 5.2.3 Type 3 (HS Code)
- 5.2.4 Type 4 (HS Code)
- 5.2.5 Type 5 (HS Code)
- 5.3 Import Analysis – Segment
- 5.3.1 Type 1 (HS Code)
- 5.3.2 Type 2 (HS Code)
- 5.3.3 Type 3 (HS Code)
- 5.3.4 Type 4 (HS Code)
- 5.3.5 Type 5 (HS Code)
- 5.4 Average Unit Trade Prices
- 5.4.1 Average Export Price – Segment & Country
- 5.4.2 Average Import Price – Segment & Source Country
- 5.4.3 Price Trends (2024)
- 5.5 Key Trade Route Analysis
- 5.5.1 Trade Route 1
- 5.5.2 Trade Route 2
- 5.5.3 Trade Route 3
- 5.5.4 Trade Route 4
- 5.5.5 Trade Route 5
- 5.6 Trade Policy Impact Assessment
- 5.6.1 US Anti-Dumping & Section 301 Tariffs
- 5.6.2 EU Customs Union Impact
- 5.6.3 Major Free Trade Agreements
- 5.6.4 USMCA Rules of Origin
Note: Trade policy analysis will be included only where relevant to the Seven Segments Display market.
Chapter 6. Competitive Landscape & Company Benchmarking
- 6.1 Seven Segments Display Market Concentration & Structure
- 6.1.1 Herfindahl-Hirschman Index (HHI) – vs. 2024
- 6.1.2 Tier 1, Tier 2 & Tier 3 Market Structure
- 6.1.3 Global, Regional & Local Player Dynamics
- 6.2 Seven Segments Display Market Share Analysis – 2024
- 6.2.1 Global Revenue Share by Company
- 6.2.2 Global Volume Share by Company
- 6.2.3 Regional Revenue Share
- 6.2.4 Market Share Evolution ( vs. 2024)
- 6.2.5 OEM Segment Share by Company
- 6.2.6 Replacement Segment Share by Company
- 6.3 Production/Delivery Capacity & Facility Analysis
- 6.3.1 Global Installed Capacity
- 6.3.2 Capacity Utilization Rates
- 6.3.3 Production/Output Volume
- 6.3.4 Facility Locations & Capacity Map
- 6.3.5 Planned Capacity Additions
- 6.4 Seven Segments Display Competitive Benchmarking Matrix
- 6.4.1 Revenue, Volume, CAGR & Profitability Comparison
- 6.4.2 Channel Revenue Mix
- 6.4.3 Geographic Revenue Exposure
- 6.4.4 R&D Intensity
- 6.4.5 Sustainability Maturity
- 6.5 Strategic Developments in Seven Segments Display (Last 24 Months)
- 6.5.1 Mergers, Acquisitions & Divestments
- 6.5.2 New Seven Segments Display Launches
- 6.5.3 Facility Expansions
- 6.5.4 Strategic Alliances, Joint Ventures & Partnerships
- 6.5.5 Distribution Expansion & Market Entry
- 6.5.6 Sustainability & ESG Initiatives
- 6.6 Competitive Strategy Mapping
- 6.6.1 Leader, Challenger, Follower & Niche Classification
- 6.6.2 Pricing Strategy Comparison
- 6.6.3 Channel Strategy Matrix
Note: Strategic developments are included based on their materiality and the availability of reliable information.
Chapter 7. Global Seven Segments Display Market – By Distribution Channel
- 7.1 Segment Overview
- 7.1.1 Volume & Revenue Split by Channel (2024 & 2032)
- 7.1.2 Channel Mix Evolution (2024-2032)
Chapter 8. Regional Market Analysis – Global Overview
- 8.1 Global Regional Overview
- 8.1.1 Regional Volume Share
- 8.1.2 Regional Revenue Share
- 8.1.3 Regional Volume by Region
- 8.1.4 Regional Revenue by Region
- 8.1.5 Regional Forecast Through 2032
- 8.2 Cross-Regional Segment Analysis
- 8.2.1 By Distribution Channel
- 8.2.2 By Brand/Price Tier
Chapter 9. North America Seven Segments Display Market
- 9.1 United States
- 9.2 Canada
- 9.3 Mexico
Chapter 10. Europe Seven Segments Display Market
- 10.1 Germany
- 10.2 France
- 10.3 Italy
- 10.4 United Kingdom
- 10.5 Spain
- 10.6 Poland
- 10.7 Russia
- 10.8 Netherlands
- 10.9 Belgium
- 10.10 Sweden
- 10.11 Denmark
- 10.12 Norway
- 10.13 Rest of Europe
Chapter 11. Asia Pacific Seven Segments Display Market
- 11.1 China
- 11.2 India
- 11.3 Japan
- 11.4 South Korea
- 11.5 Thailand
- 11.6 Indonesia
- 11.7 Vietnam
- 11.8 Malaysia
- 11.9 Australia
- 11.10 Rest of Asia Pacific
Chapter 12. Latin America Seven Segments Display Market
- 12.1 Brazil
- 12.2 Argentina
- 12.3 Colombia
- 12.4 Chile
- 12.5 Rest of Latin America
Chapter 13. Middle East Seven Segments Display Market
- 13.1 Saudi Arabia
- 13.2 United Arab Emirates
- 13.3 Turkey
- 13.4 Israel
- 13.5 Iran
- 13.6 Rest of the Middle East
Chapter 14. Africa Seven Segments Display Market
- 14.1 South Africa
- 14.2 Egypt
- 14.3 Nigeria
- 14.4 Morocco
- 14.5 Rest of Africa
Chapter 15. Seven Segments Display Company Profiles
- 15.1 [Company 01]
- 15.1.1 Company Overview
- 15.1.2 Key Management Personnel
- 15.1.3 Products & Services Portfolio
- 15.1.4 Financial Performance
- 15.1.5 Key Market Focus & Geographic Presence
- 15.1.6 Recent Developments & Strategic Initiatives
Note: The company profile list is preliminary and may change based on research findings, market developments, data availability, and client requirements.
Chapter 16. Appendices
- Appendix A – List of Abbreviations & Acronyms
- Appendix B – Industry Classification Code Reference – Full Series
- Appendix C – Production & Capacity Data Tables
- Appendix D – End-Use & Demand Base Tables
- Appendix E – Consumption & Replacement Rate Assumptions
- Appendix F – ASP Reference Tables
- Appendix G – Manufacturing & Facility Database
- Appendix H – Import-Export Data Tables
- Appendix I – Regulatory Summary Tables
- Appendix J – Primary Research Participant List (Anonymized)
- Appendix K – Primary Research Questionnaire Framework
- Appendix L – Data Sources & Bibliography
- Appendix M – Market Size Divergence & Source Comparison
Chapter 17. Research Methodology
- 17.1 Research Framework & Philosophy
- 17.2 Secondary Research – Sources, Hierarchy & Data Extraction
- 17.3 Data Modeling – Bottom-Up & Top-Down Market Sizing
- 17.4 Primary Research – Stakeholder Framework, LOI & Sample Sizes
- 17.5 Forecast Methodology – Regression, Scenario & Sensitivity Analysis
- 17.6 Quality Control – Four-Layer Validation Framework
- 17.7 Limitations & Standard Assumptions
- 17.8 Disclaimer
