
Market Overview
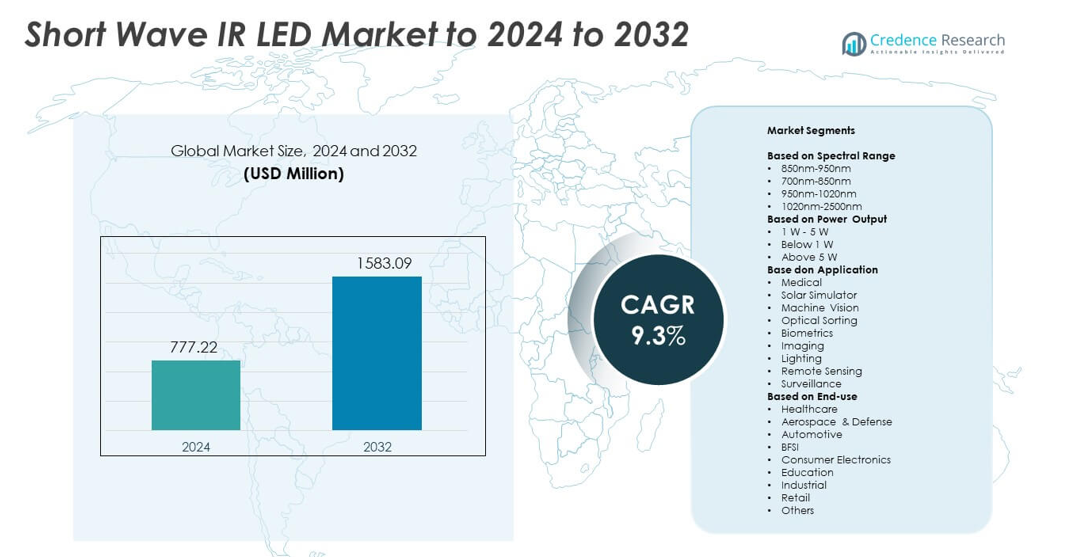
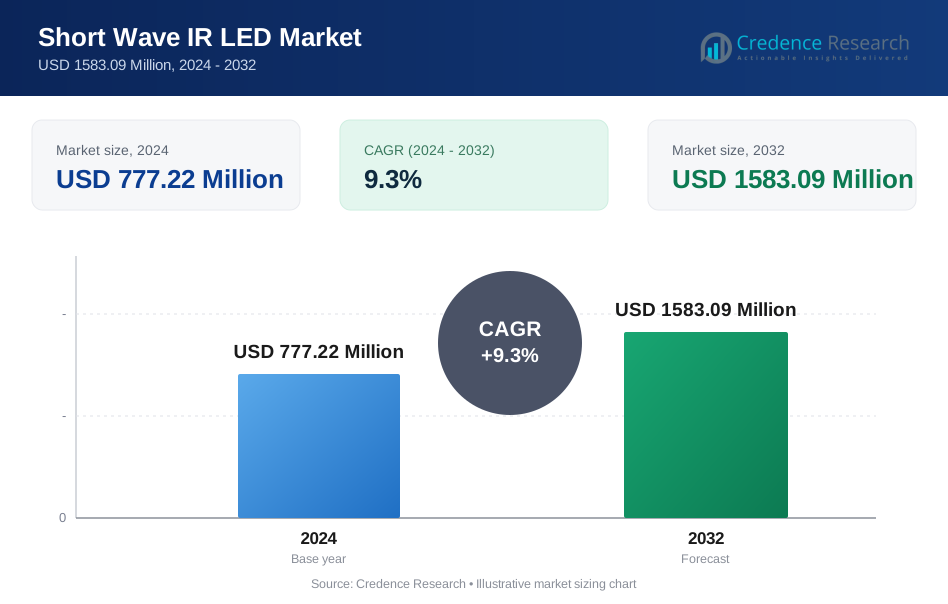
Short Wave IR LED Market size was valued at USD 777.22 Million in 2024 and is anticipated to reach USD 1583.09 Million by 2032, at a CAGR of 9.3% during the forecast period.
| REPORT ATTRIBUTE | DETAILS |
|---|---|
| Historical Period | 2020-2023 |
| Base Year | 2024 |
| Forecast Period | 2025-2032 |
| Short Wave IR LED Market Size 2024 | USD 777.22 Million |
| Short Wave IR LED Market, CAGR | 9.3% |
| Short Wave IR LED Market Size 2032 | USD 1583.09 Million |
The Short Wave IR LED Market features key players such as Lite-On Inc., ROHM Semiconductor, Everlight Electronics Co Ltd, Ushio OPTO Semiconductors Inc., Lumileds, EPILEDS, and DOWA Electronics Materials Co., Ltd., each expanding their portfolio through higher-efficiency diodes and advanced packaging technologies. These companies focus on machine vision, surveillance, medical diagnostics, and solar analysis, which drive most of the global demand. Asia Pacific remained the leading region with about 29% share in 2024, supported by strong semiconductor production and rapid industrial automation. North America followed closely with around 38% share due to high adoption in defense, imaging, and security applications.
Market Insights
- The Short Wave IR LED Market was valued at USD 777.22 Million in 2024 and is projected to reach USD 1583.09 Million by 2032, growing at a CAGR of 9.3%.
- Growth is driven by rising adoption in machine vision, surveillance, biometrics, and medical imaging, supported by increasing automation across industrial and security sectors.
- Trends include rapid integration of compact high-efficiency SWIR LEDs, rising use in solar inspection, and expanding opportunities in precision agriculture and analytical imaging.
- Competition intensifies as leading manufacturers enhance spectral efficiency, thermal performance, and sensor compatibility to support advanced imaging and inspection systems.
- North America led the market with 38% share, followed by Asia Pacific at 29%, while the 850–950 nm spectral range dominated with about 42% share due to strong use in machine vision and biometric applications.
Market Segmentation Analysis:
By Spectral Range
The 850nm–950nm spectral range led the Short Wave IR LED Market in 2024 with about 42% share. Strong adoption came from machine vision, biometric authentication, and surveillance systems that need high sensitivity and stable performance in low-light conditions. This range also supports compact device integration, which helped expand demand across access control and consumer electronics. Wider use in medical imaging and industrial quality checks strengthened growth. Rising investments in high-efficiency IR components across Asia supported steady expansion in this dominant band.
- For instance, ams OSRAM’s OSLON Black SFH 4718A operates with a peak wavelength of 860 nm, and according to its datasheet, it delivers a typical radiant flux (optical output) of 665 mW at a forward current of 1 A
By Power Output
The 1 W–5 W output category held the leading position in 2024 with nearly 48% share. Mid-power SWIR LEDs offered stronger illumination, longer range, and better thermal stability for machine vision, solar simulation, and precision inspection tasks. Manufacturers preferred this range due to balanced energy use and extended operating life. Growing adoption in industrial automation and outdoor surveillance pushed demand. Wider applications in medical diagnostics and smart sensing also supported this segment’s continued leadership.
- For instance, Ushio Opto Semiconductors specifies its InP SWIR LED series with an output power of 80 mW at 500 mA over the 1050–1650 nm range, highlighting high-power performance for SWIR applications.
By Application
Machine vision remained the dominant application in 2024 with about 34% share. Demand grew due to higher use of SWIR LEDs in semiconductor inspection, food sorting, and automated defect detection. These LEDs enabled clearer imaging through materials like plastics, silicon, and moisture-rich substances, which boosted accuracy in production lines. Surveillance and biometrics also expanded due to stronger authentication needs and low-light clarity. The growth of precision agriculture, solar assessment, and medical diagnostics further supported broad application adoption
Key Growth Drivers
Rising demand for machine vision integration
Machine vision adoption expanded across semiconductor inspection, food sorting, and precision manufacturing, which boosted the need for reliable SWIR LEDs. These LEDs helped detect material defects, moisture levels, and hidden layers that visible-light systems cannot capture. Better imaging through plastic, silicon, and fog strengthened their role in production lines. Wider uptake of smart factories and automated inspection systems pushed steady market growth and positioned machine vision as a core demand driver.
- For instance, Teledyne FLIR’s A6260 SWIR camera features a 640 × 512 InGaAs detector covering 0.9–1.7 µm and can record full-frame data at programmable rates up to 125 Hz, with burst operation reaching 180 Hz to support fast inspection workflows.
Growing use in surveillance and biometrics
Advanced surveillance systems relied on SWIR LEDs to capture clear images in low-light and harsh outdoor settings. Biometrics also gained momentum due to rising security requirements across public spaces, banking, and mobile devices. Stable illumination, strong penetration, and reduced scattering improved facial recognition accuracy. Governments and enterprises increased investment in secure access systems, which drove strong adoption. This shift in safety and identity verification standards supported continued SWIR LED growth.
- For instance, Sony’s IMX990 SenSWIR image sensor provides 1296 × 1032 active pixels (about 1.34 megapixels) with 5 µm pixel size and supports full-resolution frame rates up to 134 frames per second in 8-bit all-pixel readout mode for security and biometric imaging.
Expansion of medical and analytical imaging
SWIR LEDs gained wider use in medical diagnostics, tissue analysis, blood flow imaging, and pharmaceutical quality checks. Strong absorption and reflection characteristics enabled more precise imaging outcomes than traditional infrared sources. Healthcare systems adopted these LEDs to support safer, non-invasive analysis. Growing research in optical diagnostics and life sciences also accelerated technology development. These factors positioned medical imaging as a growing driver with steady long-term contribution.
Key Trends & Opportunities
Shift toward high-efficiency and compact SWIR LED designs
Manufacturers focused on improving power efficiency, heat management, and spectral stability to meet rising performance needs. Miniaturized packages supported integration in mobile devices, drones, and compact industrial sensors. Growing interest in low-energy illumination created opportunities for next-generation diode engineering. This trend also aligned with automation, smart security, and portable medical systems that need lighter and more durable SWIR components.
- For instance, Excelitas’ round-tube short-wave infrared emitter is specified with 500 W power, a heated length of 225 mm, filament temperatures between 1800 and 2400 °C, and a wavelength band from 1.0 to 1.4 µm, demonstrating compact high-intensity IR source engineering.
Rising adoption in renewable energy and agricultural sensing
SWIR LEDs gained traction in solar simulators, panel inspection tools, and crop analysis systems. Their ability to assess moisture, chemical composition, and material defects opened opportunities in precision agriculture. Renewable energy projects used SWIR imaging to validate photovoltaic efficiency. Government support for clean energy and modern farming increased deployment prospects. These emerging fields created strong growth paths beyond core industrial use.
- For instance, New Imaging Technologies’ SWIR sensor announced in April 2024 offers 1920 × 1080 resolution with 8 µm pixel pitch
Key Challenges
High production costs and material limitations
The complex manufacturing process for SWIR LEDs, especially those in higher wavelength ranges, increased production cost and limited widespread adoption in cost-sensitive sectors. Material constraints linked to indium gallium arsenide and related compounds restricted scalability. These limitations slowed penetration into consumer electronics and budget-focused industrial systems.
Thermal management and lifetime performance issues
SWIR LEDs produced higher heat levels, which created long-term reliability and operational stability concerns. Inefficient thermal control reduced emission consistency and shortened device lifespan. These challenges affected deployment in continuous-use applications such as surveillance, industrial inspection, and medical systems. Improving heat dissipation and durability remained essential for broader adoption.
Regional Analysis
North America
North America held about 38% share in 2024, driven by strong adoption of SWIR LEDs in defense, surveillance, semiconductor testing, and advanced medical imaging. Companies expanded sensor integration across security infrastructure and industrial automation, which supported higher demand. Growth in biometric authentication for border control and access systems further strengthened the market. The region benefited from strong research activity in imaging technologies and increasing deployment of AI-enabled inspection systems. Rising investment in renewable energy monitoring and agricultural sensing also opened new opportunities across the United States and Canada.
Europe
Europe accounted for nearly 27% share in 2024, supported by strong adoption in industrial automation, machine vision, and renewable energy assessment. Manufacturing hubs in Germany, the United Kingdom, and France increased use of SWIR LEDs for precision inspection and process monitoring. Growth in medical imaging research and pharmaceutical quality checks enhanced regional demand. Surveillance upgrades across transportation and public infrastructure also added momentum. The region benefited from sustainability-driven investments that created opportunities in solar inspection and environmental sensing across major European economies.
Asia Pacific
Asia Pacific led global production growth and captured about 29% share in 2024. Expanding semiconductor manufacturing in China, South Korea, Taiwan, and Japan drove strong demand for SWIR LEDs used in wafer inspection and electronics testing. Industrial automation accelerated adoption in machine vision and quality control. Surveillance deployments increased across urban areas due to smart city initiatives. Medical device expansion and agricultural imaging further strengthened the market. The region also benefited from rapid investments in renewable energy and solar assessments.
Latin America
Latin America held nearly 4% share in 2024, driven by growing adoption of SWIR LEDs in food processing, agricultural monitoring, and security applications. Brazil and Mexico expanded use of machine vision for quality inspection across manufacturing and packaging sectors. Renewable energy projects, including solar farm development, supported demand for SWIR-based assessment tools. Slow industrial modernization limited broader penetration, but rising interest in biometric systems and remote sensing created emerging opportunities. Medical imaging adoption grew modestly with expanding healthcare investments.
Middle East & Africa
Middle East & Africa accounted for around 2% share in 2024, supported by rising deployment of SWIR LEDs in surveillance, border security, and infrastructure monitoring. Investments in smart city development in the Gulf region improved demand for imaging and sensing systems. Solar energy projects across the UAE, Saudi Arabia, and South Africa created opportunities for panel inspection and simulator applications. Industrial adoption remained limited but growing, with machine vision expanding in logistics and materials processing. Healthcare modernization also contributed to gradual uptake across select markets.
Market Segmentations:
By Spectral Range
- 850nm-950nm
- 700nm-850nm
- 950nm-1020nm
- 1020nm-2500nm
By Power Output
- 1 W - 5 W
- Below 1 W
- Above 5 W
By Application
- Medical
- Solar Simulator
- Machine Vision
- Optical Sorting
- Biometrics
- Imaging
- Lighting
- Remote Sensing
- Surveillance
By End-use
- Healthcare
- Aerospace & Defense
- Automotive
- BFSI
- Consumer Electronics
- Education
- Industrial
- Retail
- Others
By Geography
- North America
- U.S.
- Canada
- Mexico
- Europe
- Germany
- France
- U.K.
- Italy
- Spain
- Rest of Europe
- Asia Pacific
- China
- Japan
- India
- South Korea
- South-east Asia
- Rest of Asia Pacific
- Latin America
- Brazil
- Argentina
- Rest of Latin America
- Middle East & Africa
- GCC Countries
- South Africa
- Rest of the Middle East and Africa
Competitive Landscape
The competitive landscape of the Short Wave IR LED Market is shaped by leading companies such as Lite-On Inc., ROHM Semiconductor, Everlight Electronics Co Ltd, Ushio OPTO Semiconductors Inc., Lumileds, EPILEDS, and DOWA Electronics Materials Co., Ltd. These manufacturers focus on enhancing spectral efficiency, power stability, and long-range illumination to meet rising demand across machine vision, surveillance, medical imaging, and solar analysis. Many players invest heavily in advanced semiconductor materials and wafer-level packaging to improve heat management and extend device lifespan. Partnerships with automation, security, and healthcare solution providers continue to expand market reach. Growing emphasis on compact diode design and integration into multi-sensor systems strengthens competitive positioning. Firms also accelerate R&D to support emerging uses in precision agriculture, renewable energy inspection, and high-speed industrial sorting. Increasing production capacity in Asia and expanding distribution networks worldwide further intensify competition across the market.
Key Player Analysis
- Lite-On Inc.
- ROHM Semiconductor
- Everlight Electronics Co Ltd
- Ushio OPTO Semiconductors Inc.
- Lumileds
- EPILEDS
- DOWA Electronics Materials Co., Ltd.
Recent Developments
- In 2025, TriEye and Lite-On announced a partnership to industrialize cost-effective SWIR sensing and imaging solutions, combining TriEye’s CMOS-based SWIR sensors with Lite-On’s optoelectronic packaging to target automotive, mobile, and consumer applications.
- In 2024, Ushio began mass production of its 1100GD 1100 nm SWIR LEDs, delivering roughly double the light output of earlier products for wafer inspection, solar cells, and sorting applications.
- In 2024, DOWA announced a new SWIR LED chip series with world-leading efficiency across 1200–1900 nm, targeting machine vision, food analysis, and medical diagnostics.
Report Coverage
The research report offers an in-depth analysis based on Spectral Range, Power Output Application, End-Use and Geography. It details leading market players, providing an overview of their business, product offerings, investments, revenue streams, and key applications. Additionally, the report includes insights into the competitive environment, SWOT analysis, current market trends, as well as the primary drivers and constraints. Furthermore, it discusses various factors that have driven market expansion in recent years. The report also explores market dynamics, regulatory scenarios, and technological advancements that are shaping the industry. It assesses the impact of external factors and global economic changes on market growth. Lastly, it provides strategic recommendations for new entrants and established companies to navigate the complexities of the market.
Future Outlook
- The market will expand as machine vision demand grows across automated industries.
- Surveillance and biometric adoption will increase SWIR LED integration in security systems.
- Medical imaging applications will grow due to rising use of non-invasive diagnostic tools.
- Renewable energy projects will boost demand for SWIR LEDs in solar inspection.
- Compact and high-efficiency diode designs will support broader device integration.
- Agricultural sensing will gain traction as precision farming becomes more widespread.
- Advancements in thermal management will improve device durability and stability.
- Rising use in consumer electronics may emerge as production costs decline.
- Government investments in smart infrastructure will strengthen regional adoption.
- Material innovation will enhance wavelength performance and expand application scope.
Request a Free Sample
Fill in your details and we'll send you a free sample report.
- Sample data tables & charts
- Research methodology
Need a Custom Version of This Report?
Tailor the scope, geography, or segments to your exact requirements.
- Custom geography or segment scope
- Direct access to our analyst team
Frequently Asked Questions
What is the current market size for Short Wave IR LED Market, and what is its projected size in 2032?
At what Compound Annual Growth Rate is the Short Wave IR LED Market projected to grow between 2024 and 2032?
Which Short Wave IR LED Market segment held the largest share in 2024?
What are the primary factors fueling the growth of the Short Wave IR LED Market?
Who are the leading companies in the Short Wave IR LED Market?
Table of Content
Chapter 1. Report Introduction
- 1.1 Report Description & Purpose
- 1.1.1 Report Title & Market Definition
- 1.1.2 Unique Selling Propositions (USP) & Key Differentiators
- 1.1.3 Value Proposition for Stakeholders
- 1.2 Research Objectives
- 1.2.1 Market Sizing Objectives (Volume & Revenue)
- 1.2.2 Segmentation Objectives
- 1.2.3 Competitive Intelligence Objectives
- 1.2.4 Forecast & Scenario Objectives
- 1.3 Report Scope
- 1.3.1 Short Wave IR LED Scope – Types & Subtypes Covered
- 1.3.2 Geographic Scope – Regions & Countries Covered
- 1.3.3 Historical Period, Base Year & Forecast Period (2024; forecast to 2032)
- 1.3.4 Inclusions & Exclusions
- 1.4 HS Code & Classification Framework
- 1.5 Currency, Units & Pricing Basis
- 1.6 Target Stakeholders
- 1.7 Limitations & Assumptions
Chapter 2. Executive Summary
- 2.1 Global Short Wave IR LED Market Snapshot
- 2.1.1 Market Size – Historical (2024) & Forecast (2024-2032) (2024: USD 777.22 Million → 2032: USD 1583.09 Million)
- 2.1.2 Volume & Revenue – Global Totals
- 2.1.3 Key Market Highlights – Top Five Facts
- 2.2 Short Wave IR LED Market Segmentation Snapshot
- 2.2.1 Market Split by Region – 2024 vs. 2032
- 2.3 Competitive Snapshot
- 2.3.1 Top 10 Players by Revenue Share – 2024
- 2.3.2 Top 10 Players by Volume Share – 2024
- 2.3.3 Recent Strategic Developments (18-Month Summary)
- 2.4 Key Investment Highlights & Strategic Conclusions
Chapter 3. Short Wave IR LED Market Dynamics & Industry Analysis
- 3.1 Market Overview & Context
- 3.1.1 Short Wave IR LED Market Position in the Broader Automotive Value Chain
- 3.1.2 OEM vs. Replacement Market Dynamics
- 3.1.3 Market Maturity & Development Stage by Region
- 3.2 Short Wave IR LED Market Drivers
- 3.3 Short Wave IR LED Market Restraints & Challenges
- 3.4 Short Wave IR LED Market Opportunities
- 3.5 Porter's Five Forces Analysis
- 3.5.1 Threat of New Entrants
- 3.5.2 Bargaining Power of Suppliers
- 3.5.3 Bargaining Power of Buyers
- 3.5.4 Threat of Substitutes
- 3.5.5 Competitive Rivalry – Intensity Assessment
- 3.6 Short Wave IR LED Value Chain Analysis
- 3.6.1 Upstream – Raw Material/Input Suppliers
- 3.6.1.1 Raw Material/Input 1
- 3.6.1.2 Raw Material/Input 2
- 3.6.1.3 Raw Material/Input 3
- 3.6.2 Midstream – Production/Manufacturing/Service Delivery
- 3.6.2.1 Production/Process Overview
- 3.6.2.2 Key Facility Locations & Capacity by Manufacturer
- 3.6.3 Downstream – Distribution & End Consumer
- 3.6.3.1 Primary Channel – B2B/OEM
- 3.6.3.2 Secondary Channels – Dealer, Retail, Online, Direct
- 3.6.4 Value Chain Profitability Analysis
- 3.6.1 Upstream – Raw Material/Input Suppliers
- 3.7 PESTEL Analysis
- 3.7.1 Political Factors
- 3.7.2 Economic Factors
- 3.7.3 Social Factors
- 3.7.4 Technological Factors
- 3.7.5 Environmental Factors
- 3.7.6 Legal Factors
- 3.8 Short Wave IR LED Supply Chain Analysis
- 3.8.1 Raw Material/Input Supply Risk Assessment
- 3.8.2 Manufacturing Concentration Risk (Geographic Exposure)
- 3.8.3 Trade Disruption Impact Analysis
- 3.9 Regulatory & Policy Landscape
Note: The regulatory and policy landscape section covers regulations based on their applicability to the market, Short Wave IR LED category, geography, and scope of the study. Only regulatory frameworks with a material impact on operations, compliance, trade, sustainability, or market access are analyzed in detail.
Chapter 4. Key Investment Pockets & Opportunity Analysis
- 4.1 Short Wave IR LED Market Attractiveness Analysis
- 4.1.1 By Region – Investment Attractiveness Matrix (Volume × CAGR)
- 4.2 Absolute Revenue Growth Opportunity
- 4.2.1 By Region – Absolute USD Growth Through 2032
- 4.3 Incremental Volume Opportunity
- 4.3.1 By Region – Incremental Volume Through 2032
- 4.3.2 Segment – Incremental Volume
- 4.4 Emerging Submarket Opportunity Deep Dive (Subject to Applicability)
- 4.5 Emerging Market Opportunity Scorecards
- 4.5.1 United States
- 4.5.2 Europe
- 4.5.3 Asia
- 4.5.4 Middle East & Africa
Note: Emerging Market Opportunity Scorecards will be included based on relevance and strategic importance. Regions listed are indicative and may vary depending on data availability and market dynamics.
Chapter 5. Short Wave IR LED Import-Export Analysis & Trade Flows
- 5.1 Global Trade Overview
- 5.1.1 Global Export Value by Country (2024)
- 5.1.2 Global Export Volume by Country (2024)
- 5.1.3 Global Import Value by Country (2024)
- 5.1.4 Global Import Volume by Country (2024)
- 5.1.5 Net Trade Balance by Country (2024)
- 5.2 Export Analysis – Segment
- 5.2.1 Type 1 (HS Code)
- 5.2.2 Type 2 (HS Code)
- 5.2.3 Type 3 (HS Code)
- 5.2.4 Type 4 (HS Code)
- 5.2.5 Type 5 (HS Code)
- 5.3 Import Analysis – Segment
- 5.3.1 Type 1 (HS Code)
- 5.3.2 Type 2 (HS Code)
- 5.3.3 Type 3 (HS Code)
- 5.3.4 Type 4 (HS Code)
- 5.3.5 Type 5 (HS Code)
- 5.4 Average Unit Trade Prices
- 5.4.1 Average Export Price – Segment & Country
- 5.4.2 Average Import Price – Segment & Source Country
- 5.4.3 Price Trends (2024)
- 5.5 Key Trade Route Analysis
- 5.5.1 Trade Route 1
- 5.5.2 Trade Route 2
- 5.5.3 Trade Route 3
- 5.5.4 Trade Route 4
- 5.5.5 Trade Route 5
- 5.6 Trade Policy Impact Assessment
- 5.6.1 US Anti-Dumping & Section 301 Tariffs
- 5.6.2 EU Customs Union Impact
- 5.6.3 Major Free Trade Agreements
- 5.6.4 USMCA Rules of Origin
Note: Trade policy analysis will be included only where relevant to the Short Wave IR LED market.
Chapter 6. Competitive Landscape & Company Benchmarking
- 6.1 Short Wave IR LED Market Concentration & Structure
- 6.1.1 Herfindahl-Hirschman Index (HHI) – vs. 2024
- 6.1.2 Tier 1, Tier 2 & Tier 3 Market Structure
- 6.1.3 Global, Regional & Local Player Dynamics
- 6.2 Short Wave IR LED Market Share Analysis – 2024
- 6.2.1 Global Revenue Share by Company
- 6.2.2 Global Volume Share by Company
- 6.2.3 Regional Revenue Share
- 6.2.4 Market Share Evolution ( vs. 2024)
- 6.2.5 OEM Segment Share by Company
- 6.2.6 Replacement Segment Share by Company
- 6.3 Production/Delivery Capacity & Facility Analysis
- 6.3.1 Global Installed Capacity
- 6.3.2 Capacity Utilization Rates
- 6.3.3 Production/Output Volume
- 6.3.4 Facility Locations & Capacity Map
- 6.3.5 Planned Capacity Additions
- 6.4 Short Wave IR LED Competitive Benchmarking Matrix
- 6.4.1 Revenue, Volume, CAGR & Profitability Comparison
- 6.4.2 Channel Revenue Mix
- 6.4.3 Geographic Revenue Exposure
- 6.4.4 R&D Intensity
- 6.4.5 Sustainability Maturity
- 6.5 Strategic Developments in Short Wave IR LED (Last 24 Months)
- 6.5.1 Mergers, Acquisitions & Divestments
- 6.5.2 New Short Wave IR LED Launches
- 6.5.3 Facility Expansions
- 6.5.4 Strategic Alliances, Joint Ventures & Partnerships
- 6.5.5 Distribution Expansion & Market Entry
- 6.5.6 Sustainability & ESG Initiatives
- 6.6 Competitive Strategy Mapping
- 6.6.1 Leader, Challenger, Follower & Niche Classification
- 6.6.2 Pricing Strategy Comparison
- 6.6.3 Channel Strategy Matrix
Note: Strategic developments are included based on their materiality and the availability of reliable information.
Chapter 7. Global Short Wave IR LED Market – By Distribution Channel
- 7.1 Segment Overview
- 7.1.1 Volume & Revenue Split by Channel (2024 & 2032)
- 7.1.2 Channel Mix Evolution (2024-2032)
Chapter 8. Regional Market Analysis – Global Overview
- 8.1 Global Regional Overview
- 8.1.1 Regional Volume Share
- 8.1.2 Regional Revenue Share
- 8.1.3 Regional Volume by Region
- 8.1.4 Regional Revenue by Region
- 8.1.5 Regional Forecast Through 2032
- 8.2 Cross-Regional Segment Analysis
- 8.2.1 By Distribution Channel
- 8.2.2 By Brand/Price Tier
Chapter 9. North America Short Wave IR LED Market
- 9.1 United States
- 9.2 Canada
- 9.3 Mexico
Chapter 10. Europe Short Wave IR LED Market
- 10.1 Germany
- 10.2 France
- 10.3 Italy
- 10.4 United Kingdom
- 10.5 Spain
- 10.6 Poland
- 10.7 Russia
- 10.8 Netherlands
- 10.9 Belgium
- 10.10 Sweden
- 10.11 Denmark
- 10.12 Norway
- 10.13 Rest of Europe
Chapter 11. Asia Pacific Short Wave IR LED Market
- 11.1 China
- 11.2 India
- 11.3 Japan
- 11.4 South Korea
- 11.5 Thailand
- 11.6 Indonesia
- 11.7 Vietnam
- 11.8 Malaysia
- 11.9 Australia
- 11.10 Rest of Asia Pacific
Chapter 12. Latin America Short Wave IR LED Market
- 12.1 Brazil
- 12.2 Argentina
- 12.3 Colombia
- 12.4 Chile
- 12.5 Rest of Latin America
Chapter 13. Middle East Short Wave IR LED Market
- 13.1 Saudi Arabia
- 13.2 United Arab Emirates
- 13.3 Turkey
- 13.4 Israel
- 13.5 Iran
- 13.6 Rest of the Middle East
Chapter 14. Africa Short Wave IR LED Market
- 14.1 South Africa
- 14.2 Egypt
- 14.3 Nigeria
- 14.4 Morocco
- 14.5 Rest of Africa
Chapter 15. Short Wave IR LED Company Profiles
- 15.1 [Company 01]
- 15.1.1 Company Overview
- 15.1.2 Key Management Personnel
- 15.1.3 Products & Services Portfolio
- 15.1.4 Financial Performance
- 15.1.5 Key Market Focus & Geographic Presence
- 15.1.6 Recent Developments & Strategic Initiatives
Note: The company profile list is preliminary and may change based on research findings, market developments, data availability, and client requirements.
Chapter 16. Appendices
- Appendix A – List of Abbreviations & Acronyms
- Appendix B – Industry Classification Code Reference – Full Series
- Appendix C – Production & Capacity Data Tables
- Appendix D – End-Use & Demand Base Tables
- Appendix E – Consumption & Replacement Rate Assumptions
- Appendix F – ASP Reference Tables
- Appendix G – Manufacturing & Facility Database
- Appendix H – Import-Export Data Tables
- Appendix I – Regulatory Summary Tables
- Appendix J – Primary Research Participant List (Anonymized)
- Appendix K – Primary Research Questionnaire Framework
- Appendix L – Data Sources & Bibliography
- Appendix M – Market Size Divergence & Source Comparison
Chapter 17. Research Methodology
- 17.1 Research Framework & Philosophy
- 17.2 Secondary Research – Sources, Hierarchy & Data Extraction
- 17.3 Data Modeling – Bottom-Up & Top-Down Market Sizing
- 17.4 Primary Research – Stakeholder Framework, LOI & Sample Sizes
- 17.5 Forecast Methodology – Regression, Scenario & Sensitivity Analysis
- 17.6 Quality Control – Four-Layer Validation Framework
- 17.7 Limitations & Standard Assumptions
- 17.8 Disclaimer
