
Market Overview:
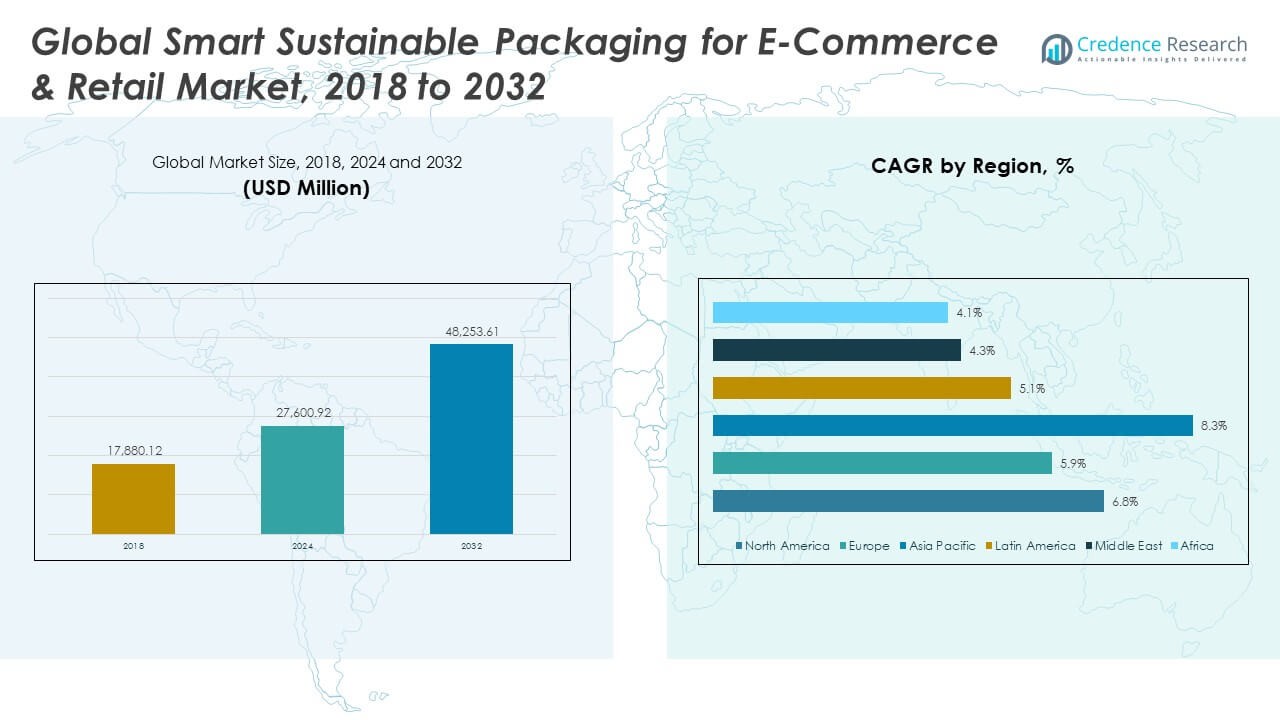
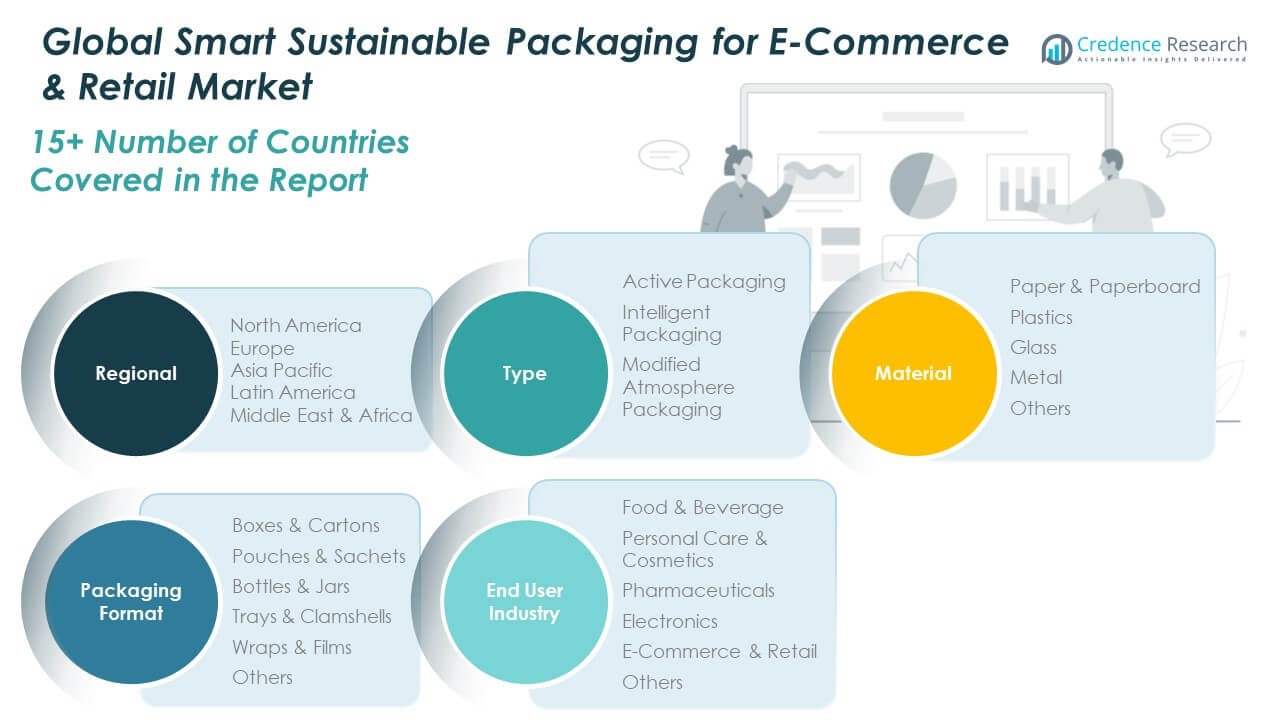
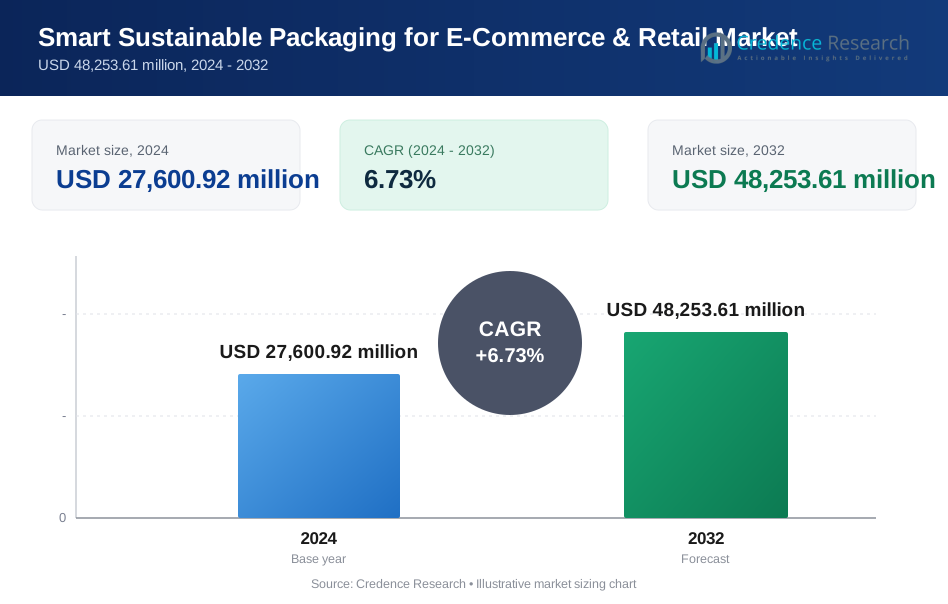
The Global Smart Sustainable Packaging for E-Commerce & Retail Market size was valued at USD 17,880.12 million in 2018 to USD 27,600.92 million in 2024 and is anticipated to reach USD 48,253.61 million by 2032, at a CAGR of 6.73% during the forecast period.
| REPORT ATTRIBUTE | DETAILS |
|---|---|
| Historical Period | 2020-2023 |
| Base Year | 2024 |
| Forecast Period | 2025-2032 |
| Smart Sustainable Packaging for E-Commerce & Retail Market Size 2024 | USD 27,600.92 Million |
| Smart Sustainable Packaging for E-Commerce & Retail Market, CAGR | 6.73% |
| Smart Sustainable Packaging for E-Commerce & Retail Market Size 2032 | USD 48,253.61 Million |
The market is growing steadily due to the rising need for eco-efficient packaging that supports online retail logistics. Brands focus on reducing waste through recyclable and biodegradable materials while enhancing traceability through digital tools like RFID and QR codes. The shift toward sustainable e-commerce fulfillment drives innovation in packaging design, automation, and smart labeling. It benefits from increasing consumer awareness, global sustainability mandates, and rapid adoption of intelligent packaging that ensures both performance and environmental responsibility.
North America leads the market due to advanced e-commerce infrastructure and strong adoption of smart technologies. Europe follows closely with strict environmental regulations and circular economy goals promoting sustainable practices. Asia Pacific emerges as the fastest-growing region, supported by industrial expansion, online retail growth, and government incentives for green packaging. Latin America, the Middle East, and Africa show gradual adoption, driven by improving logistics systems and rising consumer demand for eco-friendly products.
Market Insights:
- The Global Smart Sustainable Packaging for E-Commerce & Retail Market was valued at USD 17,880.12 million in 2018, USD 27,600.92 million in 2024, and is projected to reach USD 48,253.61 million by 2032, growing at a CAGR of 6.73%.
- North America leads with 43.2% share, driven by advanced logistics, strong e-commerce presence, and early technology adoption. Europe holds 25.5% due to strict sustainability laws, while Asia Pacific accounts for 22.2%, supported by large-scale online retail and manufacturing capacity.
- Asia Pacific remains the fastest-growing region with 8.3% CAGR, propelled by rising consumer demand for eco-friendly solutions and regional government initiatives promoting sustainable packaging.
- Intelligent packaging contributes approximately 45% of the total market share, supported by its applications in traceability, freshness monitoring, and customer engagement.
- Active and modified atmosphere packaging collectively account for around 55%, ensuring product safety, extending shelf life, and enhancing e-commerce delivery efficiency.
Market Drivers
Rising Focus on Eco-Efficiency and Circular Economy Integration
The Global Smart Sustainable Packaging for E-Commerce & Retail Market grows with rising adoption of recyclable and compostable materials. Brands redesign packaging to reduce waste and support circular economy models. It benefits from global sustainability mandates that limit plastic use and promote material recovery. Retailers prefer lightweight, reusable, and biodegradable packaging that lowers logistics costs. E-commerce platforms push suppliers to meet green standards to enhance brand image. Governments support waste management frameworks that encourage sustainable innovation. The growing environmental awareness among consumers reinforces the market’s direction. It accelerates development of smart packaging integrating sensors and eco-friendly polymers.
- For instance, Patagonia has committed to ensuring all its packaging is reusable, home compostable, renewable, or easily recyclable by 2025. The company publicly reports steady progress toward this target as part of its broader strategy to minimize environmental impact and reduce waste across its supply chain.
Expansion of E-Commerce Platforms and Growing Demand for Smart Logistics Solutions
Rapid e-commerce growth drives innovation in packaging for secure, traceable delivery. Retailers adopt connected packaging that tracks products through QR codes or RFID tags. The Global Smart Sustainable Packaging for E-Commerce & Retail Market benefits from automation that improves warehouse efficiency. It enables safe handling and monitoring of shipments, reducing damage and returns. Increased focus on consumer experience fuels investments in design and functional smart features. E-commerce platforms demand flexible packaging to fit varied product categories. Companies integrate digital identifiers to support inventory transparency. This transformation strengthens cross-border trade and builds trust in product authenticity.
Shift Toward Consumer-Centric and Experience-Driven Packaging Innovations
Personalized packaging gains attention as customers expect engaging unboxing experiences. It integrates digital touchpoints like NFC chips and augmented reality features. The Global Smart Sustainable Packaging for E-Commerce & Retail Market leverages this to enhance customer loyalty. It enables real-time communication and feedback loops between brands and consumers. Smart labels deliver information on product origin, sustainability score, and usage guidance. Retailers use interactive designs to reinforce brand identity and sustainability efforts. The shift supports premiumization trends, especially in cosmetics, fashion, and electronics. Brands adopt custom-fit, smart-packaging solutions to elevate customer engagement and satisfaction.
Government Regulations Promoting Green Packaging Standards and Compliance
Governments enforce strict packaging waste reduction laws to push sustainable adoption. Policies in the EU, North America, and Asia encourage manufacturers to adopt eco-labels and traceable materials. The Global Smart Sustainable Packaging for E-Commerce & Retail Market aligns with Extended Producer Responsibility (EPR) frameworks. It benefits companies complying with life-cycle analysis and recycling certifications. Regulatory pressure compels packaging producers to redesign supply chains toward lower emissions. Public procurement standards reward compliance with environmental targets. Global trade standards integrate sustainability benchmarks in packaging requirements. These initiatives foster rapid adoption of smart sustainable technologies in retail packaging.
- For instance, DuPont’s Tyvek packaging uses a renewable attribution model that cuts its carbon footprint by nearly one-third compared to standard Tyvek. Its production facilities in Virginia and Luxembourg are ISCC PLUS certified, reinforcing DuPont’s commitment to responsible and sustainable material innovation.
Market Trends
Integration of IoT and Digital Technologies for Smarter Supply Chains
The Global Smart Sustainable Packaging for E-Commerce & Retail Market witnesses growing use of IoT and blockchain for data-driven transparency. Brands employ smart sensors to monitor temperature, humidity, and handling conditions. It helps track goods across long supply chains and prevents counterfeiting. Real-time data enhances operational control and enables predictive analytics in logistics. Retailers invest in intelligent labeling for automated scanning and returns management. Tech-driven packaging helps optimize warehouse storage and reduce waste. Connectivity features improve product traceability from factory to consumer. This trend strengthens accountability and supply chain resilience.
Adoption of Renewable and Bio-Based Materials in Mass Production
Manufacturers transition from petroleum-based polymers to bio-based alternatives. Companies invest in renewable materials like polylactic acid and paper composites. The Global Smart Sustainable Packaging for E-Commerce & Retail Market grows as material innovations reduce carbon emissions. It drives adoption of plant-based inks and adhesives that simplify recycling. Packaging producers introduce hybrid materials with improved mechanical strength and biodegradability. The transition aligns with corporate sustainability goals and global carbon-neutral pledges. Brands integrate bio-based solutions to comply with eco-label standards. This movement supports circular economy models while meeting consumer expectations for sustainability.
- For instance, Tetra Pak reported selling 10.4 billion plant-based packaging products globally in 2023, along with 12.6 billion biobased caps. The company stated that plant-based plastics made up more than 8% of its total carton sales in the U.S. and Canada and invests about €100 million annually in R&D for sustainable packaging solutions.
Rise of Minimalist Packaging and Smart Design Optimization
The design philosophy shifts toward simplicity to minimize resource use. Brands focus on reducing excess layers and standardizing material dimensions. The Global Smart Sustainable Packaging for E-Commerce & Retail Market sees growth in foldable and modular structures. It supports ease of recycling and efficient shipping logistics. Designers prioritize functional aesthetics that communicate environmental responsibility. Automation aids in precision cutting and material optimization. Reduced printing and ink use further enhance sustainability. These smart design innovations lower operational costs and environmental footprints.
Technological Advancements in Active and Intelligent Packaging Systems
Packaging evolves beyond containment into intelligent systems with real-time functionality. The Global Smart Sustainable Packaging for E-Commerce & Retail Market benefits from sensors detecting freshness, tampering, and environmental changes. It integrates time-temperature indicators and oxygen sensors to protect product quality. Retailers use smart barcodes and NFC tags for authentication. Cloud-based data collection improves analytics for consumer behavior insights. Machine learning models predict packaging failures and optimize performance. This continuous innovation merges sustainability with advanced digital capabilities. It enhances product integrity and customer trust across e-commerce platforms.
- For instance, Avery Dennison has deployed RFID and NFC-enabled smart labels that enhance product authentication accuracy and enable real-time inventory visibility. These digital packaging solutions connect to cloud-based analytics, supporting improved supply chain transparency and sustainability performance across retail operations.
Market Challenges Analysis
High Implementation Costs and Complexity in Supply Chain Integration
The Global Smart Sustainable Packaging for E-Commerce & Retail Market faces high production costs due to advanced materials and digital components. It requires heavy investment in R&D and supply chain restructuring. Many small retailers struggle to afford connected packaging systems. Integration of sensors, RFID, and digital codes demands specialized infrastructure. Cost constraints limit adoption in price-sensitive regions. Supply chain interoperability remains a hurdle for cross-border trade. The lack of standardized protocols complicates scaling of smart packaging solutions. These challenges delay mass commercialization despite growing consumer interest.
Material Recycling Limitations and Inconsistent Regulatory Standards
The market experiences recycling inefficiencies because of complex multi-layer materials. Smart features like embedded electronics add difficulty to waste processing. The Global Smart Sustainable Packaging for E-Commerce & Retail Market struggles to achieve uniform recycling rates. It faces fragmented regulatory frameworks across countries that confuse compliance efforts. Certification processes remain lengthy, delaying product launches. Many developing markets lack infrastructure for sustainable waste management. The absence of unified labeling systems hinders consumer understanding of disposal methods. These barriers slow the transition toward a fully circular packaging ecosystem.
Market Opportunities
Expansion of AI-Enabled Smart Packaging for Personalization and Waste Reduction
The Global Smart Sustainable Packaging for E-Commerce & Retail Market benefits from AI integration that improves design precision. It supports predictive material planning and reduces waste across manufacturing stages. AI tools personalize user experiences by analyzing consumer data and packaging interactions. It enables brands to design adaptive packaging optimized for shipping conditions. Advanced analytics refine packaging durability and reduce material costs. AI-driven labeling promotes intelligent recycling through digital identification. The expansion of machine learning applications enhances packaging responsiveness to sustainability metrics.
Emerging Markets Creating Growth Potential Through Digital and Green Transitions
Emerging economies in Asia-Pacific, Latin America, and Africa provide major expansion potential. The Global Smart Sustainable Packaging for E-Commerce & Retail Market gains traction with rising e-commerce penetration. It benefits from government incentives for local green manufacturing. Retail infrastructure modernization supports wider adoption of smart packaging. Rising consumer awareness increases willingness to pay for eco-friendly packaging. Collaborations between global and local brands accelerate market entry. Sustainable technology investments in these regions open new avenues for innovation and scalability.
Market Segmentation Analysis:
By Type
The Global Smart Sustainable Packaging for E-Commerce & Retail Market includes active, intelligent, and modified atmosphere packaging. Intelligent packaging dominates due to its ability to monitor freshness, enable traceability, and enhance consumer interaction through digital tools. Active packaging supports longer shelf life by controlling internal conditions such as moisture and oxygen. Modified atmosphere packaging finds steady use in food and pharmaceutical logistics where product stability is critical. It benefits from ongoing R&D aimed at integrating sensors and biodegradable materials to balance functionality with sustainability.
- For instance, Sealed Air launched its prismiq™ digital packaging brand, featuring cloud-based platforms that assign unique digital IDs to packaging for QR, RFID, and barcode integration. This technology enhances traceability, recycling visibility, and consumer engagement while supporting the company’s broader digital packaging transformation strategy.
By Material
The market by material includes paper and paperboard, plastics, glass, metal, and others. Paper and paperboard lead due to recyclability and alignment with eco-friendly policies. Plastics remain important for flexibility, durability, and lightweight performance across shipping operations. Glass and metal cater to premium and reusable packaging solutions where product integrity matters. Other materials, including bio-based polymers, gain adoption as manufacturers pursue carbon reduction goals. It advances through innovation in composite and biodegradable alternatives that meet both strength and environmental requirements.
By Packaging Format
The market segmentation by packaging format includes boxes and cartons, pouches and sachets, bottles and jars, trays and clamshells, wraps and films, and others. Boxes and cartons dominate due to their versatility and compatibility with automated e-commerce fulfillment systems. Pouches and sachets provide lightweight and space-saving advantages for compact goods. Trays and clamshells secure fragile products during transit, while wraps and films enhance product visibility and protection. It continues to evolve with design optimization that reduces waste and improves recyclability.
- For instance, Avery Dennison’s RFID-enabled smart wraps enhance supply chain visibility and reduce operational errors. These technologies are supported by the company’s documented logistics deployments, demonstrating measurable improvements in tracking accuracy and packaging efficiency across global retail operations.
By End User Industry
End user industries include food and beverage, personal care and cosmetics, pharmaceuticals, electronics, e-commerce and retail, and others. The food and beverage sector leads adoption due to high packaging volumes and focus on freshness preservation. Personal care and cosmetics emphasize premium and sustainable designs that reflect brand identity. Pharmaceuticals rely on traceable and tamper-evident packaging to ensure safety and compliance. Electronics and e-commerce sectors integrate smart tracking and recyclable solutions to improve delivery efficiency. It strengthens industry adaptability by supporting sustainability and digital transformation in packaging design.
Segmentation:
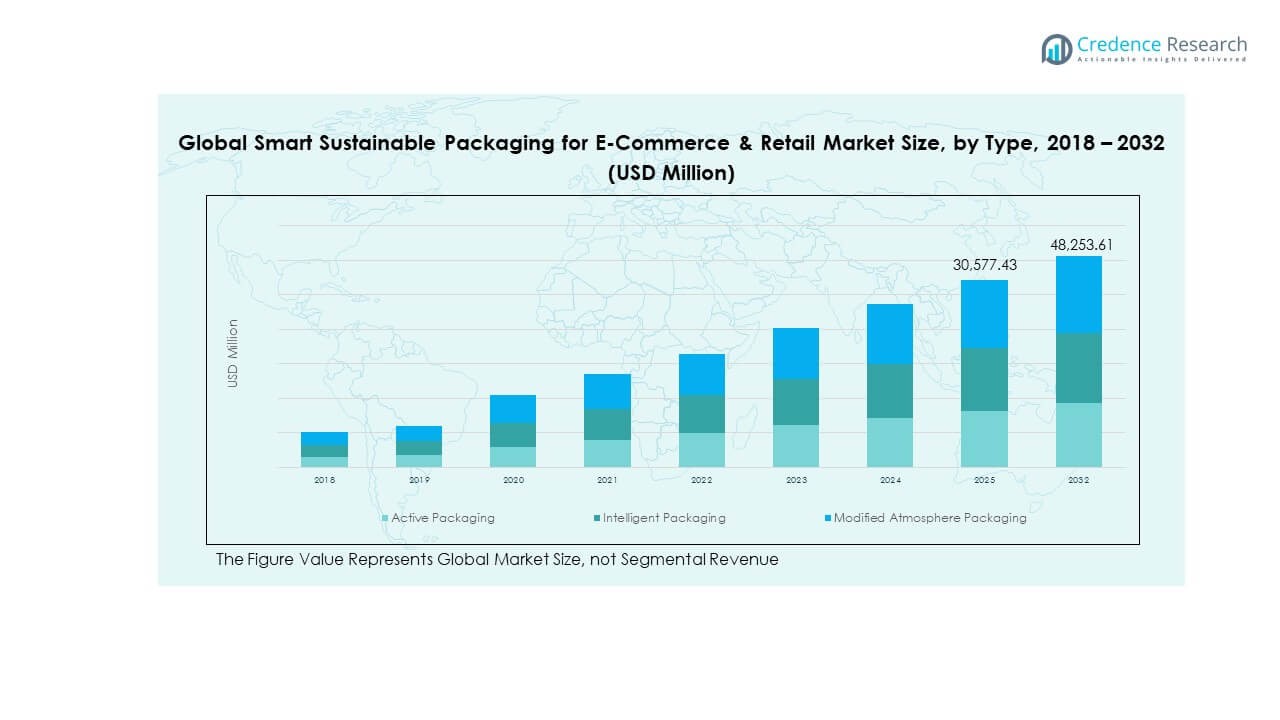
By Type
- Active Packaging
- Intelligent Packaging
- Modified Atmosphere Packaging
By Material
- Paper & Paperboard
- Plastics
- Glass
- Metal
- Others
By Packaging Format
- Boxes & Cartons
- Pouches & Sachets
- Bottles & Jars
- Trays & Clamshells
- Wraps & Films
- Others
By End User Industry
- Food & Beverage
- Personal Care & Cosmetics
- Pharmaceuticals
- Electronics
- E-Commerce & Retail
- Others
By Region
- North America
- U.S.
- Canada
- Mexico
- Europe
- Germany
- France
- U.K.
- Italy
- Spain
- Rest of Europe
- Asia Pacific
- China
- Japan
- India
- South Korea
- South-east Asia
- Rest of Asia Pacific
- Latin America
- Brazil
- Argentina
- Rest of Latin America
- Middle East & Africa
- GCC Countries
- South Africa
- Rest of the Middle East and Africa
Regional Analysis:
North America
The North America Global Smart Sustainable Packaging for E-Commerce & Retail Market size was valued at USD 7,799.93 million in 2018 to USD 11,915.30 million in 2024 and is anticipated to reach USD 20,888.96 million by 2032, at a CAGR of 6.8% during the forecast period. North America holds the largest market share of around 43.2% driven by strong digital retail ecosystems and early adoption of smart packaging. The region benefits from advanced logistics networks and robust recycling infrastructure. It leads in integrating RFID, IoT sensors, and traceable packaging solutions across retail channels. Brands invest heavily in automation to improve efficiency and reduce waste. The U.S. dominates due to e-commerce expansion and regulatory support for sustainable materials. Canada’s innovation hubs promote bio-based packaging development, while Mexico expands manufacturing capacity to serve cross-border trade. The region’s focus on technology and sustainability secures its leadership position in the global landscape.
Europe
The Europe Global Smart Sustainable Packaging for E-Commerce & Retail Market size was valued at USD 4,742.42 million in 2018 to USD 7,038.43 million in 2024 and is anticipated to reach USD 11,532.96 million by 2032, at a CAGR of 5.9% during the forecast period. Europe accounts for nearly 25.5% of the total market share supported by strict environmental regulations and extended producer responsibility schemes. The EU’s Green Deal accelerates adoption of recyclable and compostable packaging formats. Germany, France, and the U.K. drive innovation in eco-design and energy-efficient packaging production. It benefits from well-established circular economy frameworks and advanced R&D collaborations. Companies focus on replacing single-use plastics with paper and biopolymer materials. Digital printing and smart labeling are gaining traction to improve traceability. Rising demand from online grocery and fashion sectors strengthens regional revenue streams.
Asia Pacific
The Asia Pacific Global Smart Sustainable Packaging for E-Commerce & Retail Market size was valued at USD 3,687.50 million in 2018 to USD 6,137.60 million in 2024 and is anticipated to reach USD 12,063.86 million by 2032, at a CAGR of 8.3% during the forecast period. Asia Pacific represents about 22.2% of global share driven by rapid e-commerce expansion and rising consumer awareness. China and India dominate regional growth through large online retail ecosystems. Japan and South Korea invest in smart packaging technologies integrating sensors and QR code tracking. It benefits from large-scale manufacturing capabilities and cost-efficient production. Governments support eco-packaging startups through green financing programs. Regional suppliers strengthen export networks to meet global sustainability standards. Growth in retail modernization and urbanization boosts packaging innovation and material efficiency.
Latin America
The Latin America Global Smart Sustainable Packaging for E-Commerce & Retail Market size was valued at USD 864.43 million in 2018 to USD 1,318.18 million in 2024 and is anticipated to reach USD 2,045.88 million by 2032, at a CAGR of 5.1% during the forecast period. Latin America holds approximately 4.7% of the market share led by Brazil and Mexico. Regional growth stems from expanding digital commerce and sustainability-focused policies. It gains traction as global brands establish packaging production hubs to serve regional logistics. Consumer preference for environmentally responsible brands stimulates innovation. Brazil’s focus on bioplastic manufacturing supports local supply chains. Mexico’s proximity to North American trade routes enables export-oriented packaging operations. Rising retail digitization and public awareness about waste reduction enhance adoption rates. The region continues to attract investment for circular packaging solutions.
Middle East
The Middle East Global Smart Sustainable Packaging for E-Commerce & Retail Market size was valued at USD 471.06 million in 2018 to USD 660.74 million in 2024 and is anticipated to reach USD 962.13 million by 2032, at a CAGR of 4.3% during the forecast period. The Middle East accounts for 2.3% of the global market share driven by urbanization and rising e-commerce activity. The GCC countries invest in sustainable logistics infrastructure and packaging modernization. It benefits from government-backed circular economy initiatives focused on plastic waste reduction. The UAE and Saudi Arabia lead in introducing smart retail technologies with eco-friendly designs. Regional producers adopt advanced manufacturing systems to meet sustainability certification standards. Growing cross-border retail and digital platforms accelerate packaging innovations. The shift toward premium and personalized packaging strengthens consumer engagement across online channels.
Africa
The Africa Global Smart Sustainable Packaging for E-Commerce & Retail Market size was valued at USD 314.78 million in 2018 to USD 530.66 million in 2024 and is anticipated to reach USD 759.82 million by 2032, at a CAGR of 4.1% during the forecast period. Africa contributes roughly 2.1% of total market share with growing demand from South Africa, Nigeria, and Egypt. The region experiences early-stage adoption of sustainable and smart packaging technologies. Rising urban populations and expanding retail sectors foster gradual market penetration. It benefits from international partnerships promoting eco-friendly material production. Governments launch initiatives to strengthen local recycling capacity and reduce packaging waste. Online retail expansion creates new demand for secure and traceable packaging. Increasing awareness of environmental impacts drives interest in biodegradable alternatives across African markets.
Key Player Analysis:
- Amcor Limited
- Smurfit Kappa Group
- Mondi Group
- WestRock Company
- International Paper Company
- Sealed Air Corporation
- Berry Global Inc.
- Ball Corporation
- Crown Holdings, Inc.
- Huhtamaki Oyj
- Bemis Company, Inc.
- Tetra Pak International S.A.
Competitive Analysis:
The Global Smart Sustainable Packaging for E‑Commerce & Retail Market displays robust competition driven by innovation and sustainability mandates. Leading players such as Amcor Limited, Mondi Group and Sealed Air Corporation invest heavily in smart features like RFID tags, NFC chips and sensor-embedded packaging to enable traceability and engage consumers. They leverage scale to reduce costs on eco-friendly materials and deploy global supply chains for rapid deployment. Emerging firms focus on niche areas such as bio-based films and modular designs to capture premium segments. Price pressure from customers and regulatory requirements challenge margin levels. Firms differentiate by offering lifecycle services and digital platforms linked to packaging performance. Partnership activity remains high, with agreements between packaging firms and tech providers to integrate connectivity layers. The competitive landscape rewards those who combine sustainability credentials with technological capability and logistics efficiency.
Recent Developments:
- In August 2025, Ranpak partnered with Walmart to implement the Ranpak AutoFill system in Walmart's Next Generation Fulfillment Centers. This multi-year collaboration aims to boost fulfillment speed and reduce packaging waste by deploying automated and sustainable packaging technology.
- In January 2025, DS Smith introduced the Tape Back, a fiber-based packaging innovation that eliminates single-use plastic tear strips in e-commerce packaging. This new design reduces waste and supports smooth and sustainable returns using a single glue strip for two shipments.
- In November 2024, Amcor Limited announced its acquisition of Berry Global Inc. in an $8.4 billion all-stock deal expected to close by mid-2025. This combination expands Amcor’s portfolio with enhanced material science and innovation capabilities, positioning it as a global leader in consumer and healthcare packaging.
Report Coverage:
The research report offers an in-depth analysis based on Type, Material, Packaging Format and End User Industry. It details leading market players, providing an overview of their business, product offerings, investments, revenue streams, and key applications. Additionally, the report includes insights into the competitive environment, SWOT analysis, current market trends, as well as the primary drivers and constraints. Furthermore, it discusses various factors that have driven market expansion in recent years. The report also explores market dynamics, regulatory scenarios, and technological advancements that are shaping the industry. It assesses the impact of external factors and global economic changes on market growth. Lastly, it provides strategic recommendations for new entrants and established companies to navigate the complexities of the market.
Future Outlook:
- The Global Smart Sustainable Packaging for E-Commerce & Retail Market will continue expanding with increasing emphasis on low-carbon, recyclable, and smart materials integration.
- Advances in active and intelligent packaging technologies will enhance supply chain transparency and customer engagement.
- Growing e-commerce penetration will push brands to adopt lightweight and durable solutions that optimize delivery efficiency.
- Partnerships between packaging manufacturers and technology providers will drive innovation in connected and data-driven packaging systems.
- Regulatory mandates promoting circular economy practices will accelerate the replacement of single-use plastics across industries.
- Investments in AI-enabled design and predictive material management will streamline manufacturing and minimize waste.
- Consumer demand for personalization and traceability will encourage interactive packaging formats that merge function with brand experience.
- Asia Pacific will emerge as the fastest-growing region, supported by industrial scaling and digital commerce expansion.
- Companies will focus on building flexible production facilities to meet dynamic packaging requirements for diverse applications.
- The integration of smart sensors, bio-based materials, and energy-efficient systems will define the market’s next growth phase.
Request a Free Sample
Fill in your details and we'll send you a free sample report.
- Sample data tables & charts
- Research methodology
Need a Custom Version of This Report?
Tailor the scope, geography, or segments to your exact requirements.
- Custom geography or segment scope
- Direct access to our analyst team
Frequently Asked Questions
What is the current market size for Global Smart Sustainable Packaging for E-Commerce & Retail Market, and what is its projected size in 2032?
At what Compound Annual Growth Rate is the Global Smart Sustainable Packaging for E-Commerce & Retail Market projected to grow between 2024 and 2032?
Which Global Smart Sustainable Packaging for E-Commerce & Retail Market segment held the largest share in 2024?
What are the primary factors fueling the growth of the Global Smart Sustainable Packaging for E-Commerce & Retail Market?
Who are the leading companies in the Global Smart Sustainable Packaging for E-Commerce & Retail Market?
Which region commanded the largest share of the Global Smart Sustainable Packaging for E-Commerce & Retail Market in 2024?
Table of Content
Chapter 1. Report Introduction
- 1.1 Report Description & Purpose
- 1.1.1 Report Title & Market Definition
- 1.1.2 Unique Selling Propositions (USP) & Key Differentiators
- 1.1.3 Value Proposition for Stakeholders
- 1.2 Research Objectives
- 1.2.1 Market Sizing Objectives (Volume & Revenue)
- 1.2.2 Segmentation Objectives
- 1.2.3 Competitive Intelligence Objectives
- 1.2.4 Forecast & Scenario Objectives
- 1.3 Report Scope
- 1.3.1 Smart Sustainable Packaging for E-Commerce & Retail Scope – Types & Subtypes Covered
- 1.3.2 Geographic Scope – Regions & Countries Covered
- 1.3.3 Historical Period, Base Year & Forecast Period (2024; forecast to 2032)
- 1.3.4 Inclusions & Exclusions
- 1.4 HS Code & Classification Framework
- 1.5 Currency, Units & Pricing Basis
- 1.6 Target Stakeholders
- 1.7 Limitations & Assumptions
Chapter 2. Executive Summary
- 2.1 Global Smart Sustainable Packaging for E-Commerce & Retail Market Snapshot
- 2.1.1 Market Size – Historical (2024) & Forecast (2024-2032) (2024: USD 27,600.92 million → 2032: USD 48,253.61 million)
- 2.1.2 Volume & Revenue – Global Totals
- 2.1.3 Key Market Highlights – Top Five Facts
- 2.2 Smart Sustainable Packaging for E-Commerce & Retail Market Segmentation Snapshot
- 2.2.1 Market Split by Region – 2024 vs. 2032
- 2.3 Competitive Snapshot
- 2.3.1 Top 10 Players by Revenue Share – 2024
- 2.3.2 Top 10 Players by Volume Share – 2024
- 2.3.3 Recent Strategic Developments (18-Month Summary)
- 2.4 Key Investment Highlights & Strategic Conclusions
Chapter 3. Smart Sustainable Packaging for E-Commerce & Retail Market Dynamics & Industry Analysis
- 3.1 Market Overview & Context
- 3.1.1 Smart Sustainable Packaging for E-Commerce & Retail Market Position in the Broader Automotive Value Chain
- 3.1.2 OEM vs. Replacement Market Dynamics
- 3.1.3 Market Maturity & Development Stage by Region
- 3.2 Smart Sustainable Packaging for E-Commerce & Retail Market Drivers
- 3.3 Smart Sustainable Packaging for E-Commerce & Retail Market Restraints & Challenges
- 3.4 Smart Sustainable Packaging for E-Commerce & Retail Market Opportunities
- 3.5 Porter's Five Forces Analysis
- 3.5.1 Threat of New Entrants
- 3.5.2 Bargaining Power of Suppliers
- 3.5.3 Bargaining Power of Buyers
- 3.5.4 Threat of Substitutes
- 3.5.5 Competitive Rivalry – Intensity Assessment
- 3.6 Smart Sustainable Packaging for E-Commerce & Retail Value Chain Analysis
- 3.6.1 Upstream – Raw Material/Input Suppliers
- 3.6.1.1 Raw Material/Input 1
- 3.6.1.2 Raw Material/Input 2
- 3.6.1.3 Raw Material/Input 3
- 3.6.2 Midstream – Production/Manufacturing/Service Delivery
- 3.6.2.1 Production/Process Overview
- 3.6.2.2 Key Facility Locations & Capacity by Manufacturer
- 3.6.3 Downstream – Distribution & End Consumer
- 3.6.3.1 Primary Channel – B2B/OEM
- 3.6.3.2 Secondary Channels – Dealer, Retail, Online, Direct
- 3.6.4 Value Chain Profitability Analysis
- 3.6.1 Upstream – Raw Material/Input Suppliers
- 3.7 PESTEL Analysis
- 3.7.1 Political Factors
- 3.7.2 Economic Factors
- 3.7.3 Social Factors
- 3.7.4 Technological Factors
- 3.7.5 Environmental Factors
- 3.7.6 Legal Factors
- 3.8 Smart Sustainable Packaging for E-Commerce & Retail Supply Chain Analysis
- 3.8.1 Raw Material/Input Supply Risk Assessment
- 3.8.2 Manufacturing Concentration Risk (Geographic Exposure)
- 3.8.3 Trade Disruption Impact Analysis
- 3.9 Regulatory & Policy Landscape
Note: The regulatory and policy landscape section covers regulations based on their applicability to the market, Smart Sustainable Packaging for E-Commerce & Retail category, geography, and scope of the study. Only regulatory frameworks with a material impact on operations, compliance, trade, sustainability, or market access are analyzed in detail.
Chapter 4. Key Investment Pockets & Opportunity Analysis
- 4.1 Smart Sustainable Packaging for E-Commerce & Retail Market Attractiveness Analysis
- 4.1.1 By Region – Investment Attractiveness Matrix (Volume × CAGR)
- 4.2 Absolute Revenue Growth Opportunity
- 4.2.1 By Region – Absolute USD Growth Through 2032
- 4.3 Incremental Volume Opportunity
- 4.3.1 By Region – Incremental Volume Through 2032
- 4.3.2 Segment – Incremental Volume
- 4.4 Emerging Submarket Opportunity Deep Dive (Subject to Applicability)
- 4.5 Emerging Market Opportunity Scorecards
- 4.5.1 United States
- 4.5.2 Europe
- 4.5.3 Asia
- 4.5.4 Middle East & Africa
Note: Emerging Market Opportunity Scorecards will be included based on relevance and strategic importance. Regions listed are indicative and may vary depending on data availability and market dynamics.
Chapter 5. Smart Sustainable Packaging for E-Commerce & Retail Import-Export Analysis & Trade Flows
- 5.1 Global Trade Overview
- 5.1.1 Global Export Value by Country (2024)
- 5.1.2 Global Export Volume by Country (2024)
- 5.1.3 Global Import Value by Country (2024)
- 5.1.4 Global Import Volume by Country (2024)
- 5.1.5 Net Trade Balance by Country (2024)
- 5.2 Export Analysis – Segment
- 5.2.1 Type 1 (HS Code)
- 5.2.2 Type 2 (HS Code)
- 5.2.3 Type 3 (HS Code)
- 5.2.4 Type 4 (HS Code)
- 5.2.5 Type 5 (HS Code)
- 5.3 Import Analysis – Segment
- 5.3.1 Type 1 (HS Code)
- 5.3.2 Type 2 (HS Code)
- 5.3.3 Type 3 (HS Code)
- 5.3.4 Type 4 (HS Code)
- 5.3.5 Type 5 (HS Code)
- 5.4 Average Unit Trade Prices
- 5.4.1 Average Export Price – Segment & Country
- 5.4.2 Average Import Price – Segment & Source Country
- 5.4.3 Price Trends (2024)
- 5.5 Key Trade Route Analysis
- 5.5.1 Trade Route 1
- 5.5.2 Trade Route 2
- 5.5.3 Trade Route 3
- 5.5.4 Trade Route 4
- 5.5.5 Trade Route 5
- 5.6 Trade Policy Impact Assessment
- 5.6.1 US Anti-Dumping & Section 301 Tariffs
- 5.6.2 EU Customs Union Impact
- 5.6.3 Major Free Trade Agreements
- 5.6.4 USMCA Rules of Origin
Note: Trade policy analysis will be included only where relevant to the Smart Sustainable Packaging for E-Commerce & Retail market.
Chapter 6. Competitive Landscape & Company Benchmarking
- 6.1 Smart Sustainable Packaging for E-Commerce & Retail Market Concentration & Structure
- 6.1.1 Herfindahl-Hirschman Index (HHI) – vs. 2024
- 6.1.2 Tier 1, Tier 2 & Tier 3 Market Structure
- 6.1.3 Global, Regional & Local Player Dynamics
- 6.2 Smart Sustainable Packaging for E-Commerce & Retail Market Share Analysis – 2024
- 6.2.1 Global Revenue Share by Company
- 6.2.2 Global Volume Share by Company
- 6.2.3 Regional Revenue Share
- 6.2.4 Market Share Evolution ( vs. 2024)
- 6.2.5 OEM Segment Share by Company
- 6.2.6 Replacement Segment Share by Company
- 6.3 Production/Delivery Capacity & Facility Analysis
- 6.3.1 Global Installed Capacity
- 6.3.2 Capacity Utilization Rates
- 6.3.3 Production/Output Volume
- 6.3.4 Facility Locations & Capacity Map
- 6.3.5 Planned Capacity Additions
- 6.4 Smart Sustainable Packaging for E-Commerce & Retail Competitive Benchmarking Matrix
- 6.4.1 Revenue, Volume, CAGR & Profitability Comparison
- 6.4.2 Channel Revenue Mix
- 6.4.3 Geographic Revenue Exposure
- 6.4.4 R&D Intensity
- 6.4.5 Sustainability Maturity
- 6.5 Strategic Developments in Smart Sustainable Packaging for E-Commerce & Retail (Last 24 Months)
- 6.5.1 Mergers, Acquisitions & Divestments
- 6.5.2 New Smart Sustainable Packaging for E-Commerce & Retail Launches
- 6.5.3 Facility Expansions
- 6.5.4 Strategic Alliances, Joint Ventures & Partnerships
- 6.5.5 Distribution Expansion & Market Entry
- 6.5.6 Sustainability & ESG Initiatives
- 6.6 Competitive Strategy Mapping
- 6.6.1 Leader, Challenger, Follower & Niche Classification
- 6.6.2 Pricing Strategy Comparison
- 6.6.3 Channel Strategy Matrix
Note: Strategic developments are included based on their materiality and the availability of reliable information.
Chapter 7. Global Smart Sustainable Packaging for E-Commerce & Retail Market – By Distribution Channel
- 7.1 Segment Overview
- 7.1.1 Volume & Revenue Split by Channel (2024 & 2032)
- 7.1.2 Channel Mix Evolution (2024-2032)
Chapter 8. Regional Market Analysis – Global Overview
- 8.1 Global Regional Overview
- 8.1.1 Regional Volume Share
- 8.1.2 Regional Revenue Share
- 8.1.3 Regional Volume by Region
- 8.1.4 Regional Revenue by Region
- 8.1.5 Regional Forecast Through 2032
- 8.2 Cross-Regional Segment Analysis
- 8.2.1 By Distribution Channel
- 8.2.2 By Brand/Price Tier
Chapter 9. North America Smart Sustainable Packaging for E-Commerce & Retail Market
- 9.1 United States
- 9.2 Canada
- 9.3 Mexico
Chapter 10. Europe Smart Sustainable Packaging for E-Commerce & Retail Market
- 10.1 Germany
- 10.2 France
- 10.3 Italy
- 10.4 United Kingdom
- 10.5 Spain
- 10.6 Poland
- 10.7 Russia
- 10.8 Netherlands
- 10.9 Belgium
- 10.10 Sweden
- 10.11 Denmark
- 10.12 Norway
- 10.13 Rest of Europe
Chapter 11. Asia Pacific Smart Sustainable Packaging for E-Commerce & Retail Market
- 11.1 China
- 11.2 India
- 11.3 Japan
- 11.4 South Korea
- 11.5 Thailand
- 11.6 Indonesia
- 11.7 Vietnam
- 11.8 Malaysia
- 11.9 Australia
- 11.10 Rest of Asia Pacific
Chapter 12. Latin America Smart Sustainable Packaging for E-Commerce & Retail Market
- 12.1 Brazil
- 12.2 Argentina
- 12.3 Colombia
- 12.4 Chile
- 12.5 Rest of Latin America
Chapter 13. Middle East Smart Sustainable Packaging for E-Commerce & Retail Market
- 13.1 Saudi Arabia
- 13.2 United Arab Emirates
- 13.3 Turkey
- 13.4 Israel
- 13.5 Iran
- 13.6 Rest of the Middle East
Chapter 14. Africa Smart Sustainable Packaging for E-Commerce & Retail Market
- 14.1 South Africa
- 14.2 Egypt
- 14.3 Nigeria
- 14.4 Morocco
- 14.5 Rest of Africa
Chapter 15. Smart Sustainable Packaging for E-Commerce & Retail Company Profiles
- 15.1 [Company 01]
- 15.1.1 Company Overview
- 15.1.2 Key Management Personnel
- 15.1.3 Products & Services Portfolio
- 15.1.4 Financial Performance
- 15.1.5 Key Market Focus & Geographic Presence
- 15.1.6 Recent Developments & Strategic Initiatives
Note: The company profile list is preliminary and may change based on research findings, market developments, data availability, and client requirements.
Chapter 16. Appendices
- Appendix A – List of Abbreviations & Acronyms
- Appendix B – Industry Classification Code Reference – Full Series
- Appendix C – Production & Capacity Data Tables
- Appendix D – End-Use & Demand Base Tables
- Appendix E – Consumption & Replacement Rate Assumptions
- Appendix F – ASP Reference Tables
- Appendix G – Manufacturing & Facility Database
- Appendix H – Import-Export Data Tables
- Appendix I – Regulatory Summary Tables
- Appendix J – Primary Research Participant List (Anonymized)
- Appendix K – Primary Research Questionnaire Framework
- Appendix L – Data Sources & Bibliography
- Appendix M – Market Size Divergence & Source Comparison
Chapter 17. Research Methodology
- 17.1 Research Framework & Philosophy
- 17.2 Secondary Research – Sources, Hierarchy & Data Extraction
- 17.3 Data Modeling – Bottom-Up & Top-Down Market Sizing
- 17.4 Primary Research – Stakeholder Framework, LOI & Sample Sizes
- 17.5 Forecast Methodology – Regression, Scenario & Sensitivity Analysis
- 17.6 Quality Control – Four-Layer Validation Framework
- 17.7 Limitations & Standard Assumptions
- 17.8 Disclaimer
