
Flow Wraps Market Overview:
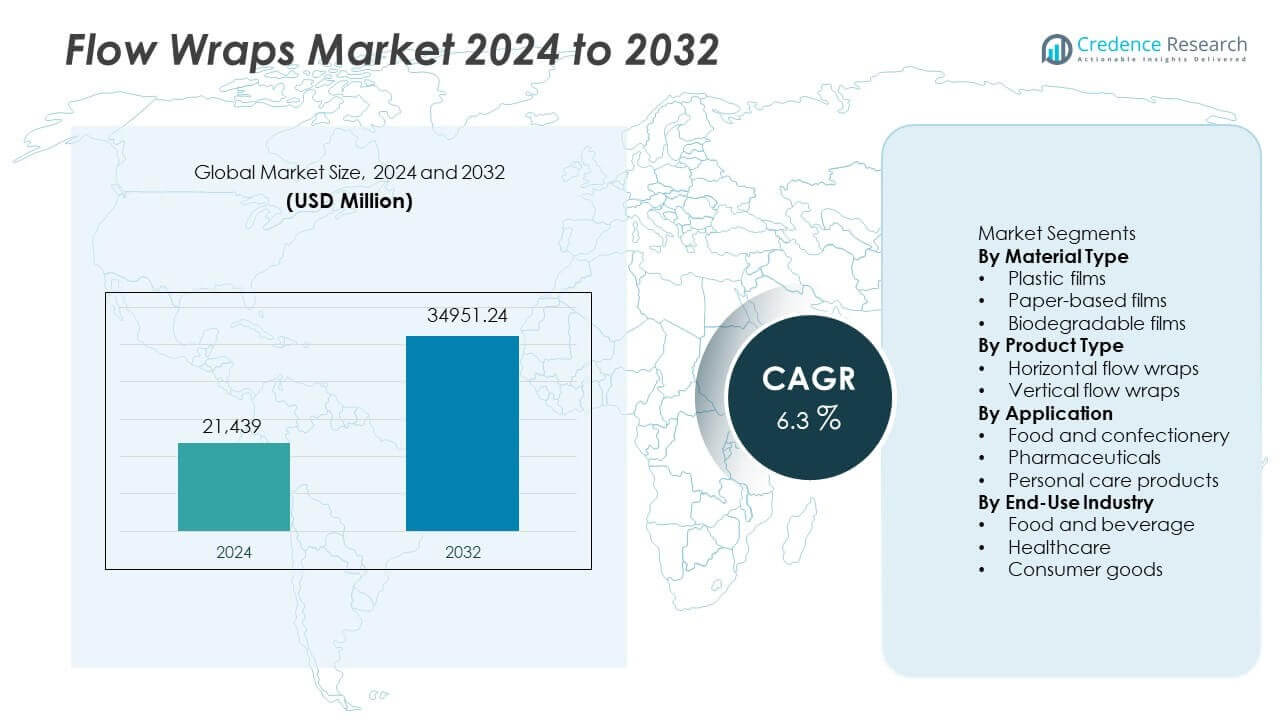
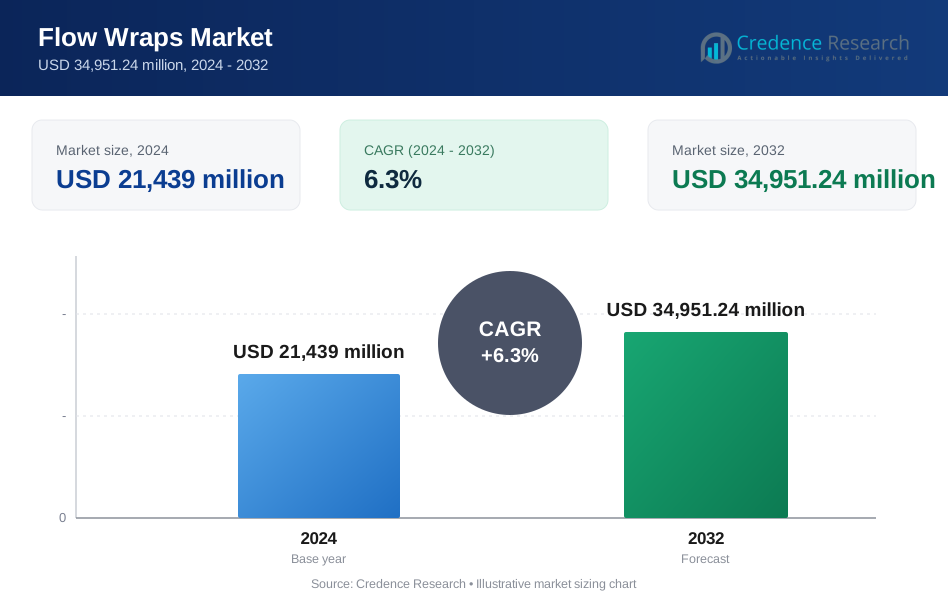
The flow wraps market was valued at USD 21,439 million in 2024. The market is projected to reach USD 34,951.24 million by 2032. Growth is expected at a CAGR of 6.3% during the forecast period.
| REPORT ATTRIBUTE | DETAILS |
|---|---|
| Historical Period | 2020-2024 |
| Base Year | 2025 |
| Forecast Period | 2026-2032 |
| Flow Wraps Market Size 2024 | USD 21,439 million |
| Flow Wraps Market CAGR | 6.3% |
| Flow Wraps Market Size 2032 | USD 34,951.24 million |
Flow Wraps Market Insights
- Growing consumption of snacks, bakery items, and ready-to-eat foods drives Flow Wraps market growth due to high-speed and cost-efficient packaging needs.
- Plastic films dominate with a 62% segment share, while horizontal flow wraps lead with a 71% share, supported by automation compatibility and sealing efficiency.
- Competition remains strong as manufacturers focus on sustainable materials, recyclable films, and advanced printing for brand differentiation.
- Asia Pacific holds a 30% regional share, followed by North America at 32% and Europe at 28%, driven by food manufacturing scale, automation adoption, and regulatory compliance.
Flow Wraps Market Segmentation Analysis:
By Material Type
Plastic films dominate the Flow Wraps market with a 62% segment share. Manufacturers prefer plastic films due to strong barrier protection and seal integrity. High-speed packaging lines rely on plastic flexibility and strength. Cost efficiency supports large-scale food packaging use. Paper-based films hold a 23% share, driven by sustainability goals and brand image. Biodegradable films account for a 15% share, supported by regulatory pressure and eco-friendly demand. Plastic films lead because they balance performance and cost. Continuous material innovation improves recyclability while maintaining dominance across mass-market packaging applications.
- For instance, Amcor developed recycle-ready PE flow wrap films with oxygen transmission rates below 10 cc/m²/day and seal strengths exceeding 12 N/15 mm, supporting speeds above 600 packs per minute.
By Product Type
Horizontal flow wraps lead the market with a 71% market share. Food producers widely use horizontal systems for snacks and bakery items. High throughput and consistent sealing drive adoption. Compatibility with automated lines supports efficiency gains. Vertical flow wraps hold a 29% share, mainly used for granular and loose products. Horizontal dominance reflects strong use in single-serve and portioned products. Flexible machine configurations support product variety. Rising demand for packaged convenience foods continues reinforcing horizontal flow wrap system leadership.
- For instance, Bosch Packaging Technology validated horizontal flow wrap machines achieving output rates of 800 packs per minute with seal defect rates below 1 per 10,000 packs in commercial snack applications.
By Application
Food and confectionery represent the largest application segment with a 68% market share. Flow wraps protect freshness and extend shelf life. High snack consumption drives packaging volume growth. Pharmaceuticals hold a 19% share, supported by unit-dose and hygiene requirements. Personal care products account for an 13% share, driven by compact packaging needs. Food dominance reflects daily consumption frequency and high packaging turnover. Branding visibility and cost control further strengthen flow wrap usage across food applications.
Key Growth Drivers
Rising Demand for Packaged and Convenience Foods
Packaged food consumption continues rising across urban markets. Busy lifestyles increase demand for ready-to-eat snacks. Flow wraps support high-speed packaging for single-serve products. Strong sealing preserves freshness and shelf life. Food brands value cost efficiency and branding visibility. Retail expansion supports higher packaged food volumes. Portion control trends favor flow-wrapped formats. E-commerce grocery growth increases packaging needs. This driver sustains strong volume demand for flow wraps across snacks, bakery, and confectionery categories.
- For instance, Mondi supplies flow wrap films validated on snack lines running at 700 packs per minute, while maintaining seal integrity after 30 days of ambient storage.
Expansion of High-Speed Automated Packaging Lines
Manufacturers invest in automation to improve efficiency. Flow wrap machines integrate well with high-speed lines. Consistent sealing reduces waste and downtime. Automation lowers labor dependency and costs. Standardized packaging improves output quality. Horizontal flow wraps fit diverse product shapes. Equipment upgrades increase throughput capacity. Large-scale producers prefer scalable solutions. This driver accelerates adoption of flow wraps across food, pharma, and personal care production facilities.
- For instance, Syntegon flow wrap systems operate continuously for 20 hours per day with changeover times below 15 minutes, supporting stable output across multi-product automated lines.
Growth in Pharmaceutical and Hygiene Packaging Needs
Healthcare packaging prioritizes hygiene and protection. Unit-dose packaging gains importance in pharmaceuticals. Flow wraps provide tamper resistance and cleanliness. Rising OTC product demand supports packaging growth. Regulatory compliance drives reliable sealing solutions. Personal care travel sizes gain popularity. Compact packs support retail and e-commerce sales. This driver expands flow wrap usage beyond food into regulated sectors.
Key Trends & Opportunities
Shift Toward Sustainable and Recyclable Materials
Sustainability shapes packaging decisions globally. Brands explore recyclable plastic and paper-based films. Mono-material solutions gain traction. Regulatory pressure accelerates material transitions. Consumers favor eco-friendly packaging claims. Lightweight materials reduce material use. Innovation improves barrier performance of sustainable films. This trend creates opportunities for differentiated flow wrap materials and premium sustainable offerings.
- For instance, Sealed Air developed recycle-ready mono-PE flow wrap films with ultra-thin structure thickness, delivering optimized moisture barrier properties while maintaining high-speed machinability on snack lines.
Customization and Branding on Flow Wrap Packaging
Brand visibility remains critical at retail. Flow wraps offer large printable surfaces. Custom graphics enhance shelf appeal. Short-run printing supports promotions. Digital printing enables faster changeovers. Personalization improves brand engagement. Seasonal packaging drives repeat purchases. This trend opens opportunities for value-added printing and design services.
- For instance, Constantia Flexibles operates high-definition flexographic printing for flow wrap applications, utilizing advanced registration technology to ensure consistent multi-color branding across high-volume product runs.
Key Challenges
Environmental Concerns Around Plastic Waste
Plastic-based flow wraps face scrutiny. Recycling infrastructure varies by region. Multi-layer films complicate recyclability. Regulatory bans increase compliance costs. Brand reputation risks rise with plastic use. Transition costs affect margins. Material performance trade-offs persist. This challenge pressures manufacturers to innovate sustainably.
Volatility in Raw Material Prices
Resin and paper prices fluctuate frequently. Energy costs impact film production. Price volatility affects packaging margins. Long-term contracts limit flexibility. Cost pass-through faces resistance from brand owners. Supply disruptions impact availability. Smaller converters face higher risk. This challenge requires strong sourcing and cost management strategies.
Regional Analysis
North America
North America holds a 32% market share in the flow wraps market. Strong packaged food consumption supports high demand. Snack foods, bakery items, and confectionery drive packaging volumes. Automation adoption remains high across food manufacturing plants. Brands emphasize shelf appeal and product protection. Pharmaceutical packaging also supports steady demand. Sustainability initiatives influence material selection. Retail and e-commerce growth increase single-serve packaging needs. Advanced packaging machinery and strong converter presence sustain market maturity across the United States and Canada.
Europe
Europe accounts for a 28% market share in the flow wraps market. Strict food safety and packaging regulations shape demand. Sustainable and recyclable materials gain strong preference. Packaged bakery and confectionery consumption supports volumes. Private-label food brands increase packaging demand. Automation and efficiency remain priorities for manufacturers. Pharmaceutical and personal care packaging add incremental growth. Western Europe leads adoption due to advanced retail infrastructure. Regulatory focus drives innovation in eco-friendly flow wrap materials.
Asia Pacific
Asia Pacific represents a 30% market share in the flow wraps market. Rapid urbanization boosts packaged food consumption. Expanding middle-class income supports snack and convenience food demand. High population density drives volume packaging needs. Local food producers adopt automated flow wrap solutions. Cost-effective plastic films dominate usage. Pharmaceutical packaging demand grows with healthcare expansion. E-commerce food delivery supports single-pack formats. China and India lead regional growth due to scale and manufacturing expansion.
Rest of the World
The rest of the world holds a 10% market share in the flow wraps market. Latin America and the Middle East drive regional demand. Growing packaged food adoption supports steady growth. Cost sensitivity favors plastic-based flow wraps. Retail modernization improves packaging penetration. Pharmaceutical unit-dose packaging contributes to demand. Local manufacturers expand capacity gradually. Infrastructure development supports automation adoption. The region offers long-term opportunities as packaged food consumption and retail access increase.
Flow Wraps Market Segmentations:
By Material Type
- Plastic films
- Paper-based films
- Biodegradable films
By Product Type
- Horizontal flow wraps
- Vertical flow wraps
By Application
- Food and confectionery
- Pharmaceuticals
- Personal care products
By End-Use Industry
- Food and beverage
- Healthcare
- Consumer goods
By Geography
- North America
- U.S.
- Canada
- Mexico
- Europe
- Germany
- France
- U.K.
- Italy
- Spain
- Rest of Europe
- Asia Pacific
- China
- Japan
- India
- South Korea
- South-east Asia
- Rest of Asia Pacific
- Latin America
- Brazil
- Argentina
- Rest of Latin America
- Middle East & Africa
- GCC Countries
- South Africa
- Rest of the Middle East and Africa
Competitive Landscape
Competitive landscape analysis highlights Amcor, Berry Global, Mondi Group, Huhtamaki, and Sealed Air as major participants in the Flow Wraps market. These players compete through material innovation, large-scale manufacturing, and global customer reach. Market leaders focus on high-barrier films, improved seal performance, and compatibility with high-speed packaging lines. Sustainability initiatives, including recyclable and mono-material flow wraps, play a key role in differentiation. Strong relationships with food and confectionery brands support long-term contracts. Investments in printing technology enhance branding and customization capabilities. Regional expansion and capacity upgrades strengthen supply reliability. Competitive pressure remains high as brands demand cost efficiency, sustainability compliance, and consistent packaging performance across diverse applications.
Key Player Analysis
- Amcor
- Berry Global
- Mondi Group
- Huhtamaki
- Sealed Air
- Coveris
- Uflex
- Constantia Flexibles
- ProAmpac
- Winpak
Recent Developments
- In August 2025, Mondi Group scaled FunctionalBarrier Paper Ultimate with OTR and WVTR below 0.5.
- In December 2024, Berry Global partnered with VOID Technologies on a recyclable, high-toughness film.
- In August 2024, Constantia Flexibles stated recyclable alternatives are available for more than 90% of its portfolio.
Report Coverage
The research report offers an in-depth analysis based on Material Type, Product Type, Application, End-Use Industry and Geography. It details leading market players, providing an overview of their business, product offerings, investments, revenue streams, and key applications. Additionally, the report includes insights into the competitive environment, SWOT analysis, current market trends, as well as the primary drivers and constraints. Furthermore, it discusses various factors that have driven market expansion in recent years. The report also explores market dynamics, regulatory scenarios, and technological advancements that are shaping the industry. It assesses the impact of external factors and global economic changes on market growth. Lastly, it provides strategic recommendations for new entrants and established companies to navigate the complexities of the market.
Future Outlook
- Packaged food demand will continue driving flow wrap consumption.
- Automation adoption will increase use of high-speed flow wrap systems.
- Sustainable and recyclable materials will gain wider acceptance.
- Mono-material films will see higher development and usage.
- Branding and visual appeal will remain key purchase drivers.
- E-commerce growth will support demand for durable flow wrap packaging.
- Pharmaceutical unit-dose packaging will expand flow wrap applications.
- Emerging markets will contribute higher volume growth.
- Cost efficiency will remain critical for brand owners.
- Strategic partnerships will strengthen supply chain reliability.
Request a Free Sample
Fill in your details and we'll send you a free sample report.
- Sample data tables & charts
- Research methodology
Need a Custom Version of This Report?
Tailor the scope, geography, or segments to your exact requirements.
- Custom geography or segment scope
- Direct access to our analyst team
Frequently Asked Questions
What is the current market size for Flow Wraps market, and what is its projected size in 2032?
At what Compound Annual Growth Rate is the Flow Wraps market projected to grow between 2024 and 2032?
Which Flow Wraps market segment held the largest share in 2024?
What are the primary factors fueling the growth of the Flow Wraps market?
Who are the leading companies in the Flow Wraps market?
Which region commanded the largest share of the Flow Wraps market in 2024?
Table of Content
Chapter 1. Report Introduction
- 1.1 Report Description & Purpose
- 1.1.1 Report Title & Market Definition
- 1.1.2 Unique Selling Propositions (USP) & Key Differentiators
- 1.1.3 Value Proposition for Stakeholders
- 1.2 Research Objectives
- 1.2.1 Market Sizing Objectives (Volume & Revenue)
- 1.2.2 Segmentation Objectives
- 1.2.3 Competitive Intelligence Objectives
- 1.2.4 Forecast & Scenario Objectives
- 1.3 Report Scope
- 1.3.1 Flow Wraps Scope – Types & Subtypes Covered
- 1.3.2 Geographic Scope – Regions & Countries Covered
- 1.3.3 Historical Period, Base Year & Forecast Period (2024; forecast to 2032)
- 1.3.4 Inclusions & Exclusions
- 1.4 HS Code & Classification Framework
- 1.5 Currency, Units & Pricing Basis
- 1.6 Target Stakeholders
- 1.7 Limitations & Assumptions
Chapter 2. Executive Summary
- 2.1 Global Flow Wraps Market Snapshot
- 2.1.1 Market Size – Historical (2024) & Forecast (2024-2032) (2024: USD 21,439 million → 2032: USD 34,951.24 million)
- 2.1.2 Volume & Revenue – Global Totals
- 2.1.3 Key Market Highlights – Top Five Facts
- 2.2 Flow Wraps Market Segmentation Snapshot
- 2.2.1 Market Split by Region – 2024 vs. 2032
- 2.3 Competitive Snapshot
- 2.3.1 Top 10 Players by Revenue Share – 2024
- 2.3.2 Top 10 Players by Volume Share – 2024
- 2.3.3 Recent Strategic Developments (18-Month Summary)
- 2.4 Key Investment Highlights & Strategic Conclusions
Chapter 3. Flow Wraps Market Dynamics & Industry Analysis
- 3.1 Market Overview & Context
- 3.1.1 Flow Wraps Market Position in the Broader Automotive Value Chain
- 3.1.2 OEM vs. Replacement Market Dynamics
- 3.1.3 Market Maturity & Development Stage by Region
- 3.2 Flow Wraps Market Drivers
- 3.3 Flow Wraps Market Restraints & Challenges
- 3.4 Flow Wraps Market Opportunities
- 3.5 Porter's Five Forces Analysis
- 3.5.1 Threat of New Entrants
- 3.5.2 Bargaining Power of Suppliers
- 3.5.3 Bargaining Power of Buyers
- 3.5.4 Threat of Substitutes
- 3.5.5 Competitive Rivalry – Intensity Assessment
- 3.6 Flow Wraps Value Chain Analysis
- 3.6.1 Upstream – Raw Material/Input Suppliers
- 3.6.1.1 Raw Material/Input 1
- 3.6.1.2 Raw Material/Input 2
- 3.6.1.3 Raw Material/Input 3
- 3.6.2 Midstream – Production/Manufacturing/Service Delivery
- 3.6.2.1 Production/Process Overview
- 3.6.2.2 Key Facility Locations & Capacity by Manufacturer
- 3.6.3 Downstream – Distribution & End Consumer
- 3.6.3.1 Primary Channel – B2B/OEM
- 3.6.3.2 Secondary Channels – Dealer, Retail, Online, Direct
- 3.6.4 Value Chain Profitability Analysis
- 3.6.1 Upstream – Raw Material/Input Suppliers
- 3.7 PESTEL Analysis
- 3.7.1 Political Factors
- 3.7.2 Economic Factors
- 3.7.3 Social Factors
- 3.7.4 Technological Factors
- 3.7.5 Environmental Factors
- 3.7.6 Legal Factors
- 3.8 Flow Wraps Supply Chain Analysis
- 3.8.1 Raw Material/Input Supply Risk Assessment
- 3.8.2 Manufacturing Concentration Risk (Geographic Exposure)
- 3.8.3 Trade Disruption Impact Analysis
- 3.9 Regulatory & Policy Landscape
Note: The regulatory and policy landscape section covers regulations based on their applicability to the market, Flow Wraps category, geography, and scope of the study. Only regulatory frameworks with a material impact on operations, compliance, trade, sustainability, or market access are analyzed in detail.
Chapter 4. Key Investment Pockets & Opportunity Analysis
- 4.1 Flow Wraps Market Attractiveness Analysis
- 4.1.1 By Region – Investment Attractiveness Matrix (Volume × CAGR)
- 4.2 Absolute Revenue Growth Opportunity
- 4.2.1 By Region – Absolute USD Growth Through 2032
- 4.3 Incremental Volume Opportunity
- 4.3.1 By Region – Incremental Volume Through 2032
- 4.3.2 Segment – Incremental Volume
- 4.4 Emerging Submarket Opportunity Deep Dive (Subject to Applicability)
- 4.5 Emerging Market Opportunity Scorecards
- 4.5.1 United States
- 4.5.2 Europe
- 4.5.3 Asia
- 4.5.4 Middle East & Africa
Note: Emerging Market Opportunity Scorecards will be included based on relevance and strategic importance. Regions listed are indicative and may vary depending on data availability and market dynamics.
Chapter 5. Flow Wraps Import-Export Analysis & Trade Flows
- 5.1 Global Trade Overview
- 5.1.1 Global Export Value by Country (2024)
- 5.1.2 Global Export Volume by Country (2024)
- 5.1.3 Global Import Value by Country (2024)
- 5.1.4 Global Import Volume by Country (2024)
- 5.1.5 Net Trade Balance by Country (2024)
- 5.2 Export Analysis – Segment
- 5.2.1 Type 1 (HS Code)
- 5.2.2 Type 2 (HS Code)
- 5.2.3 Type 3 (HS Code)
- 5.2.4 Type 4 (HS Code)
- 5.2.5 Type 5 (HS Code)
- 5.3 Import Analysis – Segment
- 5.3.1 Type 1 (HS Code)
- 5.3.2 Type 2 (HS Code)
- 5.3.3 Type 3 (HS Code)
- 5.3.4 Type 4 (HS Code)
- 5.3.5 Type 5 (HS Code)
- 5.4 Average Unit Trade Prices
- 5.4.1 Average Export Price – Segment & Country
- 5.4.2 Average Import Price – Segment & Source Country
- 5.4.3 Price Trends (2024)
- 5.5 Key Trade Route Analysis
- 5.5.1 Trade Route 1
- 5.5.2 Trade Route 2
- 5.5.3 Trade Route 3
- 5.5.4 Trade Route 4
- 5.5.5 Trade Route 5
- 5.6 Trade Policy Impact Assessment
- 5.6.1 US Anti-Dumping & Section 301 Tariffs
- 5.6.2 EU Customs Union Impact
- 5.6.3 Major Free Trade Agreements
- 5.6.4 USMCA Rules of Origin
Note: Trade policy analysis will be included only where relevant to the Flow Wraps market.
Chapter 6. Competitive Landscape & Company Benchmarking
- 6.1 Flow Wraps Market Concentration & Structure
- 6.1.1 Herfindahl-Hirschman Index (HHI) – vs. 2024
- 6.1.2 Tier 1, Tier 2 & Tier 3 Market Structure
- 6.1.3 Global, Regional & Local Player Dynamics
- 6.2 Flow Wraps Market Share Analysis – 2024
- 6.2.1 Global Revenue Share by Company
- 6.2.2 Global Volume Share by Company
- 6.2.3 Regional Revenue Share
- 6.2.4 Market Share Evolution ( vs. 2024)
- 6.2.5 OEM Segment Share by Company
- 6.2.6 Replacement Segment Share by Company
- 6.3 Production/Delivery Capacity & Facility Analysis
- 6.3.1 Global Installed Capacity
- 6.3.2 Capacity Utilization Rates
- 6.3.3 Production/Output Volume
- 6.3.4 Facility Locations & Capacity Map
- 6.3.5 Planned Capacity Additions
- 6.4 Flow Wraps Competitive Benchmarking Matrix
- 6.4.1 Revenue, Volume, CAGR & Profitability Comparison
- 6.4.2 Channel Revenue Mix
- 6.4.3 Geographic Revenue Exposure
- 6.4.4 R&D Intensity
- 6.4.5 Sustainability Maturity
- 6.5 Strategic Developments in Flow Wraps (Last 24 Months)
- 6.5.1 Mergers, Acquisitions & Divestments
- 6.5.2 New Flow Wraps Launches
- 6.5.3 Facility Expansions
- 6.5.4 Strategic Alliances, Joint Ventures & Partnerships
- 6.5.5 Distribution Expansion & Market Entry
- 6.5.6 Sustainability & ESG Initiatives
- 6.6 Competitive Strategy Mapping
- 6.6.1 Leader, Challenger, Follower & Niche Classification
- 6.6.2 Pricing Strategy Comparison
- 6.6.3 Channel Strategy Matrix
Note: Strategic developments are included based on their materiality and the availability of reliable information.
Chapter 7. Global Flow Wraps Market – By Distribution Channel
- 7.1 Segment Overview
- 7.1.1 Volume & Revenue Split by Channel (2024 & 2032)
- 7.1.2 Channel Mix Evolution (2024-2032)
Chapter 8. Regional Market Analysis – Global Overview
- 8.1 Global Regional Overview
- 8.1.1 Regional Volume Share
- 8.1.2 Regional Revenue Share
- 8.1.3 Regional Volume by Region
- 8.1.4 Regional Revenue by Region
- 8.1.5 Regional Forecast Through 2032
- 8.2 Cross-Regional Segment Analysis
- 8.2.1 By Distribution Channel
- 8.2.2 By Brand/Price Tier
Chapter 9. North America Flow Wraps Market
- 9.1 United States
- 9.2 Canada
- 9.3 Mexico
Chapter 10. Europe Flow Wraps Market
- 10.1 Germany
- 10.2 France
- 10.3 Italy
- 10.4 United Kingdom
- 10.5 Spain
- 10.6 Poland
- 10.7 Russia
- 10.8 Netherlands
- 10.9 Belgium
- 10.10 Sweden
- 10.11 Denmark
- 10.12 Norway
- 10.13 Rest of Europe
Chapter 11. Asia Pacific Flow Wraps Market
- 11.1 China
- 11.2 India
- 11.3 Japan
- 11.4 South Korea
- 11.5 Thailand
- 11.6 Indonesia
- 11.7 Vietnam
- 11.8 Malaysia
- 11.9 Australia
- 11.10 Rest of Asia Pacific
Chapter 12. Latin America Flow Wraps Market
- 12.1 Brazil
- 12.2 Argentina
- 12.3 Colombia
- 12.4 Chile
- 12.5 Rest of Latin America
Chapter 13. Middle East Flow Wraps Market
- 13.1 Saudi Arabia
- 13.2 United Arab Emirates
- 13.3 Turkey
- 13.4 Israel
- 13.5 Iran
- 13.6 Rest of the Middle East
Chapter 14. Africa Flow Wraps Market
- 14.1 South Africa
- 14.2 Egypt
- 14.3 Nigeria
- 14.4 Morocco
- 14.5 Rest of Africa
Chapter 15. Flow Wraps Company Profiles
- 15.1 [Company 01]
- 15.1.1 Company Overview
- 15.1.2 Key Management Personnel
- 15.1.3 Products & Services Portfolio
- 15.1.4 Financial Performance
- 15.1.5 Key Market Focus & Geographic Presence
- 15.1.6 Recent Developments & Strategic Initiatives
Note: The company profile list is preliminary and may change based on research findings, market developments, data availability, and client requirements.
Chapter 16. Appendices
- Appendix A – List of Abbreviations & Acronyms
- Appendix B – Industry Classification Code Reference – Full Series
- Appendix C – Production & Capacity Data Tables
- Appendix D – End-Use & Demand Base Tables
- Appendix E – Consumption & Replacement Rate Assumptions
- Appendix F – ASP Reference Tables
- Appendix G – Manufacturing & Facility Database
- Appendix H – Import-Export Data Tables
- Appendix I – Regulatory Summary Tables
- Appendix J – Primary Research Participant List (Anonymized)
- Appendix K – Primary Research Questionnaire Framework
- Appendix L – Data Sources & Bibliography
- Appendix M – Market Size Divergence & Source Comparison
Chapter 17. Research Methodology
- 17.1 Research Framework & Philosophy
- 17.2 Secondary Research – Sources, Hierarchy & Data Extraction
- 17.3 Data Modeling – Bottom-Up & Top-Down Market Sizing
- 17.4 Primary Research – Stakeholder Framework, LOI & Sample Sizes
- 17.5 Forecast Methodology – Regression, Scenario & Sensitivity Analysis
- 17.6 Quality Control – Four-Layer Validation Framework
- 17.7 Limitations & Standard Assumptions
- 17.8 Disclaimer
