
Market Overview
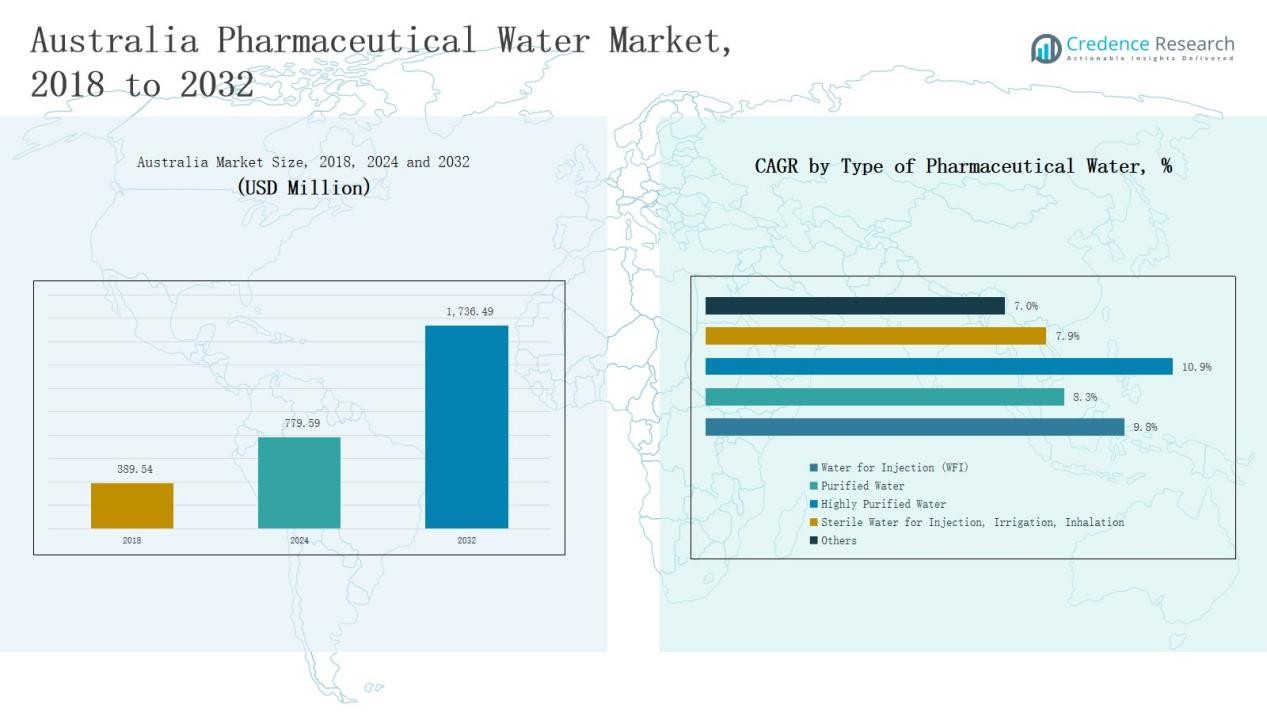
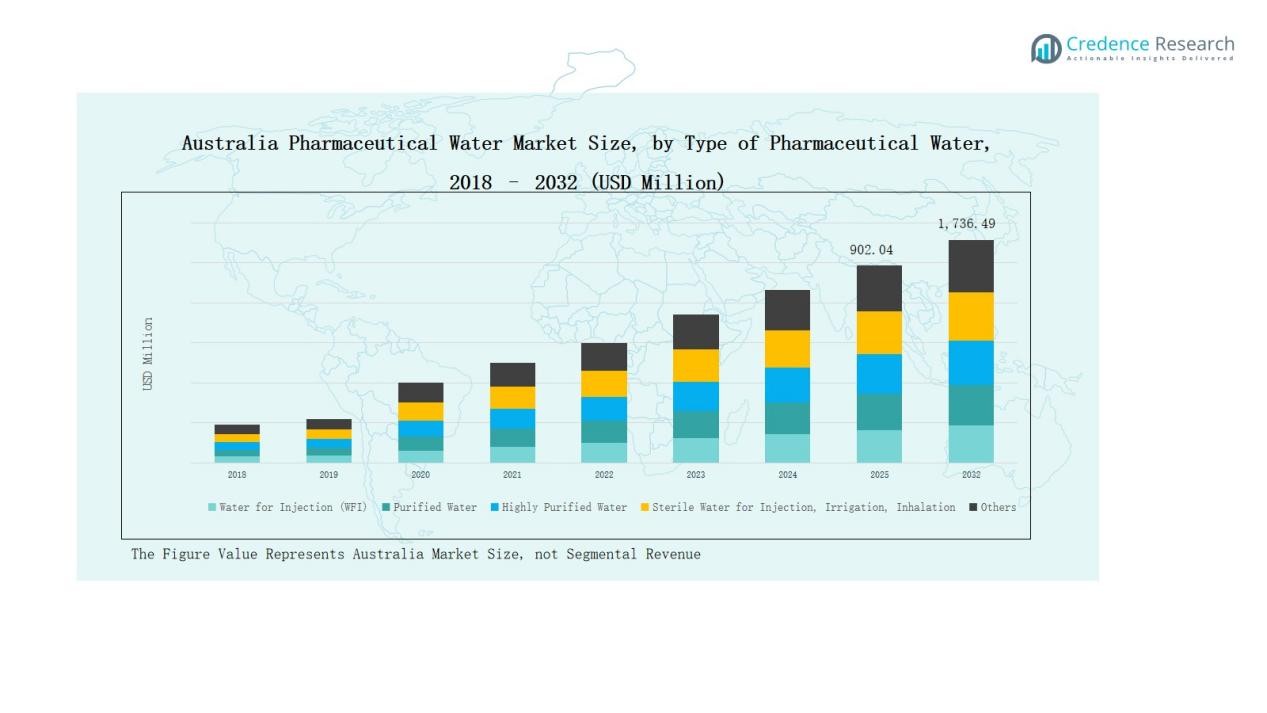
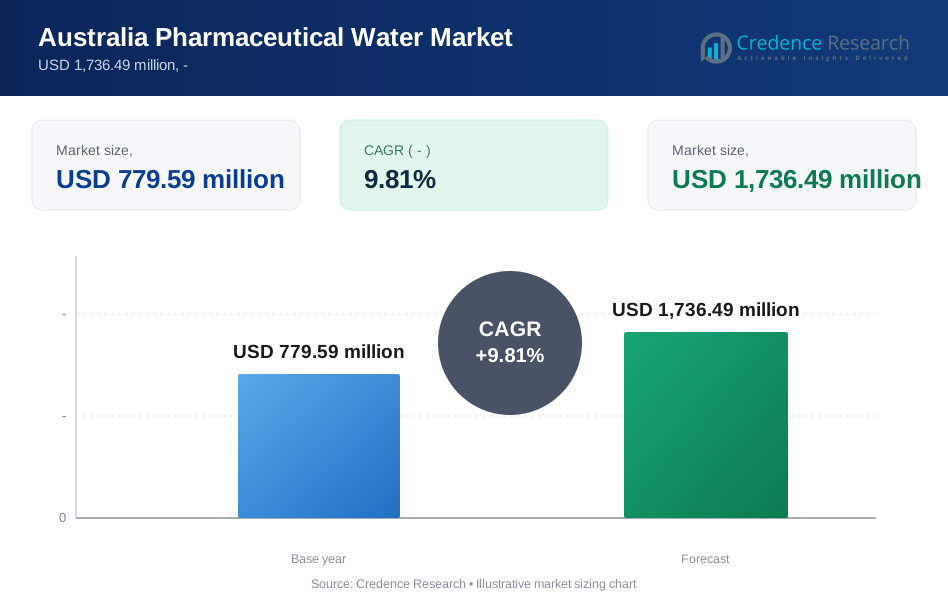
Australia Pharmaceutical Water Market size was valued at USD 389.54 million in 2018, grew to USD 779.59 million in 2024, and is anticipated to reach USD 1,736.49 million by 2032, expanding at a CAGR of 9.81% during the forecast period.
| REPORT ATTRIBUTE | DETAILS |
|---|---|
| Historical Period | 2020-2023 |
| Base Year | 2024 |
| Forecast Period | 2025-2032 |
| Australia Pharmaceutical Water Market Size 2024 | USD 779.59 Million |
| Australia Pharmaceutical Water Market, CAGR | 9.81% |
| Australia Pharmaceutical Water Market Size 2032 | USD 1,736.49 Million |
The Australia Pharmaceutical Water Market is led by prominent players such as Veolia Water Technologies Australia, Ecolab Australia, Danaher Corporation Australia, SUEZ Water Technologies & Solutions Australia, Aquatec Maxcon, GEL Group, Trility, ClearWater Solutions Australia, GE Water & Process Technologies Australia, and Evoqua Water Technologies Australia. These companies strengthen their market positions through advanced purification technologies, automation, and compliance-focused solutions that meet TGA and GMP standards. Their emphasis on innovation, sustainability, and digital water management supports efficient operations across pharmaceutical and biotechnology facilities. New South Wales emerged as the leading region in 2024, capturing a 33% market share, driven by strong industrial concentration, robust infrastructure, and continuous investment in high-purity water systems for pharmaceutical production and research applications.
Market Insights
- The Australia Pharmaceutical Water Market grew from USD 389.54 million in 2018 to USD 779.59 million in 2024 and is projected to reach USD 1,736.49 million by 2032, expanding at a CAGR of 9.81%.
- Water for Injection (WFI) led the market in 2024 with a 42% share, driven by its essential role in sterile drug manufacturing and increasing biologics production.
- Reverse Osmosis (RO) technology accounted for a 38% share due to its efficiency, reliability, and compliance with GMP standards in pharmaceutical purification processes.
- Pharmaceutical & Biotechnology Manufacturing dominated applications with a 55% share, supported by expanding vaccine and injectable production facilities across Australia.
- New South Wales led regionally with a 33% share in 2024, supported by strong pharmaceutical infrastructure, active R&D centers, and significant investment in advanced water purification systems.
Market Segment Insights
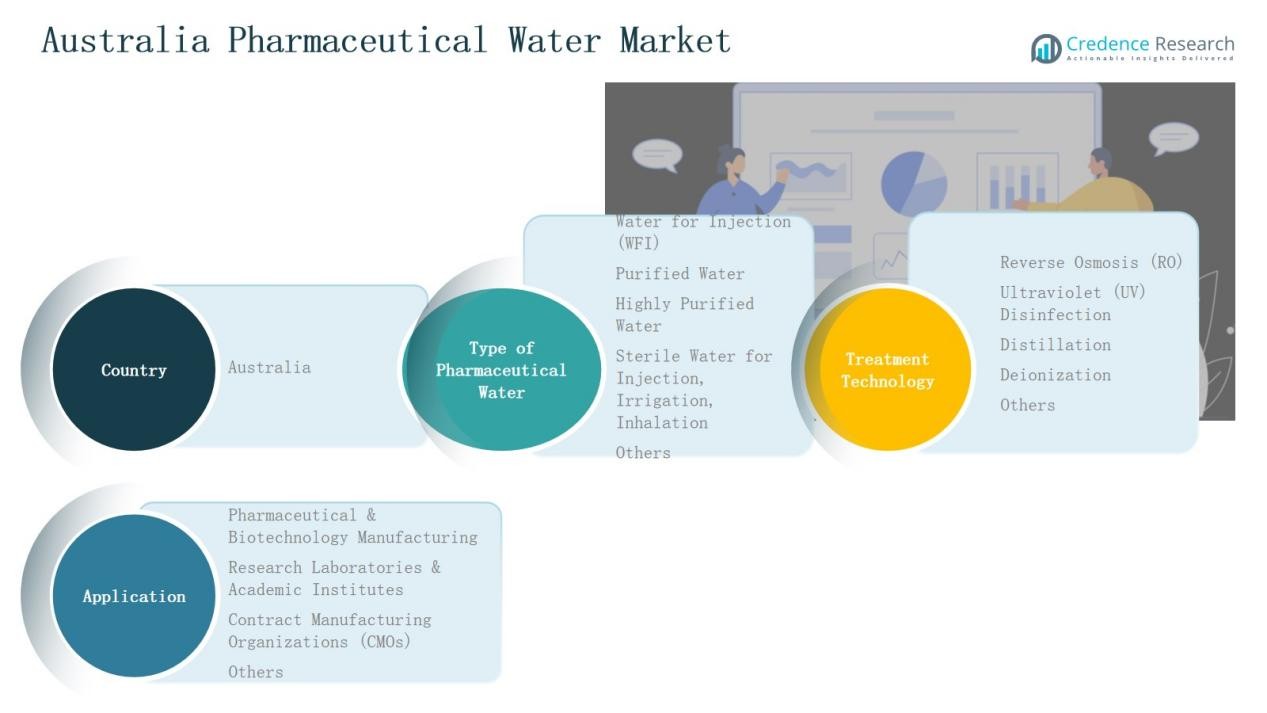
By Type of Pharmaceutical Water
Water for Injection (WFI) dominated the Australia Pharmaceutical Water Market in 2024 with a 42% share. The segment’s leadership stems from its critical use in parenteral drug manufacturing, sterile formulations, and biologics production. Strict quality standards by the TGA and growing demand for injectable medicines drive consistent investment in high-purity water systems. Rising biologics and vaccine production further strengthen WFI’s dominance in Australia’s pharmaceutical water infrastructure.
- For instance, Pfizer Australia upgraded its Melbourne plant during 2024, integrating high-purity water loops designed to meet TGA-grade WFI standards for injectable drug production.
By Treatment Technology
Reverse Osmosis (RO) held the largest share of 38% in 2024 within the Australia Pharmaceutical Water Market. RO systems are favored for their cost efficiency, high contaminant removal rate, and compliance with GMP standards. Widespread adoption in both purified and WFI systems enhances their utility across pharmaceutical plants. The demand for low-maintenance and energy-efficient water purification systems continues to strengthen RO’s market position.
- For instance, Veolia Water Technologies introduced its improved Orion RO system optimized for pharmaceutical-grade applications in Australia, offering enhanced energy recovery and membrane lifespan.
By Application
Pharmaceutical & Biotechnology Manufacturing accounted for a 55% share of the Australia Pharmaceutical Water Market in 2024. This segment leads due to the extensive need for purified and WFI-grade water in drug formulation, quality testing, and cleaning processes. Expansion of biologics, vaccines, and sterile injectables manufacturing boosts demand for advanced water systems. Rising R&D spending by pharmaceutical firms further sustains this segment’s dominance.
Key Growth Driver
Expanding Biopharmaceutical and Vaccine Production
Australia’s growing focus on biologics and vaccine manufacturing drives high demand for pharmaceutical-grade water. The expansion of domestic production facilities, especially after COVID-19, has increased the need for reliable Water for Injection (WFI) systems. Biopharmaceutical companies are investing in advanced purification technologies to meet stringent sterility standards. This surge in biologics manufacturing capacity continues to strengthen the country’s pharmaceutical water infrastructure and system upgrades.
- For instance, HRS Heat Exchangers supplied advanced cooling heat exchanger technology to one of Australia’s largest pharmaceutical manufacturers, enhancing WFI system efficiency in biopharmaceutical production environments.
Regulatory Emphasis on Water Quality Compliance
Strict regulatory standards set by the Therapeutic Goods Administration (TGA) and adherence to GMP norms support market growth. Pharmaceutical manufacturers must ensure consistent water purity for drug formulation, cleaning, and quality control. This compliance requirement encourages adoption of advanced treatment technologies such as reverse osmosis and distillation. Continuous audits and rising regulatory scrutiny further push companies to modernize existing water systems and validation processes.
- For instance, CSL Limited deployed an automated water quality monitoring system in its Broadmeadows site in late 2023 to meet GMP-compliant microbial control standards across its biopharmaceutical manufacturing lines.
Increasing Investments in Facility Modernization
Rising capital investments by domestic and multinational pharmaceutical firms are transforming production capabilities in Australia. Companies are upgrading old water treatment infrastructure with automated systems that ensure reliability and reduced operational risk. The integration of digital monitoring and predictive maintenance improves efficiency and minimizes downtime. These investments reflect a broader trend toward sustainable, compliant, and energy-efficient pharmaceutical water management solutions.
Key Trend & Opportunity
Adoption of Smart and Automated Water Systems
Automation and digitalization are reshaping pharmaceutical water operations in Australia. Smart systems that monitor conductivity, temperature, and microbial levels in real time help achieve consistent compliance. The integration of IoT and AI in water management allows predictive maintenance and reduced human error. This technological shift presents strong opportunities for suppliers offering intelligent control systems and cloud-based monitoring solutions.
- For instance, Hunter Water in New South Wales began piloting 500 advanced digital water meters in December 2024, providing real-time consumption data refreshed every 30 minutes to enhance leak detection and water management.
Growing Demand for Sustainable Water Treatment Solutions
Sustainability is becoming a strategic focus in the Australian pharmaceutical sector. Companies are investing in eco-efficient systems that minimize water wastage and energy use. The adoption of closed-loop purification and energy recovery technologies supports green manufacturing initiatives. Growing pressure to meet environmental standards creates new opportunities for vendors developing low-impact, sustainable water treatment solutions.
- For instance, Veolia installed an AnoxKaldnes® Moving Bed Biofilm Reactor system at AstraZeneca’s manufacturing site in Sweden, achieving 97% removal of total organic carbon and 99% phosphorus from wastewater.
Key Challenge
High Initial Capital and Maintenance Costs
The installation of advanced pharmaceutical water systems requires significant upfront investment and ongoing maintenance expenses. Many small and mid-sized manufacturers find it difficult to afford high-end purification setups. Costs related to validation, monitoring, and system upgrades further strain budgets. These financial barriers often delay modernization and limit adoption of advanced water treatment technologies.
Complex Regulatory and Validation Procedures
Compliance with TGA and international standards such as USP and EP involves complex documentation and testing. Continuous validation and system qualification processes increase administrative and operational load. Any deviation from required parameters can lead to production delays or penalties. Navigating these strict regulatory frameworks remains a persistent challenge for manufacturers in Australia.
Shortage of Skilled Technical Workforce
The pharmaceutical water industry in Australia faces a shortage of professionals trained in advanced purification technologies. Operation and maintenance of high-purity systems demand expertise in automation, microbiology, and validation protocols. Limited availability of skilled staff increases operational risks and maintenance errors. This workforce gap highlights the need for targeted technical training and capacity development in the sector.
Regional Analysis
New South Wales
New South Wales led the Australia Pharmaceutical Water Market in 2024 with a 33% share. The region’s dominance stems from a dense cluster of pharmaceutical and biotechnology manufacturing units across Sydney and nearby industrial zones. Strong government support for medical research and health innovation enhances infrastructure growth. Major production facilities rely on advanced water purification systems for compliance with GMP standards. Increasing expansion by multinational companies further boosts investment in high-purity water technologies. It remains the central hub for pharmaceutical production and regulatory compliance in Australia.
Victoria
Victoria accounted for a 28% share of the Australia Pharmaceutical Water Market in 2024. The state’s well-established pharmaceutical base in Melbourne drives significant adoption of Water for Injection (WFI) and purified water systems. Research institutions and academic laboratories contribute to continuous technological innovation in water treatment. Strong collaborations between public health agencies and private manufacturers promote capacity expansion. It continues to attract investments in sustainable and automated purification systems supporting advanced drug development.
Queensland
Queensland captured a 17% share in the Australia Pharmaceutical Water Market in 2024. Rapid growth in contract manufacturing organizations and medical research facilities strengthens the region’s demand for purified and sterile water systems. The Brisbane industrial corridor houses several production plants adopting digitalized water monitoring solutions. Government incentives for healthcare manufacturing promote infrastructure modernization. It shows steady expansion in pharmaceutical-grade water facilities aligned with environmental sustainability goals.
Western Australia
Western Australia held a 12% share in the Australia Pharmaceutical Water Market in 2024. The region’s growth is supported by increasing bioprocessing and sterile product manufacturing activities. Companies are upgrading treatment technologies to meet TGA quality requirements and ensure consistent purity. Water scarcity challenges encourage the use of energy-efficient purification systems. It benefits from rising investment in advanced utilities and pharmaceutical infrastructure.
South Australia and Others
South Australia, along with Tasmania and the Northern Territory, collectively accounted for a 10% share in 2024. The region’s pharmaceutical presence is smaller but steadily developing through niche manufacturing and research initiatives. New projects in medical devices and biopharma stimulate moderate demand for purified water systems. Collaboration between universities and technology suppliers fosters innovation in compact treatment units. It continues to witness gradual adoption of modern purification solutions to support local production and testing facilities.
Market Segmentations:
By Type of Pharmaceutical Water
- Water for Injection (WFI)
- Purified Water
- Highly Purified Water
- Sterile Water for Injection, Irrigation, Inhalation
- Others
By Treatment Technology
- Reverse Osmosis (RO)
- Ultraviolet (UV) Disinfection
- Distillation
- Deionization
- Others
By Application
- Pharmaceutical & Biotechnology Manufacturing
- Research Laboratories & Academic Institutes
- Contract Manufacturing Organizations (CMOs)
- Others
By Region
- New South Wales
- Victoria
- Queensland
- Western Australia
- South Australia
- Others
Competitive Landscape
The Australia Pharmaceutical Water Market features a moderately consolidated competitive landscape dominated by global and regional players specializing in advanced water treatment technologies. Leading companies such as Veolia Water Technologies Australia, Ecolab Australia, Danaher Corporation Australia, and SUEZ Water Technologies & Solutions Australia maintain strong market positions through extensive product portfolios, turnkey solutions, and regulatory compliance expertise. Local firms like Aquatec Maxcon, Trility, and GEL Group contribute through customized installations and efficient service networks. Competition centers on technology innovation, system reliability, and cost-effective maintenance contracts. Companies increasingly invest in automation, IoT-enabled monitoring, and energy-efficient purification systems to meet evolving TGA and GMP standards. Strategic partnerships with pharmaceutical manufacturers, combined with growing emphasis on sustainability and validation services, continue to shape the competitive environment. The market is expected to witness rising collaboration between technology providers and biopharma producers to ensure compliance, reduce operational costs, and enhance process water quality.
Key Players
- Veolia Water Technologies Australia
- Ecolab Australia
- Danaher Corporation Australia
- SUEZ Water Technologies & Solutions Australia
- Aquatec Maxcon
- GEL Group
- Trility
- ClearWater Solutions Australia
- GE Water & Process Technologies Australia
- Evoqua Water Technologies Australia
Recent Developments
- In July 2024, De.mem Limited completed the acquisition of Auswater Systems Pty Ltd.
- In March 2025, Centurion acquired WestWater Enterprises (Australia) to expand its water treatment capabilities.
- In August 2025, AxFlow acquired Advanced Pump Technologies Pty Ltd (APT Water) in Australia, gaining strength in fluid handling and filtration systems.
Report Coverage
The research report offers an in-depth analysis based on Type of Pharmaceutical Water, Treatment Technology, Application and Region. It details leading market players, providing an overview of their business, product offerings, investments, revenue streams, and key applications. Additionally, the report includes insights into the competitive environment, SWOT analysis, current market trends, as well as the primary drivers and constraints. Furthermore, it discusses various factors that have driven market expansion in recent years. The report also explores market dynamics, regulatory scenarios, and technological advancements that are shaping the industry. It assesses the impact of external factors and global economic changes on market growth. Lastly, it provides strategic recommendations for new entrants and established companies to navigate the complexities of the market.
Future Outlook
- Demand for high-purity water systems will increase with expanding biologics and vaccine production.
- Pharmaceutical companies will adopt automated monitoring to improve water quality control.
- Energy-efficient and sustainable purification systems will gain wider acceptance.
- Local manufacturers will upgrade infrastructure to meet stricter TGA and GMP standards.
- Partnerships between global technology providers and domestic firms will strengthen market capability.
- Investment in digital validation and real-time data tracking will improve compliance efficiency.
- Growth of contract manufacturing organizations will boost demand for modular water systems.
- Research institutes will drive innovation in compact and eco-friendly water treatment units.
- Training programs will expand to address the shortage of skilled water system operators.
- Increasing focus on sustainability will lead to adoption of closed-loop and low-waste purification models.
Request a Free Sample
Fill in your details and we'll send you a free sample report.
- Sample data tables & charts
- Research methodology
Need a Custom Version of This Report?
Tailor the scope, geography, or segments to your exact requirements.
- Custom geography or segment scope
- Direct access to our analyst team
Frequently Asked Questions
Which Australia Pharmaceutical Water Market segment held the largest share in 2024?
What are the primary factors fueling the growth of the Australia Pharmaceutical Water Market?
Who are the leading companies in the Australia Pharmaceutical Water Market?
Which region commanded the largest share of the Australia Pharmaceutical Water Market in 2024?
Table of Content
Chapter 1. Report Introduction
- 1.1 Report Description & Purpose
- 1.1.1 Report Title & Market Definition
- 1.1.2 Unique Selling Propositions (USP) & Key Differentiators
- 1.1.3 Value Proposition for Stakeholders
- 1.2 Research Objectives
- 1.2.1 Market Sizing Objectives (Volume & Revenue)
- 1.2.2 Segmentation Objectives
- 1.2.3 Competitive Intelligence Objectives
- 1.2.4 Forecast & Scenario Objectives
- 1.3 Report Scope
- 1.3.1 Australia Pharmaceutical Water Scope – Types & Subtypes Covered
- 1.3.2 Geographic Scope – Regions & Countries Covered
- 1.3.3 Historical Period, Base Year & Forecast Period (the historical period; forecast to the forecast period)
- 1.3.4 Inclusions & Exclusions
- 1.4 HS Code & Classification Framework
- 1.5 Currency, Units & Pricing Basis
- 1.6 Target Stakeholders
- 1.7 Limitations & Assumptions
Chapter 2. Executive Summary
- 2.1 Global Australia Pharmaceutical Water Market Snapshot
- 2.1.1 Market Size – Historical (the historical period) & Forecast (the forecast period) (base year: USD 779.59 million → forecast year: USD 1,736.49 million)
- 2.1.2 Volume & Revenue – Global Totals
- 2.1.3 Key Market Highlights – Top Five Facts
- 2.2 Australia Pharmaceutical Water Market Segmentation Snapshot
- 2.2.1 Market Split by Region – vs.
- 2.3 Competitive Snapshot
- 2.3.1 Top 10 Players by Revenue Share –
- 2.3.2 Top 10 Players by Volume Share –
- 2.3.3 Recent Strategic Developments (18-Month Summary)
- 2.4 Key Investment Highlights & Strategic Conclusions
Chapter 3. Australia Pharmaceutical Water Market Dynamics & Industry Analysis
- 3.1 Market Overview & Context
- 3.1.1 Australia Pharmaceutical Water Market Position in the Broader Automotive Value Chain
- 3.1.2 OEM vs. Replacement Market Dynamics
- 3.1.3 Market Maturity & Development Stage by Region
- 3.2 Australia Pharmaceutical Water Market Drivers
- 3.3 Australia Pharmaceutical Water Market Restraints & Challenges
- 3.4 Australia Pharmaceutical Water Market Opportunities
- 3.5 Porter's Five Forces Analysis
- 3.5.1 Threat of New Entrants
- 3.5.2 Bargaining Power of Suppliers
- 3.5.3 Bargaining Power of Buyers
- 3.5.4 Threat of Substitutes
- 3.5.5 Competitive Rivalry – Intensity Assessment
- 3.6 Australia Pharmaceutical Water Value Chain Analysis
- 3.6.1 Upstream – Raw Material/Input Suppliers
- 3.6.1.1 Raw Material/Input 1
- 3.6.1.2 Raw Material/Input 2
- 3.6.1.3 Raw Material/Input 3
- 3.6.2 Midstream – Production/Manufacturing/Service Delivery
- 3.6.2.1 Production/Process Overview
- 3.6.2.2 Key Facility Locations & Capacity by Manufacturer
- 3.6.3 Downstream – Distribution & End Consumer
- 3.6.3.1 Primary Channel – B2B/OEM
- 3.6.3.2 Secondary Channels – Dealer, Retail, Online, Direct
- 3.6.4 Value Chain Profitability Analysis
- 3.6.1 Upstream – Raw Material/Input Suppliers
- 3.7 PESTEL Analysis
- 3.7.1 Political Factors
- 3.7.2 Economic Factors
- 3.7.3 Social Factors
- 3.7.4 Technological Factors
- 3.7.5 Environmental Factors
- 3.7.6 Legal Factors
- 3.8 Australia Pharmaceutical Water Supply Chain Analysis
- 3.8.1 Raw Material/Input Supply Risk Assessment
- 3.8.2 Manufacturing Concentration Risk (Geographic Exposure)
- 3.8.3 Trade Disruption Impact Analysis
- 3.9 Regulatory & Policy Landscape
Note: The regulatory and policy landscape section covers regulations based on their applicability to the market, Australia Pharmaceutical Water category, geography, and scope of the study. Only regulatory frameworks with a material impact on operations, compliance, trade, sustainability, or market access are analyzed in detail.
Chapter 4. Key Investment Pockets & Opportunity Analysis
- 4.1 Australia Pharmaceutical Water Market Attractiveness Analysis
- 4.1.1 By Region – Investment Attractiveness Matrix (Volume × CAGR)
- 4.2 Absolute Revenue Growth Opportunity
- 4.2.1 By Region – Absolute USD Growth Through the forecast period
- 4.3 Incremental Volume Opportunity
- 4.3.1 By Region – Incremental Volume Through the forecast period
- 4.3.2 Segment – Incremental Volume
- 4.4 Emerging Submarket Opportunity Deep Dive (Subject to Applicability)
- 4.5 Emerging Market Opportunity Scorecards
- 4.5.1 United States
- 4.5.2 Europe
- 4.5.3 Asia
- 4.5.4 Middle East & Africa
Note: Emerging Market Opportunity Scorecards will be included based on relevance and strategic importance. Regions listed are indicative and may vary depending on data availability and market dynamics.
Chapter 5. Australia Pharmaceutical Water Import-Export Analysis & Trade Flows
- 5.1 Global Trade Overview
- 5.1.1 Global Export Value by Country (the historical period)
- 5.1.2 Global Export Volume by Country (the historical period)
- 5.1.3 Global Import Value by Country (the historical period)
- 5.1.4 Global Import Volume by Country (the historical period)
- 5.1.5 Net Trade Balance by Country (the historical period)
- 5.2 Export Analysis – Segment
- 5.2.1 Type 1 (HS Code)
- 5.2.2 Type 2 (HS Code)
- 5.2.3 Type 3 (HS Code)
- 5.2.4 Type 4 (HS Code)
- 5.2.5 Type 5 (HS Code)
- 5.3 Import Analysis – Segment
- 5.3.1 Type 1 (HS Code)
- 5.3.2 Type 2 (HS Code)
- 5.3.3 Type 3 (HS Code)
- 5.3.4 Type 4 (HS Code)
- 5.3.5 Type 5 (HS Code)
- 5.4 Average Unit Trade Prices
- 5.4.1 Average Export Price – Segment & Country
- 5.4.2 Average Import Price – Segment & Source Country
- 5.4.3 Price Trends (the historical period)
- 5.5 Key Trade Route Analysis
- 5.5.1 Trade Route 1
- 5.5.2 Trade Route 2
- 5.5.3 Trade Route 3
- 5.5.4 Trade Route 4
- 5.5.5 Trade Route 5
- 5.6 Trade Policy Impact Assessment
- 5.6.1 US Anti-Dumping & Section 301 Tariffs
- 5.6.2 EU Customs Union Impact
- 5.6.3 Major Free Trade Agreements
- 5.6.4 USMCA Rules of Origin
Note: Trade policy analysis will be included only where relevant to the Australia Pharmaceutical Water market.
Chapter 6. Competitive Landscape & Company Benchmarking
- 6.1 Australia Pharmaceutical Water Market Concentration & Structure
- 6.1.1 Herfindahl-Hirschman Index (HHI) – vs.
- 6.1.2 Tier 1, Tier 2 & Tier 3 Market Structure
- 6.1.3 Global, Regional & Local Player Dynamics
- 6.2 Australia Pharmaceutical Water Market Share Analysis –
- 6.2.1 Global Revenue Share by Company
- 6.2.2 Global Volume Share by Company
- 6.2.3 Regional Revenue Share
- 6.2.4 Market Share Evolution ( vs. )
- 6.2.5 OEM Segment Share by Company
- 6.2.6 Replacement Segment Share by Company
- 6.3 Production/Delivery Capacity & Facility Analysis
- 6.3.1 Global Installed Capacity
- 6.3.2 Capacity Utilization Rates
- 6.3.3 Production/Output Volume
- 6.3.4 Facility Locations & Capacity Map
- 6.3.5 Planned Capacity Additions
- 6.4 Australia Pharmaceutical Water Competitive Benchmarking Matrix
- 6.4.1 Revenue, Volume, CAGR & Profitability Comparison
- 6.4.2 Channel Revenue Mix
- 6.4.3 Geographic Revenue Exposure
- 6.4.4 R&D Intensity
- 6.4.5 Sustainability Maturity
- 6.5 Strategic Developments in Australia Pharmaceutical Water (Last 24 Months)
- 6.5.1 Mergers, Acquisitions & Divestments
- 6.5.2 New Australia Pharmaceutical Water Launches
- 6.5.3 Facility Expansions
- 6.5.4 Strategic Alliances, Joint Ventures & Partnerships
- 6.5.5 Distribution Expansion & Market Entry
- 6.5.6 Sustainability & ESG Initiatives
- 6.6 Competitive Strategy Mapping
- 6.6.1 Leader, Challenger, Follower & Niche Classification
- 6.6.2 Pricing Strategy Comparison
- 6.6.3 Channel Strategy Matrix
Note: Strategic developments are included based on their materiality and the availability of reliable information.
Chapter 7. Global Australia Pharmaceutical Water Market – By Distribution Channel
- 7.1 Segment Overview
- 7.1.1 Volume & Revenue Split by Channel ( & )
- 7.1.2 Channel Mix Evolution (the forecast period)
Chapter 8. Regional Market Analysis – Global Overview
- 8.1 Global Regional Overview
- 8.1.1 Regional Volume Share
- 8.1.2 Regional Revenue Share
- 8.1.3 Regional Volume by Region
- 8.1.4 Regional Revenue by Region
- 8.1.5 Regional Forecast Through the forecast period
- 8.2 Cross-Regional Segment Analysis
- 8.2.1 By Distribution Channel
- 8.2.2 By Brand/Price Tier
Chapter 9. North America Australia Pharmaceutical Water Market
- 9.1 United States
- 9.2 Canada
- 9.3 Mexico
Chapter 10. Europe Australia Pharmaceutical Water Market
- 10.1 Germany
- 10.2 France
- 10.3 Italy
- 10.4 United Kingdom
- 10.5 Spain
- 10.6 Poland
- 10.7 Russia
- 10.8 Netherlands
- 10.9 Belgium
- 10.10 Sweden
- 10.11 Denmark
- 10.12 Norway
- 10.13 Rest of Europe
Chapter 11. Asia Pacific Australia Pharmaceutical Water Market
- 11.1 China
- 11.2 India
- 11.3 Japan
- 11.4 South Korea
- 11.5 Thailand
- 11.6 Indonesia
- 11.7 Vietnam
- 11.8 Malaysia
- 11.9 Australia
- 11.10 Rest of Asia Pacific
Chapter 12. Latin America Australia Pharmaceutical Water Market
- 12.1 Brazil
- 12.2 Argentina
- 12.3 Colombia
- 12.4 Chile
- 12.5 Rest of Latin America
Chapter 13. Middle East Australia Pharmaceutical Water Market
- 13.1 Saudi Arabia
- 13.2 United Arab Emirates
- 13.3 Turkey
- 13.4 Israel
- 13.5 Iran
- 13.6 Rest of the Middle East
Chapter 14. Africa Australia Pharmaceutical Water Market
- 14.1 South Africa
- 14.2 Egypt
- 14.3 Nigeria
- 14.4 Morocco
- 14.5 Rest of Africa
Chapter 15. Australia Pharmaceutical Water Company Profiles
- 15.1 [Company 01]
- 15.1.1 Company Overview
- 15.1.2 Key Management Personnel
- 15.1.3 Products & Services Portfolio
- 15.1.4 Financial Performance
- 15.1.5 Key Market Focus & Geographic Presence
- 15.1.6 Recent Developments & Strategic Initiatives
Note: The company profile list is preliminary and may change based on research findings, market developments, data availability, and client requirements.
Chapter 16. Appendices
- Appendix A – List of Abbreviations & Acronyms
- Appendix B – Industry Classification Code Reference – Full Series
- Appendix C – Production & Capacity Data Tables
- Appendix D – End-Use & Demand Base Tables
- Appendix E – Consumption & Replacement Rate Assumptions
- Appendix F – ASP Reference Tables
- Appendix G – Manufacturing & Facility Database
- Appendix H – Import-Export Data Tables
- Appendix I – Regulatory Summary Tables
- Appendix J – Primary Research Participant List (Anonymized)
- Appendix K – Primary Research Questionnaire Framework
- Appendix L – Data Sources & Bibliography
- Appendix M – Market Size Divergence & Source Comparison
Chapter 17. Research Methodology
- 17.1 Research Framework & Philosophy
- 17.2 Secondary Research – Sources, Hierarchy & Data Extraction
- 17.3 Data Modeling – Bottom-Up & Top-Down Market Sizing
- 17.4 Primary Research – Stakeholder Framework, LOI & Sample Sizes
- 17.5 Forecast Methodology – Regression, Scenario & Sensitivity Analysis
- 17.6 Quality Control – Four-Layer Validation Framework
- 17.7 Limitations & Standard Assumptions
- 17.8 Disclaimer
