
Biosimulation Market Overview
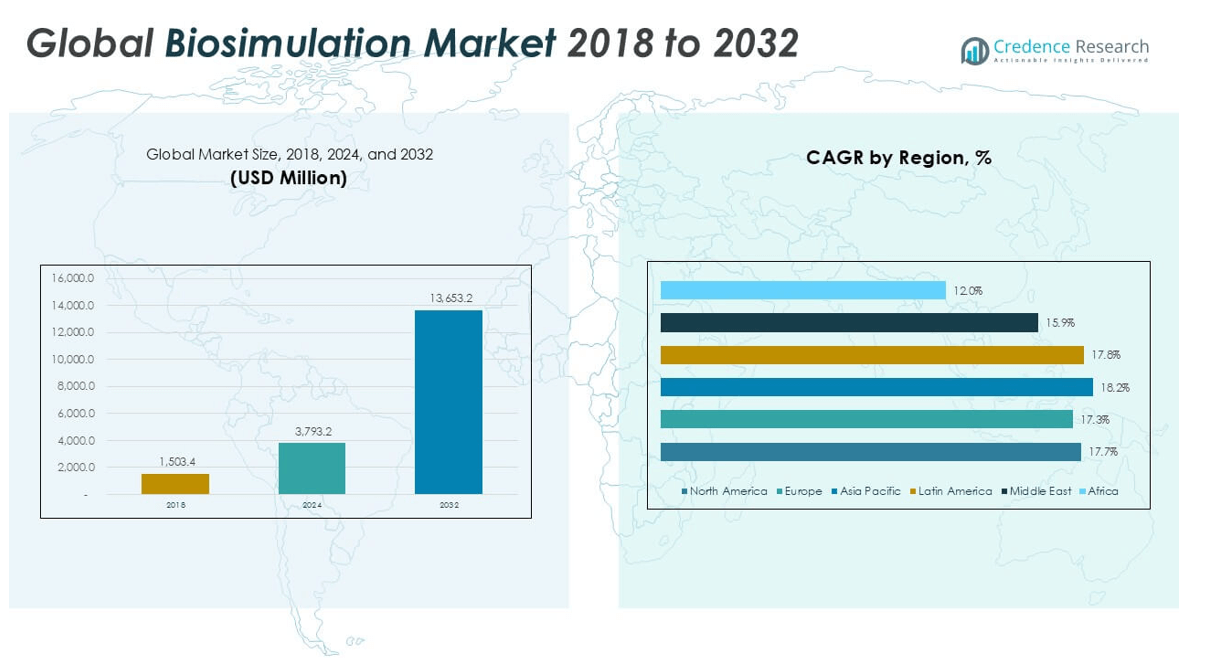
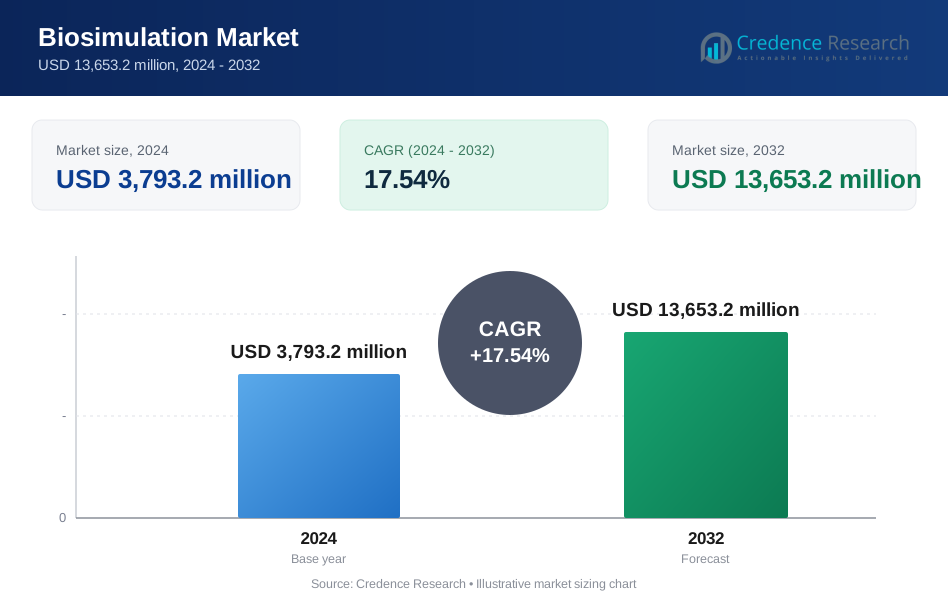
The biosimulation market size was valued at USD 1,503.4 million in 2018, increased to USD 3,793.2 million in 2024, and is anticipated to reach USD 13,653.2 million by 2032, at a CAGR of 17.54% during the forecast period.
| REPORT ATTRIBUTE | DETAILS |
|---|---|
| Historical Period | 2020-2023 |
| Base Year | 2024 |
| Forecast Period | 2025-2032 |
| Biosimulation Market Size 2024 | USD 3,793.2 million |
| Biosimulation Market, CAGR | 17.54% |
| Biosimulation Market Size 2032 | USD 13,653.2 million |
The biosimulation market is led by prominent players such as Dassault Systèmes SA, Schrodinger Inc., Advanced Chemistry Development Inc., and Chemical Computing Group Inc., all of which offer comprehensive software solutions for drug discovery and development. These companies are at the forefront of innovation, leveraging advanced modeling techniques and expanding their global presence through strategic collaborations and acquisitions. Other notable contributors include Physiomics PLC, Entelos Inc., and Genedata AG, which specialize in systems pharmacology and disease modeling. Regionally, North America dominates the market with a 35.5% share in 2024, supported by robust pharmaceutical R&D, regulatory support for model-informed drug development, and early adoption of simulation technologies. Europe follows closely with a 29.0% share, driven by strong biotech infrastructure and collaborative research initiatives.
Biosimulation Market Insights
- The biosimulation market was valued at USD 3,793.2 million in 2024 and is projected to reach USD 13,653.2 million by 2032, growing at a CAGR of 17.54% during the forecast period.
- Rising demand for cost-effective and accelerated drug development is a key driver, with biosimulation helping reduce clinical trial failures and optimize dosing strategies across preclinical and clinical stages.
- A growing trend is the integration of AI and cloud computing in biosimulation platforms, enhancing predictive accuracy and enabling real-time collaboration across global R&D teams.
- Leading players such as Dassault Systèmes, Schrodinger Inc., and Advanced Chemistry Development Inc. dominate through robust product portfolios, while niche firms focus on disease-specific modeling; software holds the largest segment share.
- North America leads with a 35.5% share, followed by Europe at 29.0% and Asia Pacific at 22.6%; adoption in Latin America, the Middle East, and Africa remains moderate due to infrastructure and cost-related restraints.
Biosimulation Market Segmentation Analysis:
By Product
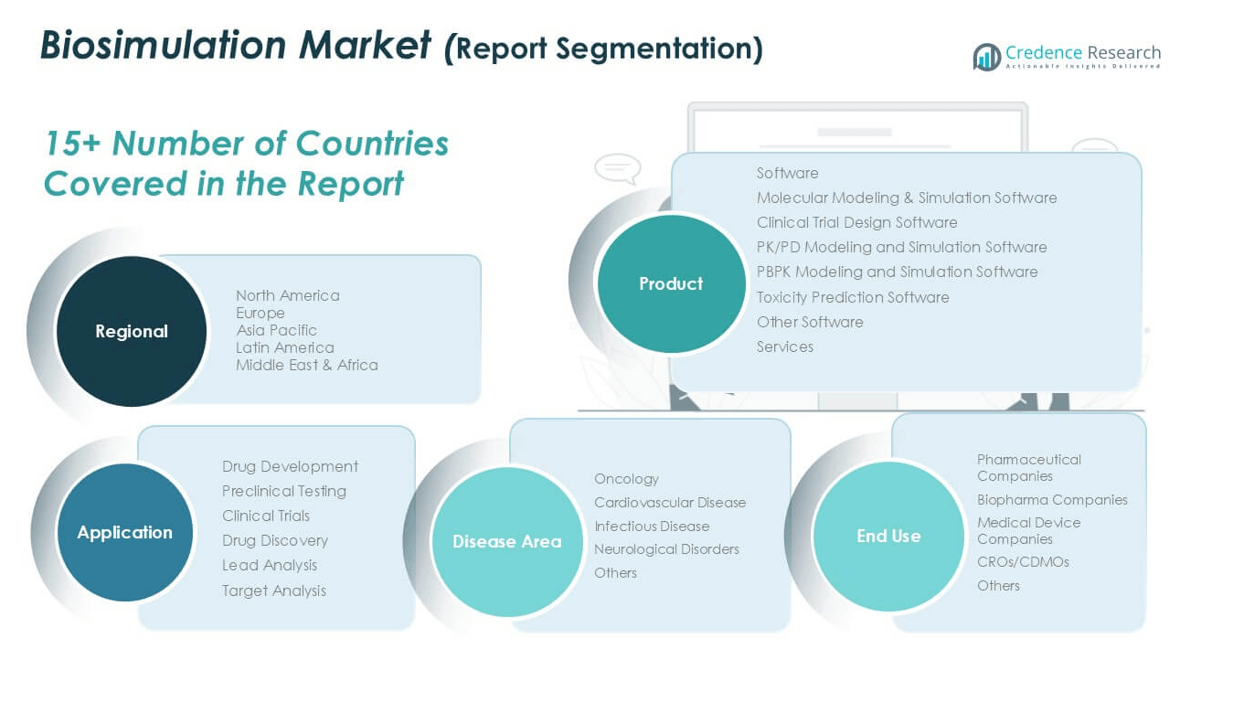
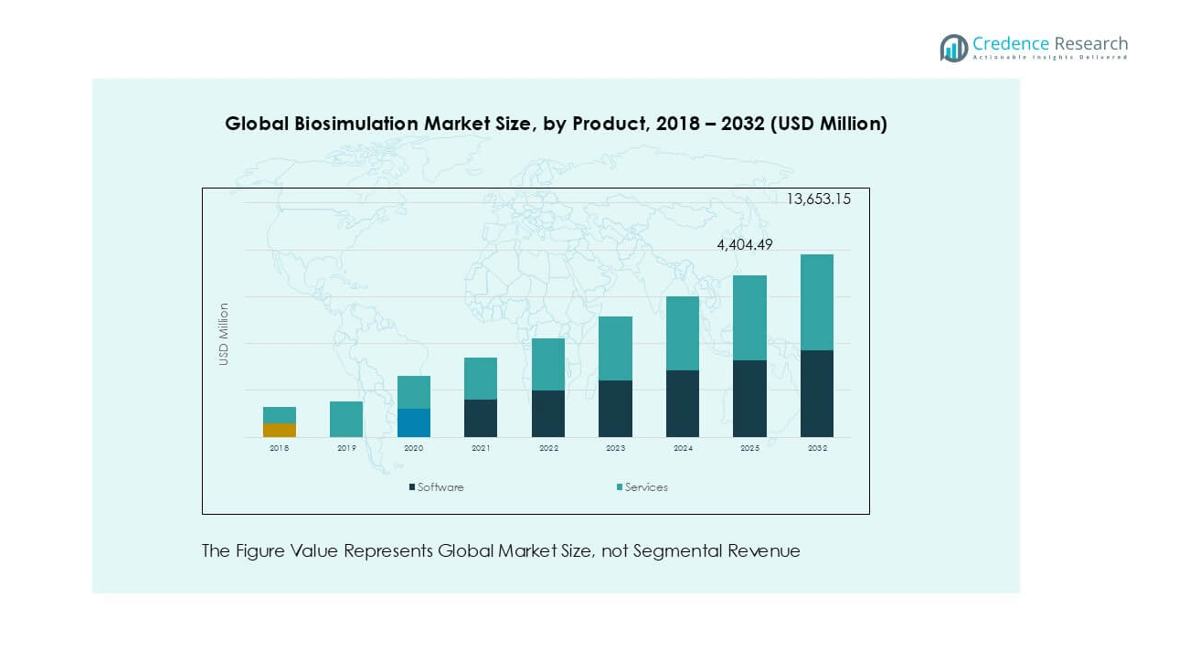
In the biosimulation market, software holds the dominant share, driven by the growing adoption of simulation tools in pharmaceutical R&D. Among the sub-segments, PK/PD modeling and simulation software leads the market, accounting for the largest revenue share due to its crucial role in analyzing pharmacokinetic and pharmacodynamic interactions during drug development. The demand for this software continues to grow as it helps reduce late-stage drug failure rates and optimize dosing strategies. Services, while gaining momentum, trail behind software, as most stakeholders prioritize advanced tools for internal modeling over outsourcing.
- For instance, Schrodinger Inc.'s platform supported over 100 active collaborations in 2023, with its physics-based simulation software contributing to more than 20 preclinical drug candidates entering development pipelines.
By Application
Drug development is the leading application segment in the biosimulation market, with a dominant share attributed to its significant role in enhancing the efficiency and accuracy of both preclinical testing and clinical trials. Within this segment, preclinical testing is the most prominent sub-segment, as biosimulation allows researchers to evaluate drug safety and efficacy early in development. This reduces reliance on animal models and speeds up regulatory submission processes. The drug discovery segment, including lead analysis and target analysis, is growing steadily, supported by the integration of AI and big data in identifying viable compounds.
- For instance, Dassault Systèmes’ BIOVIA platform enabled the acceleration of over 30 drug development programs in 2023 by integrating biosimulation with virtual design workflows in both discovery and preclinical phases.
By Disease Area
Oncology represents the dominant disease area segment in the biosimulation market, driven by the complexity of cancer treatment development and the high failure rate of oncology drugs in clinical trials. Biosimulation tools are extensively used to predict tumor response, optimize dosing regimens, and simulate patient variability. The oncology segment holds the largest market share due to the high volume of oncology trials and the demand for precision medicine. Other disease areas such as cardiovascular, infectious diseases, and neurological disorders also contribute to market growth, but at a slower pace compared to oncology.
Biosimulation Market Overview
Rising Demand for Cost-Effective Drug Development
Pharmaceutical and biopharmaceutical companies are increasingly adopting biosimulation to reduce the high costs associated with traditional drug development. By enabling virtual trials and predictive modeling, biosimulation significantly minimizes the need for physical testing and costly clinical failures. It allows researchers to optimize candidate selection, dosing, and study design early in development. This approach accelerates time-to-market and improves R&D productivity, making it a financially viable solution for companies facing budget constraints and strict regulatory timelines.
- For instance, Physiomics PLC's Virtual Tumour technology was used in over 40 client projects by 2023, helping reduce Phase I/II trial design costs and timelines for oncology drugs by measurable months.
Regulatory Support for Model-Informed Drug Development (MIDD)
Global regulatory bodies such as the U.S. FDA and EMA have recognized and promoted model-informed drug development as a strategic tool to improve decision-making and streamline approval processes. Regulatory support has legitimized the use of biosimulation for clinical trial design, dose selection, and risk assessment, driving its adoption across drug developers. This regulatory encouragement has increased the integration of biosimulation software and services into official submission dossiers, reinforcing its role as a critical asset in the pharmaceutical development pipeline.
- For instance, Simcyp Simulator from Certara was cited in over 250 regulatory submissions and 30+ product labels approved by the FDA and EMA by the end of 2023, demonstrating compliance with MIDD frameworks.
Technological Advancements in Simulation Tools
The market is witnessing significant innovation in biosimulation technologies, including improvements in computational power, machine learning integration, and user-friendly interfaces. Advanced tools can now simulate complex biological systems with higher accuracy and scalability. For example, the incorporation of AI allows for faster hypothesis testing and deeper insights into drug interactions and patient variability. These technological advancements are broadening the applicability of biosimulation across drug discovery, development, and toxicity prediction, thereby enhancing its value across the life sciences industry.
Key Trends & Opportunities
Expansion of Biosimulation in Personalized Medicine
Biosimulation is increasingly being used to support the development of personalized medicine by enabling patient-specific modeling and simulation. It allows researchers to simulate individual responses based on genetic, physiological, and disease-specific parameters. This trend is particularly impactful in oncology and rare diseases, where variability in treatment response is significant. The ability to tailor therapies based on virtual patient profiles not only improves clinical outcomes but also presents a lucrative opportunity for solution providers in the biosimulation space.
- For instance, Genedata’s platforms supported personalized drug profiling in over 70 oncology trials during 2023, integrating multi-omic patient data with predictive biosimulation models.
Growth in Outsourcing to CROs and CDMOs
As pharmaceutical companies look to streamline operations, the outsourcing of biosimulation tasks to Contract Research Organizations (CROs) and Contract Development and Manufacturing Organizations (CDMOs) is on the rise. These third-party providers offer specialized simulation services with advanced infrastructure and expertise, reducing internal resource strain. The growing complexity of drug development pipelines and increased demand for fast-track regulatory approvals are further driving partnerships with CROs/CDMOs, opening up new business avenues for biosimulation service providers.
- For instance, PPD Inc. conducted over 500 modeling and simulation projects across therapeutic areas in 2023, with 120 involving regulatory filing support for global biopharma clients.
Integration of AI and Cloud Computing
The integration of artificial intelligence and cloud platforms is transforming the biosimulation landscape. AI accelerates data analysis, enhances predictive accuracy, and enables adaptive modeling. Meanwhile, cloud computing provides scalability, improved collaboration, and real-time access to simulation platforms. These technologies facilitate multi-center research collaborations and allow continuous updates and improvements in software. The convergence of these digital technologies represents a major opportunity for innovation and broader market penetration.
Key Challenges
Data Standardization and Model Validation Issues
One of the core challenges facing the biosimulation market is the lack of standardized data formats and model validation protocols. Variability in data sources and modeling approaches often leads to inconsistencies in simulation outcomes. This hampers the comparability of results and reduces confidence among regulatory bodies and end-users. Without harmonized standards, scaling biosimulation across global pipelines remains a technical and operational challenge, limiting its full potential in regulated environments.
Limited Expertise and Skill Shortage
Despite growing demand, there is a significant shortage of skilled professionals proficient in biosimulation techniques, tools, and regulatory requirements. The field requires expertise in pharmacokinetics, computational modeling, and regulatory science, making it difficult for companies to build capable in-house teams. This skill gap particularly affects small and mid-sized firms that may lack the resources to attract or train specialized talent, thereby slowing adoption and innovation across the industry.
High Implementation Costs for Advanced Solutions
While biosimulation reduces long-term drug development costs, the initial investment in advanced software, hardware, and skilled personnel can be substantial. High setup costs act as a barrier for emerging biopharma companies and academic research institutions. Licensing fees, customization requirements, and continuous updates further increase operational expenses. This financial burden limits market penetration, especially in low- and middle-income countries, where budget constraints hinder the adoption of cutting-edge simulation technologies.
Regional Analysis
North America
North America leads the biosimulation market, valued at USD 529.48 million in 2018 and rising to USD 1,345.09 million in 2024, with a projected reach of USD 4,885.10 million by 2032, growing at a CAGR of 17.7%. The region holds the largest market share of approximately 35.5% in 2024, supported by strong R&D investments, presence of major pharmaceutical firms, and regulatory backing for model-informed drug development. High adoption of advanced simulation tools and increasing use of biosimulation in clinical trials continue to drive regional growth.
Europe
Europe is the second-largest regional market, growing from USD 439.43 million in 2018 to USD 1,097.87 million in 2024, and is expected to reach USD 3,899.34 million by 2032, with a CAGR of 17.3%. The region commands a market share of approximately 29.0% in 2024, driven by rising investments in biotech innovation, regulatory harmonization, and growing acceptance of biosimulation in drug development. Key countries such as Germany, the UK, and France are major contributors to regional growth, supported by strong academic and clinical research infrastructures.
Asia Pacific
Asia Pacific shows the fastest growth, expanding from USD 329.09 million in 2018 to USD 859.28 million in 2024, and is projected to reach USD 3,231.70 million by 2032, recording a CAGR of 18.2%. The region captures around 22.6% market share in 2024, fueled by the expanding pharmaceutical sector, rising clinical trial activity, and increasing government support for healthcare innovation. Countries like China, India, and Japan are key growth hubs due to improved regulatory frameworks and increased outsourcing of biosimulation services.
Latin America
Latin America’s biosimulation market was valued at USD 112.00 million in 2018, grew to USD 286.17 million in 2024, and is forecast to reach USD 1,047.20 million by 2032, growing at a CAGR of 17.8%. The region holds a market share of approximately 7.6% in 2024, with growth attributed to rising investments in life sciences and expanding clinical research infrastructure in countries like Brazil and Mexico. Although adoption is at an early stage, increasing collaborations with global pharmaceutical firms are driving market momentum.
Middle East
The Middle East market reached USD 48.56 million in 2018, grew to USD 113.42 million in 2024, and is anticipated to reach USD 364.54 million by 2032, advancing at a CAGR of 15.9%. It holds a market share of approximately 3.0% in 2024, with growth supported by increasing healthcare digitization and government-led pharmaceutical R&D initiatives, especially in the UAE and Saudi Arabia. While adoption of biosimulation remains limited compared to developed regions, the focus on high-tech healthcare infrastructure is expected to support gradual growth.
Africa
Africa’s biosimulation market was valued at USD 44.80 million in 2018, rose to USD 91.42 million in 2024, and is projected to reach USD 225.28 million by 2032, reflecting a CAGR of 12.0%. It accounts for the smallest market share of approximately 2.4% in 2024, constrained by limited access to advanced technologies and weak R&D ecosystems. However, growing interest in clinical trials and increased foreign investment in African healthcare systems may gradually boost biosimulation adoption, particularly in South Africa and Nigeria.
Biosimulation Market Segmentations:
By Product
- Software
- Molecular Modeling & Simulation Software
- Clinical Trial Design Software
- PK/PD Modeling and Simulation Software
- PBPK Modeling and Simulation Software
- Toxicity Prediction Software
- Other Software
- Services
By Application
- Drug Development
- Preclinical Testing
- Clinical Trials
- Drug Discovery
- Lead Analysis
- Target Analysis
By Disease Area
- Oncology
- Cardiovascular Disease
- Infectious Disease
- Neurological Disorders
- Others
By End User
- Pharmaceutical Companies
- Biopharma Companies
- Medical Device Companies
- CROs/CDMOs (Contract Research Organizations/Contract Development and Manufacturing Organizations)
- Others
By Geography
- North America
- U.S.
- Canada
- Mexico
- Europe
- Germany
- France
- U.K.
- Italy
- Spain
- Rest of Europe
- Asia Pacific
- China
- Japan
- India
- South Korea
- South-east Asia
- Rest of Asia Pacific
- Latin America
- Brazil
- Argentina
- Rest of Latin America
- Middle East & Africa
- GCC Countries
- South Africa
- Rest of the Middle East and Afri
Competitive Landscape
The biosimulation market features a competitive landscape marked by the presence of established players and emerging innovators striving to enhance predictive modeling capabilities in drug development. Key companies such as Dassault Systèmes SA, Schrodinger Inc., and Advanced Chemistry Development Inc. lead the market through strong software portfolios, strategic collaborations, and consistent R&D investments. These firms offer advanced simulation platforms supporting molecular modeling, PK/PD analysis, and toxicity prediction. Mid-tier players like Physiomics PLC, Entelos Inc., and Rhenovia Pharma Ltd contribute niche expertise in systems biology and disease modeling. The market also includes service-oriented providers such as PPD Inc. and Instem Group, which support pharmaceutical clients with integrated biosimulation services. Mergers, acquisitions, and partnerships remain central to competitive strategies, allowing firms to broaden their technological reach and global presence. The increasing demand for AI integration and personalized medicine is driving innovation, prompting both large and small companies to invest in scalable, cloud-enabled biosimulation solutions.
Key Player Analysis
- Dassault Systèmes SA
- Schrodinger, Inc.
- Advanced Chemistry Development, Inc.
- Chemical Computing Group, Inc.
- Physiomics PLC
- Entelos, Inc.
- Rhenovia Pharma Ltd
- Genedata AG
- Instem Group of Companies
- PPD, Inc.
Recent Developments
- In October 2024, Certara acquired ChemAxon, a leading provider of cheminformatics software. This acquisition helped Certara enhance its drug discovery and development capabilities by integrating ChemAxon's advanced molecular modeling and data analysis tools.
- In September 2024, Certara partnered with Ichnos Glenmark Innovation (IGI) to optimize the dosing strategy for a potential first-in-class cancer drug. This collaboration leverages Certara's modeling and simulation expertise to enhance the drug's development process, aiming to improve patient outcomes and streamline clinical trials.
- In August 2024, Certara launched Phoenix version 8.5, a software for pharmacokinetic/pharmacodynamic (PK/PD) and toxicokinetic modeling.
- In June 2024, Simulations Plus acquired Pro-ficiency. By this acquisition, Simulation Plus is likely to integrate Pro-ficiency's innovative software solutions with its existing capabilities, creating a novel platform designed to streamline and optimize the drug development process.
- In December 2023, Certara acquired Applied Biomath, a leader in model-informed drug discovery, aiding Certara to expand its biosimulation portfolio.
- In November 2023, Certara launched Simcyp Biopharmaceutics software to enhance the efficiency of novel and generic drug formulation development.
Market Concentration & Characteristics
The Biosimulation Market exhibits a moderately concentrated structure, with a mix of global software providers, niche technology firms, and service-oriented players driving innovation. It is characterized by high entry barriers due to the need for specialized expertise, regulatory understanding, and advanced computational capabilities. The market is dominated by a few key players such as Dassault Systèmes, Schrodinger Inc., and Advanced Chemistry Development Inc., which collectively hold a significant share due to their comprehensive platforms and long-standing industry presence. It demonstrates a strong reliance on software, which accounts for the largest segment share, reflecting the increasing adoption of simulation tools in early drug development stages. Services are gaining traction but remain secondary. The market benefits from long-term partnerships between pharmaceutical companies and biosimulation solution providers. It shows a high degree of technical differentiation, with competitive advantage often determined by the accuracy, scalability, and regulatory compliance of the offered solutions. Emerging markets present growth opportunities but face infrastructure and cost constraints.
Report Coverage
The research report offers an in-depth analysis based on Product, Application, Disease Area, End User and Geography. It details leading market players, providing an overview of their business, product offerings, investments, revenue streams, and key applications. Additionally, the report includes insights into the competitive environment, SWOT analysis, current market trends, as well as the primary drivers and constraints. Furthermore, it discusses various factors that have driven market expansion in recent years. The report also explores market dynamics, regulatory scenarios, and technological advancements that are shaping the industry. It assesses the impact of external factors and global economic changes on market growth. Lastly, it provides strategic recommendations for new entrants and established companies to navigate the complexities of the market.
Future Outlook
- The market will expand rapidly with increasing adoption of biosimulation in early-stage drug development.
- Regulatory agencies will continue to support model-informed drug development practices globally.
- Integration of artificial intelligence will enhance prediction accuracy and speed of simulation platforms.
- Cloud-based biosimulation tools will enable wider access and collaboration across research teams.
- Personalized medicine will drive demand for patient-specific simulation and virtual trials.
- Pharmaceutical companies will increase outsourcing of simulation services to CROs and CDMOs.
- Emerging economies will see growing adoption supported by improving R&D infrastructure.
- Investment in advanced pharmacokinetic and pharmacodynamic modeling tools will rise.
- Strategic partnerships and acquisitions will shape competitive dynamics in the market.
- Demand for cross-functional talent in biology, data science, and software engineering will increase.
Request a Free Sample
Fill in your details and we'll send you a free sample report.
- Sample data tables & charts
- Research methodology
Need a Custom Version of This Report?
Tailor the scope, geography, or segments to your exact requirements.
- Custom geography or segment scope
- Direct access to our analyst team
Frequently Asked Questions
What is the current market size for Biosimulation, and what is its projected size in 2032?
Which Biosimulation market segment held the largest share in 2024
Who are the leading companies in the Biosimulation market?
Which region commanded the largest share of the Biosimulation market in 2024?
Table of Content
Chapter 1. Report Introduction
- 1.1 Report Description & Purpose
- 1.1.1 Report Title & Market Definition
- 1.1.2 Unique Selling Propositions (USP) & Key Differentiators
- 1.1.3 Value Proposition for Stakeholders
- 1.2 Research Objectives
- 1.2.1 Market Sizing Objectives (Volume & Revenue)
- 1.2.2 Segmentation Objectives
- 1.2.3 Competitive Intelligence Objectives
- 1.2.4 Forecast & Scenario Objectives
- 1.3 Report Scope
- 1.3.1 Biosimulation Scope – Types & Subtypes Covered
- 1.3.2 Geographic Scope – Regions & Countries Covered
- 1.3.3 Historical Period, Base Year & Forecast Period (2024; forecast to 2032)
- 1.3.4 Inclusions & Exclusions
- 1.4 HS Code & Classification Framework
- 1.5 Currency, Units & Pricing Basis
- 1.6 Target Stakeholders
- 1.7 Limitations & Assumptions
Chapter 2. Executive Summary
- 2.1 Global Biosimulation Market Snapshot
- 2.1.1 Market Size – Historical (2024) & Forecast (2024-2032) (2024: USD 3,793.2 million → 2032: USD 13,653.2 million)
- 2.1.2 Volume & Revenue – Global Totals
- 2.1.3 Key Market Highlights – Top Five Facts
- 2.2 Biosimulation Market Segmentation Snapshot
- 2.2.1 Market Split by Region – 2024 vs. 2032
- 2.3 Competitive Snapshot
- 2.3.1 Top 10 Players by Revenue Share – 2024
- 2.3.2 Top 10 Players by Volume Share – 2024
- 2.3.3 Recent Strategic Developments (18-Month Summary)
- 2.4 Key Investment Highlights & Strategic Conclusions
Chapter 3. Biosimulation Market Dynamics & Industry Analysis
- 3.1 Market Overview & Context
- 3.1.1 Biosimulation Market Position in the Broader Automotive Value Chain
- 3.1.2 OEM vs. Replacement Market Dynamics
- 3.1.3 Market Maturity & Development Stage by Region
- 3.2 Biosimulation Market Drivers
- 3.3 Biosimulation Market Restraints & Challenges
- 3.4 Biosimulation Market Opportunities
- 3.5 Porter's Five Forces Analysis
- 3.5.1 Threat of New Entrants
- 3.5.2 Bargaining Power of Suppliers
- 3.5.3 Bargaining Power of Buyers
- 3.5.4 Threat of Substitutes
- 3.5.5 Competitive Rivalry – Intensity Assessment
- 3.6 Biosimulation Value Chain Analysis
- 3.6.1 Upstream – Raw Material/Input Suppliers
- 3.6.1.1 Raw Material/Input 1
- 3.6.1.2 Raw Material/Input 2
- 3.6.1.3 Raw Material/Input 3
- 3.6.2 Midstream – Production/Manufacturing/Service Delivery
- 3.6.2.1 Production/Process Overview
- 3.6.2.2 Key Facility Locations & Capacity by Manufacturer
- 3.6.3 Downstream – Distribution & End Consumer
- 3.6.3.1 Primary Channel – B2B/OEM
- 3.6.3.2 Secondary Channels – Dealer, Retail, Online, Direct
- 3.6.4 Value Chain Profitability Analysis
- 3.6.1 Upstream – Raw Material/Input Suppliers
- 3.7 PESTEL Analysis
- 3.7.1 Political Factors
- 3.7.2 Economic Factors
- 3.7.3 Social Factors
- 3.7.4 Technological Factors
- 3.7.5 Environmental Factors
- 3.7.6 Legal Factors
- 3.8 Biosimulation Supply Chain Analysis
- 3.8.1 Raw Material/Input Supply Risk Assessment
- 3.8.2 Manufacturing Concentration Risk (Geographic Exposure)
- 3.8.3 Trade Disruption Impact Analysis
- 3.9 Regulatory & Policy Landscape
Note: The regulatory and policy landscape section covers regulations based on their applicability to the market, Biosimulation category, geography, and scope of the study. Only regulatory frameworks with a material impact on operations, compliance, trade, sustainability, or market access are analyzed in detail.
Chapter 4. Key Investment Pockets & Opportunity Analysis
- 4.1 Biosimulation Market Attractiveness Analysis
- 4.1.1 By Region – Investment Attractiveness Matrix (Volume × CAGR)
- 4.2 Absolute Revenue Growth Opportunity
- 4.2.1 By Region – Absolute USD Growth Through 2032
- 4.3 Incremental Volume Opportunity
- 4.3.1 By Region – Incremental Volume Through 2032
- 4.3.2 Segment – Incremental Volume
- 4.4 Emerging Submarket Opportunity Deep Dive (Subject to Applicability)
- 4.5 Emerging Market Opportunity Scorecards
- 4.5.1 United States
- 4.5.2 Europe
- 4.5.3 Asia
- 4.5.4 Middle East & Africa
Note: Emerging Market Opportunity Scorecards will be included based on relevance and strategic importance. Regions listed are indicative and may vary depending on data availability and market dynamics.
Chapter 5. Biosimulation Import-Export Analysis & Trade Flows
- 5.1 Global Trade Overview
- 5.1.1 Global Export Value by Country (2024)
- 5.1.2 Global Export Volume by Country (2024)
- 5.1.3 Global Import Value by Country (2024)
- 5.1.4 Global Import Volume by Country (2024)
- 5.1.5 Net Trade Balance by Country (2024)
- 5.2 Export Analysis – Segment
- 5.2.1 Type 1 (HS Code)
- 5.2.2 Type 2 (HS Code)
- 5.2.3 Type 3 (HS Code)
- 5.2.4 Type 4 (HS Code)
- 5.2.5 Type 5 (HS Code)
- 5.3 Import Analysis – Segment
- 5.3.1 Type 1 (HS Code)
- 5.3.2 Type 2 (HS Code)
- 5.3.3 Type 3 (HS Code)
- 5.3.4 Type 4 (HS Code)
- 5.3.5 Type 5 (HS Code)
- 5.4 Average Unit Trade Prices
- 5.4.1 Average Export Price – Segment & Country
- 5.4.2 Average Import Price – Segment & Source Country
- 5.4.3 Price Trends (2024)
- 5.5 Key Trade Route Analysis
- 5.5.1 Trade Route 1
- 5.5.2 Trade Route 2
- 5.5.3 Trade Route 3
- 5.5.4 Trade Route 4
- 5.5.5 Trade Route 5
- 5.6 Trade Policy Impact Assessment
- 5.6.1 US Anti-Dumping & Section 301 Tariffs
- 5.6.2 EU Customs Union Impact
- 5.6.3 Major Free Trade Agreements
- 5.6.4 USMCA Rules of Origin
Note: Trade policy analysis will be included only where relevant to the Biosimulation market.
Chapter 6. Competitive Landscape & Company Benchmarking
- 6.1 Biosimulation Market Concentration & Structure
- 6.1.1 Herfindahl-Hirschman Index (HHI) – vs. 2024
- 6.1.2 Tier 1, Tier 2 & Tier 3 Market Structure
- 6.1.3 Global, Regional & Local Player Dynamics
- 6.2 Biosimulation Market Share Analysis – 2024
- 6.2.1 Global Revenue Share by Company
- 6.2.2 Global Volume Share by Company
- 6.2.3 Regional Revenue Share
- 6.2.4 Market Share Evolution ( vs. 2024)
- 6.2.5 OEM Segment Share by Company
- 6.2.6 Replacement Segment Share by Company
- 6.3 Production/Delivery Capacity & Facility Analysis
- 6.3.1 Global Installed Capacity
- 6.3.2 Capacity Utilization Rates
- 6.3.3 Production/Output Volume
- 6.3.4 Facility Locations & Capacity Map
- 6.3.5 Planned Capacity Additions
- 6.4 Biosimulation Competitive Benchmarking Matrix
- 6.4.1 Revenue, Volume, CAGR & Profitability Comparison
- 6.4.2 Channel Revenue Mix
- 6.4.3 Geographic Revenue Exposure
- 6.4.4 R&D Intensity
- 6.4.5 Sustainability Maturity
- 6.5 Strategic Developments in Biosimulation (Last 24 Months)
- 6.5.1 Mergers, Acquisitions & Divestments
- 6.5.2 New Biosimulation Launches
- 6.5.3 Facility Expansions
- 6.5.4 Strategic Alliances, Joint Ventures & Partnerships
- 6.5.5 Distribution Expansion & Market Entry
- 6.5.6 Sustainability & ESG Initiatives
- 6.6 Competitive Strategy Mapping
- 6.6.1 Leader, Challenger, Follower & Niche Classification
- 6.6.2 Pricing Strategy Comparison
- 6.6.3 Channel Strategy Matrix
Note: Strategic developments are included based on their materiality and the availability of reliable information.
Chapter 7. Global Biosimulation Market – By Distribution Channel
- 7.1 Segment Overview
- 7.1.1 Volume & Revenue Split by Channel (2024 & 2032)
- 7.1.2 Channel Mix Evolution (2024-2032)
Chapter 8. Regional Market Analysis – Global Overview
- 8.1 Global Regional Overview
- 8.1.1 Regional Volume Share
- 8.1.2 Regional Revenue Share
- 8.1.3 Regional Volume by Region
- 8.1.4 Regional Revenue by Region
- 8.1.5 Regional Forecast Through 2032
- 8.2 Cross-Regional Segment Analysis
- 8.2.1 By Distribution Channel
- 8.2.2 By Brand/Price Tier
Chapter 9. North America Biosimulation Market
- 9.1 United States
- 9.2 Canada
- 9.3 Mexico
Chapter 10. Europe Biosimulation Market
- 10.1 Germany
- 10.2 France
- 10.3 Italy
- 10.4 United Kingdom
- 10.5 Spain
- 10.6 Poland
- 10.7 Russia
- 10.8 Netherlands
- 10.9 Belgium
- 10.10 Sweden
- 10.11 Denmark
- 10.12 Norway
- 10.13 Rest of Europe
Chapter 11. Asia Pacific Biosimulation Market
- 11.1 China
- 11.2 India
- 11.3 Japan
- 11.4 South Korea
- 11.5 Thailand
- 11.6 Indonesia
- 11.7 Vietnam
- 11.8 Malaysia
- 11.9 Australia
- 11.10 Rest of Asia Pacific
Chapter 12. Latin America Biosimulation Market
- 12.1 Brazil
- 12.2 Argentina
- 12.3 Colombia
- 12.4 Chile
- 12.5 Rest of Latin America
Chapter 13. Middle East Biosimulation Market
- 13.1 Saudi Arabia
- 13.2 United Arab Emirates
- 13.3 Turkey
- 13.4 Israel
- 13.5 Iran
- 13.6 Rest of the Middle East
Chapter 14. Africa Biosimulation Market
- 14.1 South Africa
- 14.2 Egypt
- 14.3 Nigeria
- 14.4 Morocco
- 14.5 Rest of Africa
Chapter 15. Biosimulation Company Profiles
- 15.1 [Company 01]
- 15.1.1 Company Overview
- 15.1.2 Key Management Personnel
- 15.1.3 Products & Services Portfolio
- 15.1.4 Financial Performance
- 15.1.5 Key Market Focus & Geographic Presence
- 15.1.6 Recent Developments & Strategic Initiatives
Note: The company profile list is preliminary and may change based on research findings, market developments, data availability, and client requirements.
Chapter 16. Appendices
- Appendix A – List of Abbreviations & Acronyms
- Appendix B – Industry Classification Code Reference – Full Series
- Appendix C – Production & Capacity Data Tables
- Appendix D – End-Use & Demand Base Tables
- Appendix E – Consumption & Replacement Rate Assumptions
- Appendix F – ASP Reference Tables
- Appendix G – Manufacturing & Facility Database
- Appendix H – Import-Export Data Tables
- Appendix I – Regulatory Summary Tables
- Appendix J – Primary Research Participant List (Anonymized)
- Appendix K – Primary Research Questionnaire Framework
- Appendix L – Data Sources & Bibliography
- Appendix M – Market Size Divergence & Source Comparison
Chapter 17. Research Methodology
- 17.1 Research Framework & Philosophy
- 17.2 Secondary Research – Sources, Hierarchy & Data Extraction
- 17.3 Data Modeling – Bottom-Up & Top-Down Market Sizing
- 17.4 Primary Research – Stakeholder Framework, LOI & Sample Sizes
- 17.5 Forecast Methodology – Regression, Scenario & Sensitivity Analysis
- 17.6 Quality Control – Four-Layer Validation Framework
- 17.7 Limitations & Standard Assumptions
- 17.8 Disclaimer
