
Crude Oil Pour Point Depressant Market Overview:
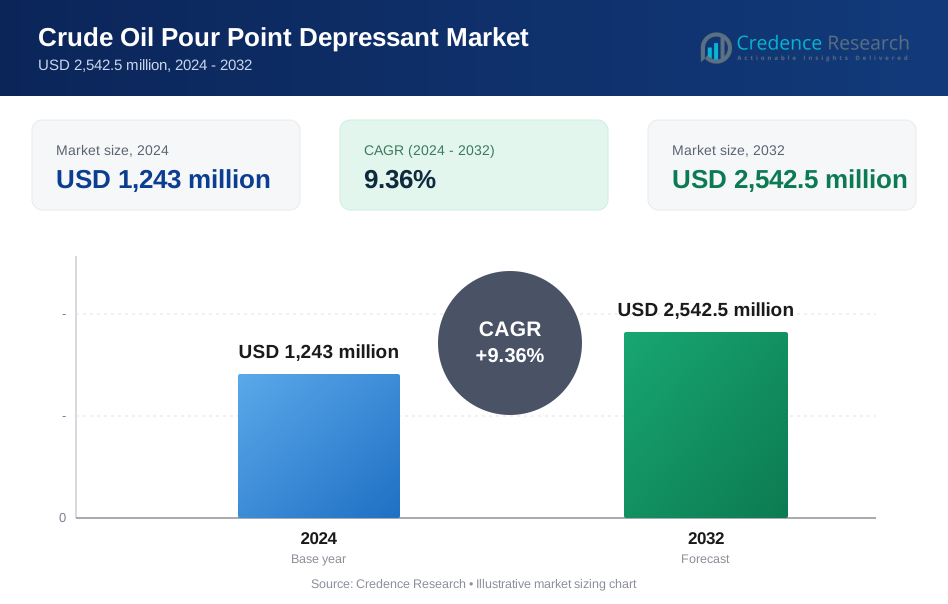
Crude Oil Pour Point Depressant Market size was valued USD 1243 million in 2024 and is anticipated to reach USD 2542.5 million by 2032, at a CAGR of 9.36% during the forecast period.
| REPORT ATTRIBUTE | DETAILS |
|---|---|
| Historical Period | 2020-2023 |
| Base Year | 2024 |
| Forecast Period | 2025-2032 |
| Crude Oil Pour Point Depressant Market Size 2024 | USD 1243 million |
| Crude Oil Pour Point Depressant Market, CAGR | 9.36% |
| Crude Oil Pour Point Depressant Market Size 2032 | USD 2542.5 million |
Crude Oil Pour Point Depressant Market Insights
- Market growth is driven by increasing production of waxy and high-paraffin crudes, longer pipeline networks in cold regions, and the need to reduce viscosity-related transportation and storage risks.
- Key trends include the shift toward high-efficiency polymer formulations, lower treat-rate additives, and customized solutions, with pipeline transportation emerging as the dominant application segment holding nearly 42% share.
- Competitive dynamics remain strong, with suppliers differentiating through R&D intensity, technical field support, crude-specific formulations, and long-term supply agreements, while price pressure persists in cost-sensitive markets.
- Regionally, Asia-Pacific leads with about 38% market share, supported by expanding pipelines, growing refining capacity, and rising crude output in China, India, and Southeast Asia, although regulatory and cost constraints act as key restraints.
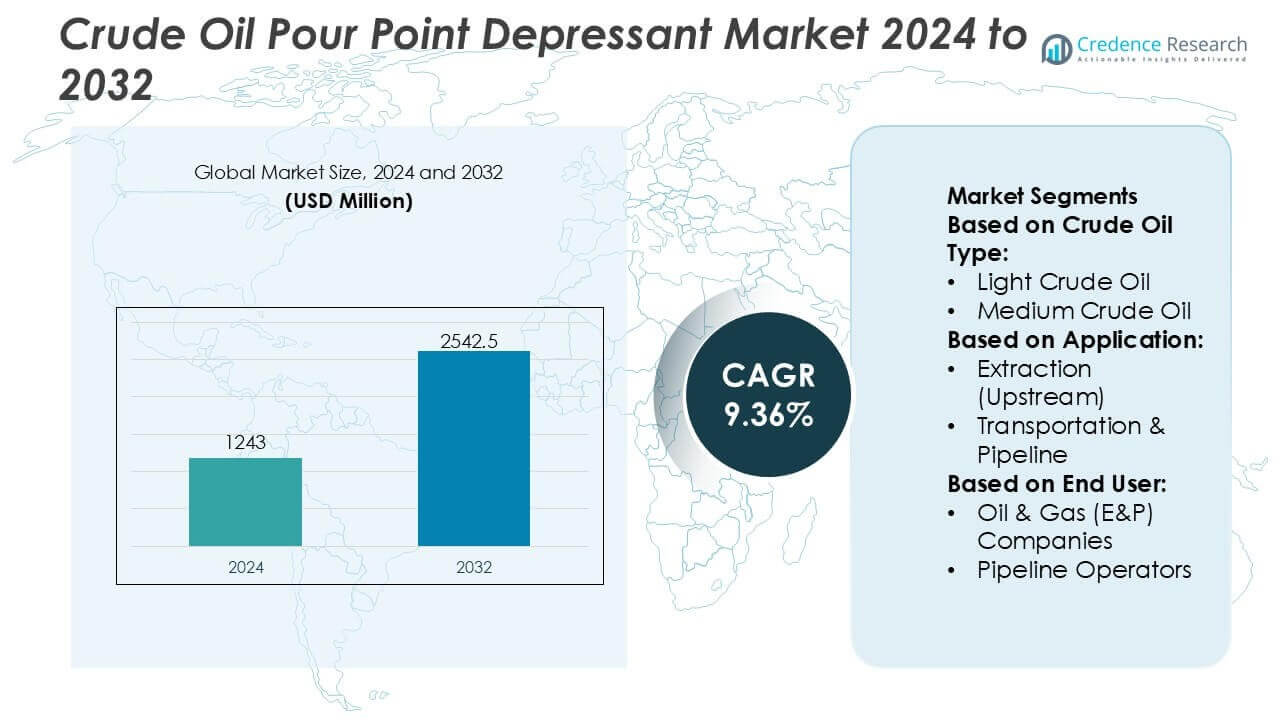
Crude Oil Pour Point Depressant Market Segmentation Analysis:
By Crude Oil Type
By crude oil type, heavy crude oil represents the dominant sub-segment in the crude oil pour point depressant market, holding the largest share due to its high wax and asphaltene content, which significantly elevates pour point and flow resistance under low-temperature conditions. Heavy and ultra-heavy crudes require consistent chemical treatment to ensure uninterrupted flow during production and transport. The rising development of heavy oil reserves, especially in mature and unconventional fields, drives sustained demand for pour point depressants. In contrast, light crude oil requires comparatively lower treatment intensity, limiting its relative contribution, while medium crude oil maintains steady adoption across blended crude streams.
- For instance, Innospec has developed polymeric pour point depressant formulations, such as those in the Trident series, capable of reducing the pour point by up to 20 °C in heavy crude systems with wax content exceeding 18 wt%.
By Application
By application, transportation & pipeline operations account for the leading market share, driven by the critical need to maintain crude oil flow assurance over long distances and across varying climatic conditions. Pour point depressants are extensively used to reduce wax crystallization and viscosity buildup in pipelines, preventing blockages and reducing pumping energy requirements. The dominance of this segment is reinforced by expanding cross-border pipeline networks, offshore-to-onshore transport systems, and cold-region logistics. Extraction and storage applications follow, while refining uses remain more selective, primarily focused on feedstock handling and intermediate storage stability.
- For instance, Sanyo Chemical Industries, Ltd. provides advanced cold flow improvers, including its ACLUBE and NEOPROVER series, designed to enhance the flowability of waxy systems. These technologies, alongside ethylene–vinyl acetate-based copolymers, can achieve pour point reductions of 10 °C or more and significantly lower dynamic viscosity at low temperatures (such as –5 °C) to ensure reliable pipeline transportation.
By End-User
By end-user, oil & gas (E&P) companies dominate the market, accounting for the highest share due to their direct involvement in crude production, initial handling, and flow assurance management. These companies deploy pour point depressants early in the value chain to optimize well productivity, reduce shutdown risks, and improve crude transportability from remote fields. Increasing operational focus on heavy crude and marginal fields further strengthens this segment. Pipeline operators and refineries represent secondary demand centers, while oilfield service companies support adoption through chemical supply, on-site treatment, and integrated flow assurance solutions.
Key Growth Drivers
Rising Production and Transport of Heavy & Wax-Rich Crude Oils
Growing reliance on heavy, extra-heavy, and wax-rich crude oils is a primary growth driver for the crude oil pour point depressant (PPD) market. As conventional light crude reserves mature, operators increasingly exploit high-viscosity resources that exhibit poor low-temperature flow properties. PPDs play a critical role in modifying wax crystal formation, reducing gelation risk, and ensuring uninterrupted flow during extraction and transportation. This need is particularly pronounced in cold climates and offshore fields, where low ambient temperatures elevate flow-assurance risks and increase dependence on chemical flow-improvement solutions.
- For instance, Afton Chemical provides advanced flow improver technology, including its HiTEC® series of pour point depressants, designed to modify wax crystallization in wax-rich crude oils. These technologies can achieve significant pour point reductions (often exceeding 15 °C) and substantial decreases in yield stress and apparent viscosity, ensuring reliable flow assurance in pipelines during low-temperature operation.
Expansion of Pipeline and Long-Distance Transportation Infrastructure
The expansion of cross-border pipelines and long-distance crude transportation networks significantly supports demand for pour point depressants. Pipelines transporting crude over thousands of kilometers face wide temperature fluctuations that can induce wax precipitation and flow blockages. PPDs help maintain stable viscosity profiles, minimize restart pressures, and reduce energy consumption during pumping. As pipeline operators prioritize operational efficiency, safety, and reduced downtime, the integration of advanced pour point depressant formulations becomes a cost-effective alternative to mechanical heating and insulation systems.
- For instance, Evonik Industries’s VISCOPLEX® PPD formulations have been documented to reduce pour point by as much as 35 °C (e.g., lowering pour point from –20 °C to –55 °C) in base stocks tested under ASTM D4684 MRV conditions at treat rates between 0.4 wt% and 0.6 wt%, while maintaining yield stress below 35 Pa at –35 °C, ensuring robust low-temperature flow behavior in demanding applications.
Operational Cost Optimization and Production Efficiency Focus
Oil and gas operators increasingly prioritize chemical solutions that enhance production efficiency while lowering operating expenditures. Pour point depressants reduce the need for thermal treatments, dilution with lighter crudes, or frequent pigging operations, resulting in measurable cost savings. Improved flowability also minimizes equipment stress and unplanned shutdowns. As margins tighten amid volatile crude prices, producers adopt PPDs as part of integrated flow-assurance strategies to sustain output, protect assets, and optimize lifecycle economics across upstream, midstream, and downstream operations.
Key Trends & Opportunities
Development of High-Performance and Tailored PPD Formulations
A key trend in the market is the development of customized pour point depressant formulations tailored to specific crude compositions. Variations in wax content, molecular weight distribution, and asphaltene levels require targeted chemical design for optimal performance. Suppliers increasingly offer field-specific PPDs that deliver higher efficiency at lower dosages, improving cost-performance ratios. This customization trend opens opportunities for specialty chemical providers to collaborate closely with operators, conduct crude-specific testing, and deliver value-added flow-assurance solutions.
- For instance, Lubrizol’s LZ 7745 polymethacrylate-based pour point depressant has documented performance showing pour point reduction capability in base oil samples, and its recommended treat rates range from 0.1 wt% to 1.0 wt% depending on feedstock composition according to technical data sheets, with the polymer exhibiting compatibility across Group I and Group II base stocks and enabling improved cold-temperature fluidity during ASTM standard testing.
Growing Adoption in Cold and Arctic Oilfield Developments
Rising exploration and production activities in cold and ultra-cold regions present strong growth opportunities for the PPD market. Arctic, sub-Arctic, and high-altitude fields experience extreme temperature conditions that exacerbate wax deposition and flow challenges. Pour point depressants become essential for maintaining year-round operability without excessive reliance on heating systems. As investments increase in northern onshore and offshore developments, demand for robust, low-temperature-effective PPD technologies is expected to grow steadily.
- For instance, Infineum’s documented B100 and B200 series of pour point depressants, as outlined in its marine fuel additives catalogue, are formulated to provide controlled cold-flow performance including pour point and cold filter plugging point (CFPP) improvement for fuel systems, with product classifications reflecting measured performance shifts in CFPP under standardized test conditions.
Integration with Digital Flow-Assurance and Monitoring Systems
The integration of pour point depressants with digital oilfield and flow-assurance monitoring systems is an emerging opportunity. Advanced analytics and real-time monitoring enable operators to optimize chemical dosing based on temperature, pressure, and flow conditions. This data-driven approach improves chemical efficiency, reduces waste, and enhances operational predictability. Suppliers offering technical support, digital modeling, and performance optimization services alongside PPD products can strengthen long-term customer relationships and differentiate themselves in a competitive market.
Key Challenges
Variability in Crude Oil Composition and Performance Uncertainty
One of the major challenges in the crude oil pour point depressant market is the high variability in crude oil composition across fields and regions. Differences in wax content, paraffin structure, and impurity levels can significantly influence PPD effectiveness. A formulation that performs well for one crude may deliver suboptimal results for another, increasing the need for extensive laboratory testing and field trials. This variability raises development costs, extends deployment timelines, and may limit rapid scalability of standardized PPD solutions.
Environmental and Regulatory Constraints on Chemical Usage
Increasing environmental scrutiny and tightening regulations on chemical additives pose challenges for PPD manufacturers and users. Concerns related to toxicity, biodegradability, and environmental persistence drive demand for compliant and eco-friendly formulations. Meeting these requirements often increases R&D costs and may constrain the use of certain high-performance chemistries. Additionally, regulatory approvals can delay product launches and limit regional market access, requiring suppliers to continuously balance performance objectives with sustainability and compliance mandates.
Regional Analysis
North America
North America accounts for approximately 34% of the global crude oil pour point depressant market, driven by extensive production of heavy and waxy crudes in the U.S. and Canada. The region’s dominance is supported by large-scale pipeline networks, shale and oil sands operations, and exposure to cold climatic conditions that intensify flow-assurance challenges. Operators widely adopt pour point depressants to reduce viscosity, prevent wax deposition, and ensure reliable transportation across long distances. Strong R&D capabilities, advanced chemical formulation expertise, and strict operational efficiency standards further reinforce sustained demand across upstream and midstream activities.
Europe
Europe holds nearly 21% of the global crude oil pour point depressant market, supported by offshore production in the North Sea and mature onshore fields with declining reservoir quality. Cold weather conditions and long subsea tiebacks increase reliance on chemical flow-improvement solutions to maintain crude mobility. European operators emphasize optimized dosing, high-performance formulations, and regulatory-compliant chemistries aligned with stringent environmental standards. The region also benefits from advanced pipeline infrastructure and strong collaboration between oil companies and specialty chemical suppliers, driving steady adoption of tailored pour point depressant solutions across upstream and transportation applications.
Asia-Pacific
Asia-Pacific represents about 27% of the global market and is the fastest-growing regional segment. Rising crude oil production in China, India, and Southeast Asia, combined with increasing imports of heavy and wax-rich crudes, drives strong demand for pour point depressants. Expanding pipeline infrastructure, refinery capacity additions, and exposure to temperature variations across diverse geographies further support market growth. National oil companies increasingly adopt chemical flow-assurance solutions to improve transportation efficiency and reduce operating costs, making Asia-Pacific a key growth engine for both volume-driven and customized PPD formulations.
Latin America
Latin America accounts for approximately 10% of the crude oil pour point depressant market, led by heavy crude production in countries such as Brazil, Venezuela, and Colombia. High wax content and viscosity challenges in offshore and onshore fields necessitate the use of pour point depressants to ensure stable flow and reduce transportation risks. Investment in pipeline upgrades and offshore developments supports gradual market expansion. However, adoption rates vary by country due to economic volatility and capital constraints, resulting in moderate but steady demand for cost-effective and performance-optimized PPD solutions.
Middle East & Africa
The Middle East & Africa region holds close to 8% of the global market, with demand driven by increasing production of heavier crude grades and expanding pipeline networks. While extreme cold is less common, temperature fluctuations during transportation and storage still create wax-related flow challenges. Pour point depressants are increasingly used to enhance operational reliability and reduce dependence on thermal methods. In Africa, new upstream developments and export-oriented infrastructure contribute to incremental growth. Gradual modernization of flow-assurance practices supports sustained, though comparatively slower, market adoption across the region.
Crude Oil Pour Point Depressant Market Segmentations:
By Crude Oil Type:
- Light Crude Oil
- Medium Crude Oil
By Application:
- Extraction (Upstream)
- Transportation & Pipeline
By End User:
- Oil & Gas (E&P) Companies
- Pipeline Operators
By Geography
- North America
- U.S.
- Canada
- Mexico
- Europe
- Germany
- France
- U.K.
- Italy
- Spain
- Rest of Europe
- Asia Pacific
- China
- Japan
- India
- South Korea
- South-east Asia
- Rest of Asia Pacific
- Latin America
- Brazil
- Argentina
- Rest of Latin America
- Middle East & Africa
- GCC Countries
- South Africa
- Rest of the Middle East and Africa
Competitive Landscape
The crude oil pour point depressant (PPD) market players such as Innospec, Sanyo Chemical Industries, Ltd., Afton Chemical, Puyang Jiahua Chemical Co., Ltd., Evonik Industries, Shengyang Greatwall Lubricant Oil Co., Ltd., The Lubrizol Corporation, Ecolab, Infineum International Limited, CLARIANT. The crude oil pour point depressant market is characterized by competition driven by formulation performance, adaptability to diverse crude profiles, and reliability under challenging operating conditions. Market participants focus on developing advanced polymer- and surfactant-based chemistries that effectively control wax crystallization, improve low-temperature flow, and reduce transportation and storage risks. Strong emphasis is placed on R&D to deliver tailor-made solutions for light, heavy, and high-paraffin crudes, as well as for long-distance pipeline networks. Technical service capabilities, including on-site testing and dosage optimization, play a critical role in supplier selection. Additionally, companies strengthen their market positions through integrated manufacturing, consistent product quality, and long-term supply agreements. Increasing demand for operational efficiency, flow assurance, and cost reduction across upstream and midstream activities continues to intensify competitive pressures in this market.
Key Player Analysis
- Innospec
- Sanyo Chemical Industries, Ltd.
- Afton Chemical
- Puyang Jiahua Chemical Co., Ltd.
- Evonik Industries
- Shengyang Greatwall Lubricant Oil Co., Ltd.
- The Lubrizol Corporation
- Ecolab
- Infineum International Limited
- CLARIANT
Recent Developments
- In November 2025, Johnson & Johnson won Food and Drug Administration approval to sell its drug Caplyta for patients suffering from major depressive disorder. Johnson & Johnson closed its buyout of Intra-Cellular Therapies, gaining CAPLYTA for bipolar depression and planned MDD expansion.
- In March 2025, PharmaTher announced that the FDA had assigned a new approval goal for its ketamine NDA (New Drug Application), which was aimed at easing U.S. supply shortages. This followed a resubmission by the company to address minor deficiencies in a previous Complete Response Letter (CRL).
- In August 2024, Launch of PfizerForAll Digital PlatformPfizer introduced PfizerForAll, a digital platform designed to streamline access to healthcare and wellness resources in the U.S. The platform offers services like same-day access to healthcare professionals, home delivery of prescriptions and diagnostic tests, appointment scheduling, and financial assistance for Pfizer medications.
Report Coverage
The research report offers an in-depth analysis based on Crude Oil Type, Application, End-User and Geography. It details leading market players, providing an overview of their business, product offerings, investments, revenue streams, and key applications. Additionally, the report includes insights into the competitive environment, SWOT analysis, current market trends, as well as the primary drivers and constraints. Furthermore, it discusses various factors that have driven market expansion in recent years. The report also explores market dynamics, regulatory scenarios, and technological advancements that are shaping the industry. It assesses the impact of external factors and global economic changes on market growth. Lastly, it provides strategic recommendations for new entrants and established companies to navigate the complexities of the market.
Future Outlook
- Demand will rise steadily as crude production increasingly shifts toward waxy and high-paraffin reservoirs.
- Pipeline expansion in cold and remote regions will accelerate adoption of advanced pour point depressant solutions.
- Formulation development will focus on higher efficiency at lower treat rates to reduce overall operating costs.
- Customized additives tailored to specific crude blends will gain stronger preference among operators.
- Integration of digital flow-assurance modeling will support optimized dosing and performance monitoring.
- Environmental and regulatory pressures will encourage development of more sustainable and low-toxicity chemistries.
- Growth in offshore and deepwater projects will increase demand for high-performance low-temperature additives.
- Asia-Pacific will remain a key growth region due to expanding refining and pipeline infrastructure.
- Strategic collaborations between additive suppliers and oil producers will become more common.
- Competitive differentiation will increasingly depend on technical service support and field-proven performance reliability.
Request a Free Sample
Fill in your details and we'll send you a free sample report.
- Sample data tables & charts
- Research methodology
Need a Custom Version of This Report?
Tailor the scope, geography, or segments to your exact requirements.
- Custom geography or segment scope
- Direct access to our analyst team
Frequently Asked Questions
What is the current market size for the Crude Oil Pour Point Depressant Market, and what is its projected size in 2032?
At what Compound Annual Growth Rate is the Crude Oil Pour Point Depressant Market projected to grow between 2024 and 2032?
Which Crude Oil Pour Point Depressant Market segment held the largest share in 2024?
What are the primary factors fueling the growth of the Crude Oil Pour Point Depressant Market?
Who are the leading companies in the Crude Oil Pour Point Depressant Market?
Which region commanded the largest share of the Crude Oil Pour Point Depressant Market in 2024?
Table of Content
Chapter 1. Report Introduction
- 1.1 Report Description & Purpose
- 1.1.1 Report Title & Market Definition
- 1.1.2 Unique Selling Propositions (USP) & Key Differentiators
- 1.1.3 Value Proposition for Stakeholders
- 1.2 Research Objectives
- 1.2.1 Market Sizing Objectives (Volume & Revenue)
- 1.2.2 Segmentation Objectives
- 1.2.3 Competitive Intelligence Objectives
- 1.2.4 Forecast & Scenario Objectives
- 1.3 Report Scope
- 1.3.1 Crude Oil Pour Point Depressant Scope – Types & Subtypes Covered
- 1.3.2 Geographic Scope – Regions & Countries Covered
- 1.3.3 Historical Period, Base Year & Forecast Period (2024; forecast to 2032)
- 1.3.4 Inclusions & Exclusions
- 1.4 HS Code & Classification Framework
- 1.5 Currency, Units & Pricing Basis
- 1.6 Target Stakeholders
- 1.7 Limitations & Assumptions
Chapter 2. Executive Summary
- 2.1 Global Crude Oil Pour Point Depressant Market Snapshot
- 2.1.1 Market Size – Historical (2024) & Forecast (2024-2032) (2024: USD 1,243 million → 2032: USD 2,542.5 million)
- 2.1.2 Volume & Revenue – Global Totals
- 2.1.3 Key Market Highlights – Top Five Facts
- 2.2 Crude Oil Pour Point Depressant Market Segmentation Snapshot
- 2.2.1 Market Split by Region – 2024 vs. 2032
- 2.3 Competitive Snapshot
- 2.3.1 Top 10 Players by Revenue Share – 2024
- 2.3.2 Top 10 Players by Volume Share – 2024
- 2.3.3 Recent Strategic Developments (18-Month Summary)
- 2.4 Key Investment Highlights & Strategic Conclusions
Chapter 3. Crude Oil Pour Point Depressant Market Dynamics & Industry Analysis
- 3.1 Market Overview & Context
- 3.1.1 Crude Oil Pour Point Depressant Market Position in the Broader Automotive Value Chain
- 3.1.2 OEM vs. Replacement Market Dynamics
- 3.1.3 Market Maturity & Development Stage by Region
- 3.2 Crude Oil Pour Point Depressant Market Drivers
- 3.3 Crude Oil Pour Point Depressant Market Restraints & Challenges
- 3.4 Crude Oil Pour Point Depressant Market Opportunities
- 3.5 Porter's Five Forces Analysis
- 3.5.1 Threat of New Entrants
- 3.5.2 Bargaining Power of Suppliers
- 3.5.3 Bargaining Power of Buyers
- 3.5.4 Threat of Substitutes
- 3.5.5 Competitive Rivalry – Intensity Assessment
- 3.6 Crude Oil Pour Point Depressant Value Chain Analysis
- 3.6.1 Upstream – Raw Material/Input Suppliers
- 3.6.1.1 Raw Material/Input 1
- 3.6.1.2 Raw Material/Input 2
- 3.6.1.3 Raw Material/Input 3
- 3.6.2 Midstream – Production/Manufacturing/Service Delivery
- 3.6.2.1 Production/Process Overview
- 3.6.2.2 Key Facility Locations & Capacity by Manufacturer
- 3.6.3 Downstream – Distribution & End Consumer
- 3.6.3.1 Primary Channel – B2B/OEM
- 3.6.3.2 Secondary Channels – Dealer, Retail, Online, Direct
- 3.6.4 Value Chain Profitability Analysis
- 3.6.1 Upstream – Raw Material/Input Suppliers
- 3.7 PESTEL Analysis
- 3.7.1 Political Factors
- 3.7.2 Economic Factors
- 3.7.3 Social Factors
- 3.7.4 Technological Factors
- 3.7.5 Environmental Factors
- 3.7.6 Legal Factors
- 3.8 Crude Oil Pour Point Depressant Supply Chain Analysis
- 3.8.1 Raw Material/Input Supply Risk Assessment
- 3.8.2 Manufacturing Concentration Risk (Geographic Exposure)
- 3.8.3 Trade Disruption Impact Analysis
- 3.9 Regulatory & Policy Landscape
Note: The regulatory and policy landscape section covers regulations based on their applicability to the market, Crude Oil Pour Point Depressant category, geography, and scope of the study. Only regulatory frameworks with a material impact on operations, compliance, trade, sustainability, or market access are analyzed in detail.
Chapter 4. Key Investment Pockets & Opportunity Analysis
- 4.1 Crude Oil Pour Point Depressant Market Attractiveness Analysis
- 4.1.1 By Region – Investment Attractiveness Matrix (Volume × CAGR)
- 4.2 Absolute Revenue Growth Opportunity
- 4.2.1 By Region – Absolute USD Growth Through 2032
- 4.3 Incremental Volume Opportunity
- 4.3.1 By Region – Incremental Volume Through 2032
- 4.3.2 Segment – Incremental Volume
- 4.4 Emerging Submarket Opportunity Deep Dive (Subject to Applicability)
- 4.5 Emerging Market Opportunity Scorecards
- 4.5.1 United States
- 4.5.2 Europe
- 4.5.3 Asia
- 4.5.4 Middle East & Africa
Note: Emerging Market Opportunity Scorecards will be included based on relevance and strategic importance. Regions listed are indicative and may vary depending on data availability and market dynamics.
Chapter 5. Crude Oil Pour Point Depressant Import-Export Analysis & Trade Flows
- 5.1 Global Trade Overview
- 5.1.1 Global Export Value by Country (2024)
- 5.1.2 Global Export Volume by Country (2024)
- 5.1.3 Global Import Value by Country (2024)
- 5.1.4 Global Import Volume by Country (2024)
- 5.1.5 Net Trade Balance by Country (2024)
- 5.2 Export Analysis – Segment
- 5.2.1 Type 1 (HS Code)
- 5.2.2 Type 2 (HS Code)
- 5.2.3 Type 3 (HS Code)
- 5.2.4 Type 4 (HS Code)
- 5.2.5 Type 5 (HS Code)
- 5.3 Import Analysis – Segment
- 5.3.1 Type 1 (HS Code)
- 5.3.2 Type 2 (HS Code)
- 5.3.3 Type 3 (HS Code)
- 5.3.4 Type 4 (HS Code)
- 5.3.5 Type 5 (HS Code)
- 5.4 Average Unit Trade Prices
- 5.4.1 Average Export Price – Segment & Country
- 5.4.2 Average Import Price – Segment & Source Country
- 5.4.3 Price Trends (2024)
- 5.5 Key Trade Route Analysis
- 5.5.1 Trade Route 1
- 5.5.2 Trade Route 2
- 5.5.3 Trade Route 3
- 5.5.4 Trade Route 4
- 5.5.5 Trade Route 5
- 5.6 Trade Policy Impact Assessment
- 5.6.1 US Anti-Dumping & Section 301 Tariffs
- 5.6.2 EU Customs Union Impact
- 5.6.3 Major Free Trade Agreements
- 5.6.4 USMCA Rules of Origin
Note: Trade policy analysis will be included only where relevant to the Crude Oil Pour Point Depressant market.
Chapter 6. Competitive Landscape & Company Benchmarking
- 6.1 Crude Oil Pour Point Depressant Market Concentration & Structure
- 6.1.1 Herfindahl-Hirschman Index (HHI) – vs. 2024
- 6.1.2 Tier 1, Tier 2 & Tier 3 Market Structure
- 6.1.3 Global, Regional & Local Player Dynamics
- 6.2 Crude Oil Pour Point Depressant Market Share Analysis – 2024
- 6.2.1 Global Revenue Share by Company
- 6.2.2 Global Volume Share by Company
- 6.2.3 Regional Revenue Share
- 6.2.4 Market Share Evolution ( vs. 2024)
- 6.2.5 OEM Segment Share by Company
- 6.2.6 Replacement Segment Share by Company
- 6.3 Production/Delivery Capacity & Facility Analysis
- 6.3.1 Global Installed Capacity
- 6.3.2 Capacity Utilization Rates
- 6.3.3 Production/Output Volume
- 6.3.4 Facility Locations & Capacity Map
- 6.3.5 Planned Capacity Additions
- 6.4 Crude Oil Pour Point Depressant Competitive Benchmarking Matrix
- 6.4.1 Revenue, Volume, CAGR & Profitability Comparison
- 6.4.2 Channel Revenue Mix
- 6.4.3 Geographic Revenue Exposure
- 6.4.4 R&D Intensity
- 6.4.5 Sustainability Maturity
- 6.5 Strategic Developments in Crude Oil Pour Point Depressant (Last 24 Months)
- 6.5.1 Mergers, Acquisitions & Divestments
- 6.5.2 New Crude Oil Pour Point Depressant Launches
- 6.5.3 Facility Expansions
- 6.5.4 Strategic Alliances, Joint Ventures & Partnerships
- 6.5.5 Distribution Expansion & Market Entry
- 6.5.6 Sustainability & ESG Initiatives
- 6.6 Competitive Strategy Mapping
- 6.6.1 Leader, Challenger, Follower & Niche Classification
- 6.6.2 Pricing Strategy Comparison
- 6.6.3 Channel Strategy Matrix
Note: Strategic developments are included based on their materiality and the availability of reliable information.
Chapter 7. Global Crude Oil Pour Point Depressant Market – By Distribution Channel
- 7.1 Segment Overview
- 7.1.1 Volume & Revenue Split by Channel (2024 & 2032)
- 7.1.2 Channel Mix Evolution (2024-2032)
Chapter 8. Regional Market Analysis – Global Overview
- 8.1 Global Regional Overview
- 8.1.1 Regional Volume Share
- 8.1.2 Regional Revenue Share
- 8.1.3 Regional Volume by Region
- 8.1.4 Regional Revenue by Region
- 8.1.5 Regional Forecast Through 2032
- 8.2 Cross-Regional Segment Analysis
- 8.2.1 By Distribution Channel
- 8.2.2 By Brand/Price Tier
Chapter 9. North America Crude Oil Pour Point Depressant Market
- 9.1 United States
- 9.2 Canada
- 9.3 Mexico
Chapter 10. Europe Crude Oil Pour Point Depressant Market
- 10.1 Germany
- 10.2 France
- 10.3 Italy
- 10.4 United Kingdom
- 10.5 Spain
- 10.6 Poland
- 10.7 Russia
- 10.8 Netherlands
- 10.9 Belgium
- 10.10 Sweden
- 10.11 Denmark
- 10.12 Norway
- 10.13 Rest of Europe
Chapter 11. Asia Pacific Crude Oil Pour Point Depressant Market
- 11.1 China
- 11.2 India
- 11.3 Japan
- 11.4 South Korea
- 11.5 Thailand
- 11.6 Indonesia
- 11.7 Vietnam
- 11.8 Malaysia
- 11.9 Australia
- 11.10 Rest of Asia Pacific
Chapter 12. Latin America Crude Oil Pour Point Depressant Market
- 12.1 Brazil
- 12.2 Argentina
- 12.3 Colombia
- 12.4 Chile
- 12.5 Rest of Latin America
Chapter 13. Middle East Crude Oil Pour Point Depressant Market
- 13.1 Saudi Arabia
- 13.2 United Arab Emirates
- 13.3 Turkey
- 13.4 Israel
- 13.5 Iran
- 13.6 Rest of the Middle East
Chapter 14. Africa Crude Oil Pour Point Depressant Market
- 14.1 South Africa
- 14.2 Egypt
- 14.3 Nigeria
- 14.4 Morocco
- 14.5 Rest of Africa
Chapter 15. Crude Oil Pour Point Depressant Company Profiles
- 15.1 [Company 01]
- 15.1.1 Company Overview
- 15.1.2 Key Management Personnel
- 15.1.3 Products & Services Portfolio
- 15.1.4 Financial Performance
- 15.1.5 Key Market Focus & Geographic Presence
- 15.1.6 Recent Developments & Strategic Initiatives
Note: The company profile list is preliminary and may change based on research findings, market developments, data availability, and client requirements.
Chapter 16. Appendices
- Appendix A – List of Abbreviations & Acronyms
- Appendix B – Industry Classification Code Reference – Full Series
- Appendix C – Production & Capacity Data Tables
- Appendix D – End-Use & Demand Base Tables
- Appendix E – Consumption & Replacement Rate Assumptions
- Appendix F – ASP Reference Tables
- Appendix G – Manufacturing & Facility Database
- Appendix H – Import-Export Data Tables
- Appendix I – Regulatory Summary Tables
- Appendix J – Primary Research Participant List (Anonymized)
- Appendix K – Primary Research Questionnaire Framework
- Appendix L – Data Sources & Bibliography
- Appendix M – Market Size Divergence & Source Comparison
Chapter 17. Research Methodology
- 17.1 Research Framework & Philosophy
- 17.2 Secondary Research – Sources, Hierarchy & Data Extraction
- 17.3 Data Modeling – Bottom-Up & Top-Down Market Sizing
- 17.4 Primary Research – Stakeholder Framework, LOI & Sample Sizes
- 17.5 Forecast Methodology – Regression, Scenario & Sensitivity Analysis
- 17.6 Quality Control – Four-Layer Validation Framework
- 17.7 Limitations & Standard Assumptions
- 17.8 Disclaimer
