
Extra Neutral Alcohol Market Overview:
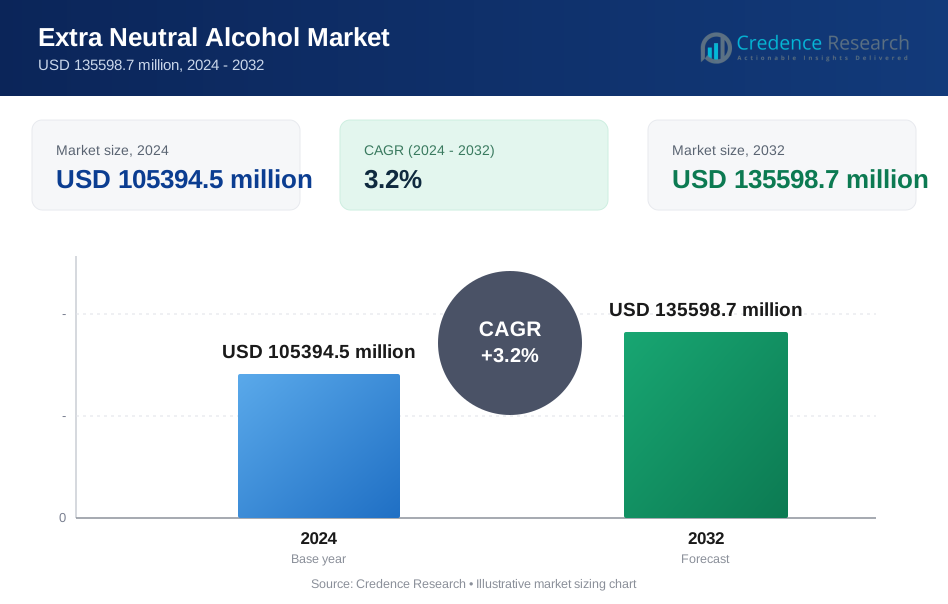
The Extra Neutral Alcohol market was valued at USD 105394.5 million in 2024 and is anticipated to reach USD 135598.7 million by 2032, growing at a CAGR of 3.2% during the forecast period.
| REPORT ATTRIBUTE | DETAILS |
|---|---|
| Historical Period | 2020-2023 |
| Base Year | 2024 |
| Forecast Period | 2025-2032 |
| Extra Neutral Alcohol Market Size 2024 | USD 105394.5 million |
| Extra Neutral Alcohol Market, CAGR | 3.2% |
| Extra Neutral Alcohol Market Size 2032 | USD 135598.7 million |
Extra Neutral Alcohol Market Insights
- Alcoholic beverage demand drives the Extra Neutral Alcohol market, with alcoholic beverages leading applications at an 81% share due to spirits and premium liquor production.
- Market trends show strong preference for food grade ENA, which holds a 74% share, supported by purity needs in beverages and flavor extraction.
- Competitive analysis indicates a fragmented Extra Neutral Alcohol market, where major players focus on capacity expansion, quality compliance, and raw material sourcing efficiency.
- Regional analysis shows Asia Pacific leading the Extra Neutral Alcohol market with a 44% share, followed by Europe at 27% and North America at 19%, driven by spirits production and pharmaceutical use.
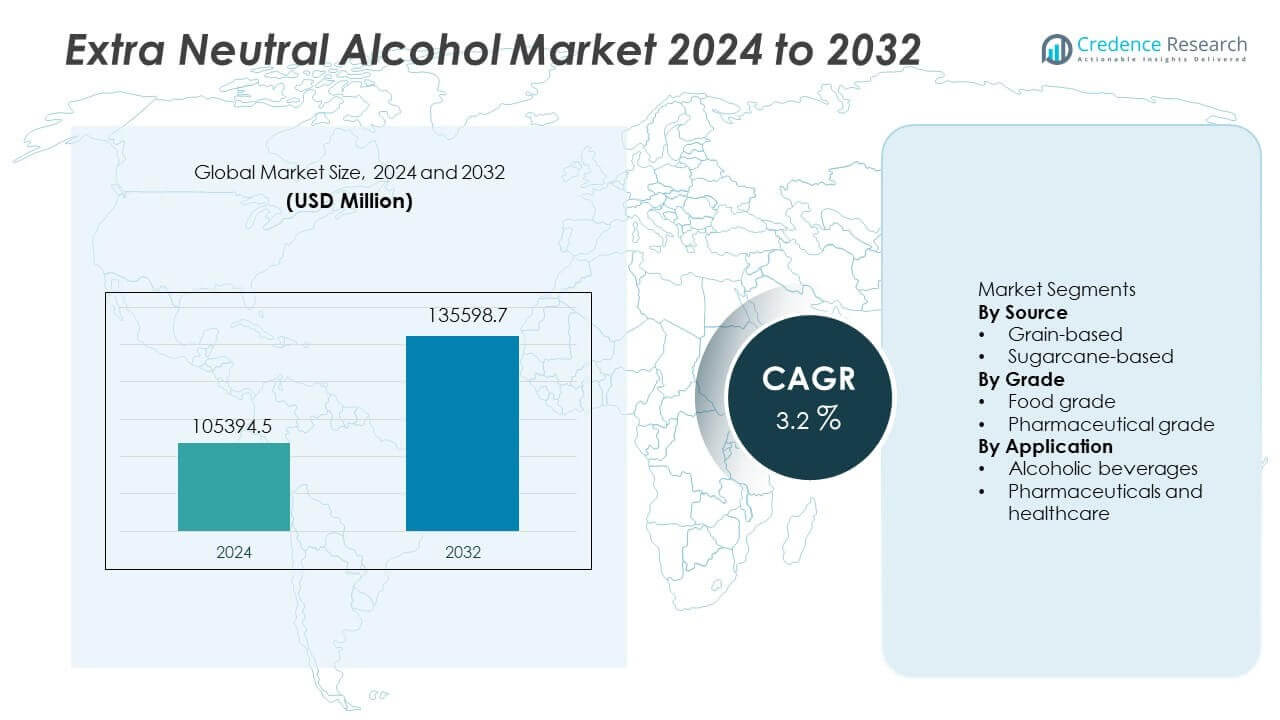
Extra Neutral Alcohol Market Segmentation Analysis:
By Source
The By Source segment of the Extra Neutral Alcohol market is dominated by grain-based ENA, which accounts for a 62% market share. Grain-based sources such as corn, wheat, and barley offer consistent quality and stable supply, making them preferred for large-scale production. Distillers favor grain-based ENA for superior purity, neutral taste, and suitability for premium alcoholic beverages. Strong availability in North America and Europe further supports dominance. Sugarcane-based ENA holds the remaining share, driven by cost advantages and high production capacity in Asia Pacific and Latin America. However, quality perception and regional dependence keep sugarcane-based ENA secondary to grain-based variants.
- For instance, MGP Ingredients reported using a significant amount of corn in its distillery operations and alcohol production, highlighting the company's reliance on consistent grain sourcing to support its distilling and ingredient solutions segments.
By Grade
Within the By Grade segment, food grade Extra Neutral Alcohol leads the market with a 74% share. Food grade ENA is widely used in spirits, liquors, and flavor extraction due to high purity and odorless properties. Rising consumption of premium alcoholic beverages strongly supports this segment. Beverage manufacturers rely on food grade ENA to maintain product consistency and regulatory compliance. Pharmaceutical grade ENA accounts for the remaining share, driven by demand from drug formulation, antiseptics, and medical applications. Strict quality standards and controlled usage limit volume growth, keeping pharmaceutical grade ENA smaller but essential for healthcare-related applications.
- For instance, Radico Khaitan expanded ENA supply for branded spirits by 18 million liters in 2024. Beverage manufacturers rely on food grade ENA to maintain product consistency and regulatory compliance.
By Application
The By Application segment is led by alcoholic beverages, which hold a dominant 81% share of the Extra Neutral Alcohol market. ENA serves as a key base alcohol for vodka, gin, whisky blends, and flavored spirits. Rising global alcohol consumption and premiumization trends drive strong demand. Expansion of distillery capacity and brand diversification further support usage. Pharmaceuticals and healthcare represent the remaining share, supported by use in cough syrups, sanitizers, and medicinal formulations. Increased focus on healthcare hygiene and pharmaceutical manufacturing supports steady demand, but lower volume requirements keep this segment secondary to alcoholic beverage applications.
Key Growth Drivers
Rising Consumption of Alcoholic Beverages
Growing global consumption of alcoholic beverages remains a primary driver of the Extra Neutral Alcohol market. Urbanization and changing lifestyles increase demand for spirits and ready-to-drink products. ENA serves as a key base for vodka, gin, whisky blends, and flavored spirits. Premiumization trends encourage distillers to use high-purity alcohol for product differentiation. Expansion of craft distilleries further supports demand growth. Regulatory approvals for food-grade alcohol strengthen market stability. Rising disposable income in emerging economies boosts consumption volumes. This driver sustains consistent demand across developed and developing regions.
- For instance, Diageo produces significant volumes of spirits through its premium Smirnoff and Gordon’s brands, which rely on high-quality Extra Neutral Alcohol (ENA). The continued expansion of craft distilleries further supports global demand growth for this essential base spirit.
Expansion of Pharmaceutical and Healthcare Applications
Healthcare sector growth supports Extra Neutral Alcohol market expansion. ENA is widely used in pharmaceutical formulations, cough syrups, and antiseptic products. Rising healthcare expenditure increases production of medicinal liquids. Demand for sanitizers and disinfectants supports steady consumption. Pharmaceutical manufacturers prefer ENA for purity and compliance with quality standards. Growth in generic drug production strengthens long-term demand. Hospital and healthcare infrastructure expansion also contributes. This driver diversifies ENA demand beyond beverage applications. Healthcare-driven usage ensures market resilience during consumption fluctuations.
- For instance, Dr. Reddy’s Laboratories expanded its pharmaceutical manufacturing capacity and bolstered its portfolio of complex generics and biosimilars to meet growing global healthcare demands.
Growth of Distillation Capacity and Alcohol Manufacturing
Investment in distillation infrastructure drives Extra Neutral Alcohol market growth. Producers expand capacity to meet rising domestic and export demand. Government policies supporting ethanol and alcohol production encourage capacity additions. Improved fermentation and distillation technologies enhance yield efficiency. Large-scale facilities reduce production costs and improve consistency. Strategic location near raw material sources supports supply stability. Expansion of alcohol manufacturing strengthens downstream availability. This driver supports long-term supply security and market scalability.
Key Trends & Opportunities
Premiumization of Spirits and Brand Differentiation
Premium spirits demand creates opportunities in the Extra Neutral Alcohol market. Consumers prefer high-quality, smooth-tasting alcoholic beverages. Brands use premium-grade ENA to enhance flavor neutrality and consistency. Craft and artisanal distillers focus on refined alcohol bases. Product innovation in flavored and specialty spirits supports higher ENA usage. Export demand for premium spirits also grows. This trend supports higher margins and value-added production. Premiumization encourages quality-focused sourcing strategies among producers.
- For instance, United Spirits exported premium brands to international markets by leveraging its portfolio of high-quality blends.
Rising Demand in Emerging Markets
Emerging economies present strong growth opportunities for the Extra Neutral Alcohol market. Rising income levels increase alcohol consumption. Urban retail expansion improves product accessibility. Growing pharmaceutical manufacturing supports healthcare-related ENA demand. Local production reduces import dependence. Government reforms in alcohol regulation support industry expansion. Population growth sustains long-term consumption potential. Emerging markets offer scale-driven growth prospects. This trend supports geographic diversification of ENA demand.
- For instance, Cargill supplies high-purity alcohol to beverage and healthcare clients, leveraging its global supply chain and production facilities to serve various international markets.
Key Challenges
Volatility in Raw Material Prices
Fluctuating prices of grains and sugarcane challenge the Extra Neutral Alcohol market. Agricultural output depends on weather and crop yields. Price volatility affects production costs and margins. Supply disruptions impact planning and inventory management. Producers face challenges in long-term pricing contracts. Regional dependence on specific crops increases risk exposure. Managing cost stability requires strategic sourcing. Raw material uncertainty remains a key operational challenge.
Stringent Regulations and Taxation Policies
Regulatory complexity poses challenges for the Extra Neutral Alcohol market. Alcohol production faces strict licensing and compliance requirements. High excise duties impact pricing and demand. Policy changes vary across regions and create uncertainty. Regulatory approvals increase operational costs. Distribution restrictions affect market reach. Compliance with pharmaceutical and food standards adds complexity. Navigating regulatory frameworks remains critical for sustained market participation.
Regional Analysis
Asia Pacific
Asia Pacific leads the Extra Neutral Alcohol market with a 44% market share, supported by large-scale alcohol production and consumption. India, China, and Southeast Asia drive demand through strong spirits manufacturing and growing pharmaceutical output. Rising population, urbanization, and expanding middle-class income increase alcohol consumption volumes. Sugarcane-based ENA production remains strong due to raw material availability. Government-regulated alcohol distribution supports stable demand patterns. Growth in generic drug manufacturing and sanitizer production further strengthens regional consumption. Continuous expansion of distillation capacity positions Asia Pacific as the primary growth engine for the market.
Europe
Europe holds a 27% share of the Extra Neutral Alcohol market, driven by mature alcoholic beverage industries. Countries such as Germany, France, and the United Kingdom maintain strong demand for ENA in spirits, liqueurs, and flavor extraction. Premium alcohol production supports consistent consumption of high-purity ENA. Strict quality standards favor grain-based sources. Pharmaceutical manufacturing also contributes to steady demand. Well-established regulatory frameworks ensure supply stability. Export-oriented spirits production strengthens regional relevance. Europe remains a key market for premium-grade and food-grade ENA applications.
North America
North America accounts for a 19% market share in the Extra Neutral Alcohol market, led by the United States. Strong demand from premium spirits, craft distilleries, and pharmaceutical applications supports market growth. Grain-based ENA dominates due to abundant corn and wheat supply. Healthcare sector expansion drives pharmaceutical-grade alcohol usage. Regulatory compliance and quality control shape production standards. Rising interest in flavored spirits and ready-to-drink beverages supports demand. Stable consumer spending and advanced distillation infrastructure ensure steady market performance across the region.
Latin America
Latin America represents a 6% share of the Extra Neutral Alcohol market, supported by sugarcane-based alcohol production. Brazil and neighboring countries benefit from strong sugarcane availability and ethanol infrastructure. ENA demand comes from both beverage production and pharmaceutical uses. Local spirits consumption supports steady volume growth. Export potential adds incremental demand. Regulatory frameworks vary across countries, influencing production scale. Growing urban populations and healthcare manufacturing improve long-term outlook. The region offers cost-efficient production advantages despite moderate consumption levels.
Middle East and Africa
The Middle East and Africa hold a 4% share of the Extra Neutral Alcohol market, reflecting selective consumption patterns. Pharmaceutical and healthcare applications drive most regional demand. Alcoholic beverage consumption remains limited due to regulatory restrictions. Growing healthcare infrastructure increases use of ENA in medicines and sanitizers. Import dependence shapes supply dynamics. Tourism-related demand supports limited beverage applications in select markets. Investment in healthcare manufacturing improves regional prospects. Long-term growth depends on regulatory evolution and pharmaceutical sector expansion.
Extra Neutral Alcohol Market Segmentations:
By Source
- Grain-based
- Sugarcane-based
By Grade
- Food grade
- Pharmaceutical grade
By Application
- Alcoholic beverages
- Pharmaceuticals and healthcare
By Geography
- North America
- U.S.
- Canada
- Mexico
- Europe
- Germany
- France
- U.K.
- Italy
- Spain
- Rest of Europe
- Asia Pacific
- China
- Japan
- India
- South Korea
- South-east Asia
- Rest of Asia Pacific
- Latin America
- Brazil
- Argentina
- Rest of Latin America
- Middle East & Africa
- GCC Countries
- South Africa
- Rest of the Middle East and Africa
Competitive Landscape
Competitive landscape analysis highlights a competitive and moderately fragmented Extra Neutral Alcohol market led by United Spirits Limited, Radico Khaitan Limited, Pernod Ricard, Diageo plc, Bacardi Limited, and MGP Ingredients, Inc. These players compete through scale, product purity, and strong sourcing networks. Leading producers focus on high-purity ENA to meet beverage and pharmaceutical standards. Capacity expansion and modernization of distillation facilities improve efficiency and consistency. Vertical integration across raw materials and processing enhances cost control. Long-term supply agreements with beverage brands support demand stability. Regional players leverage local feedstock advantages, especially grain and sugarcane availability. Quality compliance, regulatory adherence, and logistics strength shape competitive positioning. Smaller producers target niche grades and regional markets. Overall competition centers on purity, volume reliability, regulatory compliance, and alignment with premium alcohol and healthcare demand trends.
Key Player Analysis
- United Spirits Limited
- Radico Khaitan Limited
- Pernod Ricard
- Diageo plc
- Bacardi Limited
- Cargill, Incorporated
- MGP Ingredients, Inc.
- Manildra Group
- Cristalco Group
- Godavari Biorefineries Limited
Recent Developments
- In December 2025, Pernod Ricard launched a new premium spirits range called Seagram’s Xclamat!on, aiming to boost growth in modern spirits categories.
- In November 2025, Diageo India published its Spirit of Progress ESG report outlining sustainability goals tied to its grain-to-glass strategy, including responsible supply chain initiatives.
Report Coverage
The research report offers an in-depth analysis based on Source, Grade, Application and Geography. It details leading market players, providing an overview of their business, product offerings, investments, revenue streams, and key applications. Additionally, the report includes insights into the competitive environment, SWOT analysis, current market trends, as well as the primary drivers and constraints. Furthermore, it discusses various factors that have driven market expansion in recent years. The report also explores market dynamics, regulatory scenarios, and technological advancements that are shaping the industry. It assesses the impact of external factors and global economic changes on market growth. Lastly, it provides strategic recommendations for new entrants and established companies to navigate the complexities of the market.
Future Outlook
- Alcoholic beverage production will remain the primary demand driver for Extra Neutral Alcohol.
- Premium spirits consumption will increase usage of high-purity Extra Neutral Alcohol.
- Distillers will continue expanding capacity to meet domestic and export demand.
- Food grade Extra Neutral Alcohol will maintain dominance across applications.
- Pharmaceutical and healthcare usage will support stable baseline demand.
- Emerging markets will contribute incremental volume growth.
- Process efficiency improvements will enhance production consistency and yields.
- Raw material sourcing strategies will gain importance for cost control.
- Regulatory compliance will shape production and distribution practices.
- Product diversification will strengthen long-term Extra Neutral Alcohol market stability.
Request a Free Sample
Fill in your details and we'll send you a free sample report.
- Sample data tables & charts
- Research methodology
Need a Custom Version of This Report?
Tailor the scope, geography, or segments to your exact requirements.
- Custom geography or segment scope
- Direct access to our analyst team
Frequently Asked Questions
What is the current market size for Extra Neutral Alcohol market, and what is its projected size in 2032?
At what Compound Annual Growth Rate is the Extra Neutral Alcohol market projected to grow between 2024 and 2032?
Which Extra Neutral Alcohol market segment held the largest share in 2024?
What are the primary factors fueling the growth of the Extra Neutral Alcohol market?
Who are the leading companies in the Extra Neutral Alcohol market?
Which region commanded the largest share of the Extra Neutral Alcohol market in 2024?
Table of Content
Chapter 1. Report Introduction
- 1.1 Report Description & Purpose
- 1.1.1 Report Title & Market Definition
- 1.1.2 Unique Selling Propositions (USP) & Key Differentiators
- 1.1.3 Value Proposition for Stakeholders
- 1.2 Research Objectives
- 1.2.1 Market Sizing Objectives (Volume & Revenue)
- 1.2.2 Segmentation Objectives
- 1.2.3 Competitive Intelligence Objectives
- 1.2.4 Forecast & Scenario Objectives
- 1.3 Report Scope
- 1.3.1 Extra Neutral Alcohol Scope – Types & Subtypes Covered
- 1.3.2 Geographic Scope – Regions & Countries Covered
- 1.3.3 Historical Period, Base Year & Forecast Period (2024; forecast to 2032)
- 1.3.4 Inclusions & Exclusions
- 1.4 HS Code & Classification Framework
- 1.5 Currency, Units & Pricing Basis
- 1.6 Target Stakeholders
- 1.7 Limitations & Assumptions
Chapter 2. Executive Summary
- 2.1 Global Extra Neutral Alcohol Market Snapshot
- 2.1.1 Market Size – Historical (2024) & Forecast (2024-2032) (2024: USD 105394.5 million → 2032: USD 135598.7 million)
- 2.1.2 Volume & Revenue – Global Totals
- 2.1.3 Key Market Highlights – Top Five Facts
- 2.2 Extra Neutral Alcohol Market Segmentation Snapshot
- 2.2.1 Market Split by Region – 2024 vs. 2032
- 2.3 Competitive Snapshot
- 2.3.1 Top 10 Players by Revenue Share – 2024
- 2.3.2 Top 10 Players by Volume Share – 2024
- 2.3.3 Recent Strategic Developments (18-Month Summary)
- 2.4 Key Investment Highlights & Strategic Conclusions
Chapter 3. Extra Neutral Alcohol Market Dynamics & Industry Analysis
- 3.1 Market Overview & Context
- 3.1.1 Extra Neutral Alcohol Market Position in the Broader Automotive Value Chain
- 3.1.2 OEM vs. Replacement Market Dynamics
- 3.1.3 Market Maturity & Development Stage by Region
- 3.2 Extra Neutral Alcohol Market Drivers
- 3.3 Extra Neutral Alcohol Market Restraints & Challenges
- 3.4 Extra Neutral Alcohol Market Opportunities
- 3.5 Porter's Five Forces Analysis
- 3.5.1 Threat of New Entrants
- 3.5.2 Bargaining Power of Suppliers
- 3.5.3 Bargaining Power of Buyers
- 3.5.4 Threat of Substitutes
- 3.5.5 Competitive Rivalry – Intensity Assessment
- 3.6 Extra Neutral Alcohol Value Chain Analysis
- 3.6.1 Upstream – Raw Material/Input Suppliers
- 3.6.1.1 Raw Material/Input 1
- 3.6.1.2 Raw Material/Input 2
- 3.6.1.3 Raw Material/Input 3
- 3.6.2 Midstream – Production/Manufacturing/Service Delivery
- 3.6.2.1 Production/Process Overview
- 3.6.2.2 Key Facility Locations & Capacity by Manufacturer
- 3.6.3 Downstream – Distribution & End Consumer
- 3.6.3.1 Primary Channel – B2B/OEM
- 3.6.3.2 Secondary Channels – Dealer, Retail, Online, Direct
- 3.6.4 Value Chain Profitability Analysis
- 3.6.1 Upstream – Raw Material/Input Suppliers
- 3.7 PESTEL Analysis
- 3.7.1 Political Factors
- 3.7.2 Economic Factors
- 3.7.3 Social Factors
- 3.7.4 Technological Factors
- 3.7.5 Environmental Factors
- 3.7.6 Legal Factors
- 3.8 Extra Neutral Alcohol Supply Chain Analysis
- 3.8.1 Raw Material/Input Supply Risk Assessment
- 3.8.2 Manufacturing Concentration Risk (Geographic Exposure)
- 3.8.3 Trade Disruption Impact Analysis
- 3.9 Regulatory & Policy Landscape
Note: The regulatory and policy landscape section covers regulations based on their applicability to the market, Extra Neutral Alcohol category, geography, and scope of the study. Only regulatory frameworks with a material impact on operations, compliance, trade, sustainability, or market access are analyzed in detail.
Chapter 4. Key Investment Pockets & Opportunity Analysis
- 4.1 Extra Neutral Alcohol Market Attractiveness Analysis
- 4.1.1 By Region – Investment Attractiveness Matrix (Volume × CAGR)
- 4.2 Absolute Revenue Growth Opportunity
- 4.2.1 By Region – Absolute USD Growth Through 2032
- 4.3 Incremental Volume Opportunity
- 4.3.1 By Region – Incremental Volume Through 2032
- 4.3.2 Segment – Incremental Volume
- 4.4 Emerging Submarket Opportunity Deep Dive (Subject to Applicability)
- 4.5 Emerging Market Opportunity Scorecards
- 4.5.1 United States
- 4.5.2 Europe
- 4.5.3 Asia
- 4.5.4 Middle East & Africa
Note: Emerging Market Opportunity Scorecards will be included based on relevance and strategic importance. Regions listed are indicative and may vary depending on data availability and market dynamics.
Chapter 5. Extra Neutral Alcohol Import-Export Analysis & Trade Flows
- 5.1 Global Trade Overview
- 5.1.1 Global Export Value by Country (2024)
- 5.1.2 Global Export Volume by Country (2024)
- 5.1.3 Global Import Value by Country (2024)
- 5.1.4 Global Import Volume by Country (2024)
- 5.1.5 Net Trade Balance by Country (2024)
- 5.2 Export Analysis – Segment
- 5.2.1 Type 1 (HS Code)
- 5.2.2 Type 2 (HS Code)
- 5.2.3 Type 3 (HS Code)
- 5.2.4 Type 4 (HS Code)
- 5.2.5 Type 5 (HS Code)
- 5.3 Import Analysis – Segment
- 5.3.1 Type 1 (HS Code)
- 5.3.2 Type 2 (HS Code)
- 5.3.3 Type 3 (HS Code)
- 5.3.4 Type 4 (HS Code)
- 5.3.5 Type 5 (HS Code)
- 5.4 Average Unit Trade Prices
- 5.4.1 Average Export Price – Segment & Country
- 5.4.2 Average Import Price – Segment & Source Country
- 5.4.3 Price Trends (2024)
- 5.5 Key Trade Route Analysis
- 5.5.1 Trade Route 1
- 5.5.2 Trade Route 2
- 5.5.3 Trade Route 3
- 5.5.4 Trade Route 4
- 5.5.5 Trade Route 5
- 5.6 Trade Policy Impact Assessment
- 5.6.1 US Anti-Dumping & Section 301 Tariffs
- 5.6.2 EU Customs Union Impact
- 5.6.3 Major Free Trade Agreements
- 5.6.4 USMCA Rules of Origin
Note: Trade policy analysis will be included only where relevant to the Extra Neutral Alcohol market.
Chapter 6. Competitive Landscape & Company Benchmarking
- 6.1 Extra Neutral Alcohol Market Concentration & Structure
- 6.1.1 Herfindahl-Hirschman Index (HHI) – vs. 2024
- 6.1.2 Tier 1, Tier 2 & Tier 3 Market Structure
- 6.1.3 Global, Regional & Local Player Dynamics
- 6.2 Extra Neutral Alcohol Market Share Analysis – 2024
- 6.2.1 Global Revenue Share by Company
- 6.2.2 Global Volume Share by Company
- 6.2.3 Regional Revenue Share
- 6.2.4 Market Share Evolution ( vs. 2024)
- 6.2.5 OEM Segment Share by Company
- 6.2.6 Replacement Segment Share by Company
- 6.3 Production/Delivery Capacity & Facility Analysis
- 6.3.1 Global Installed Capacity
- 6.3.2 Capacity Utilization Rates
- 6.3.3 Production/Output Volume
- 6.3.4 Facility Locations & Capacity Map
- 6.3.5 Planned Capacity Additions
- 6.4 Extra Neutral Alcohol Competitive Benchmarking Matrix
- 6.4.1 Revenue, Volume, CAGR & Profitability Comparison
- 6.4.2 Channel Revenue Mix
- 6.4.3 Geographic Revenue Exposure
- 6.4.4 R&D Intensity
- 6.4.5 Sustainability Maturity
- 6.5 Strategic Developments in Extra Neutral Alcohol (Last 24 Months)
- 6.5.1 Mergers, Acquisitions & Divestments
- 6.5.2 New Extra Neutral Alcohol Launches
- 6.5.3 Facility Expansions
- 6.5.4 Strategic Alliances, Joint Ventures & Partnerships
- 6.5.5 Distribution Expansion & Market Entry
- 6.5.6 Sustainability & ESG Initiatives
- 6.6 Competitive Strategy Mapping
- 6.6.1 Leader, Challenger, Follower & Niche Classification
- 6.6.2 Pricing Strategy Comparison
- 6.6.3 Channel Strategy Matrix
Note: Strategic developments are included based on their materiality and the availability of reliable information.
Chapter 7. Global Extra Neutral Alcohol Market – By Distribution Channel
- 7.1 Segment Overview
- 7.1.1 Volume & Revenue Split by Channel (2024 & 2032)
- 7.1.2 Channel Mix Evolution (2024-2032)
Chapter 8. Regional Market Analysis – Global Overview
- 8.1 Global Regional Overview
- 8.1.1 Regional Volume Share
- 8.1.2 Regional Revenue Share
- 8.1.3 Regional Volume by Region
- 8.1.4 Regional Revenue by Region
- 8.1.5 Regional Forecast Through 2032
- 8.2 Cross-Regional Segment Analysis
- 8.2.1 By Distribution Channel
- 8.2.2 By Brand/Price Tier
Chapter 9. North America Extra Neutral Alcohol Market
- 9.1 United States
- 9.2 Canada
- 9.3 Mexico
Chapter 10. Europe Extra Neutral Alcohol Market
- 10.1 Germany
- 10.2 France
- 10.3 Italy
- 10.4 United Kingdom
- 10.5 Spain
- 10.6 Poland
- 10.7 Russia
- 10.8 Netherlands
- 10.9 Belgium
- 10.10 Sweden
- 10.11 Denmark
- 10.12 Norway
- 10.13 Rest of Europe
Chapter 11. Asia Pacific Extra Neutral Alcohol Market
- 11.1 China
- 11.2 India
- 11.3 Japan
- 11.4 South Korea
- 11.5 Thailand
- 11.6 Indonesia
- 11.7 Vietnam
- 11.8 Malaysia
- 11.9 Australia
- 11.10 Rest of Asia Pacific
Chapter 12. Latin America Extra Neutral Alcohol Market
- 12.1 Brazil
- 12.2 Argentina
- 12.3 Colombia
- 12.4 Chile
- 12.5 Rest of Latin America
Chapter 13. Middle East Extra Neutral Alcohol Market
- 13.1 Saudi Arabia
- 13.2 United Arab Emirates
- 13.3 Turkey
- 13.4 Israel
- 13.5 Iran
- 13.6 Rest of the Middle East
Chapter 14. Africa Extra Neutral Alcohol Market
- 14.1 South Africa
- 14.2 Egypt
- 14.3 Nigeria
- 14.4 Morocco
- 14.5 Rest of Africa
Chapter 15. Extra Neutral Alcohol Company Profiles
- 15.1 [Company 01]
- 15.1.1 Company Overview
- 15.1.2 Key Management Personnel
- 15.1.3 Products & Services Portfolio
- 15.1.4 Financial Performance
- 15.1.5 Key Market Focus & Geographic Presence
- 15.1.6 Recent Developments & Strategic Initiatives
Note: The company profile list is preliminary and may change based on research findings, market developments, data availability, and client requirements.
Chapter 16. Appendices
- Appendix A – List of Abbreviations & Acronyms
- Appendix B – Industry Classification Code Reference – Full Series
- Appendix C – Production & Capacity Data Tables
- Appendix D – End-Use & Demand Base Tables
- Appendix E – Consumption & Replacement Rate Assumptions
- Appendix F – ASP Reference Tables
- Appendix G – Manufacturing & Facility Database
- Appendix H – Import-Export Data Tables
- Appendix I – Regulatory Summary Tables
- Appendix J – Primary Research Participant List (Anonymized)
- Appendix K – Primary Research Questionnaire Framework
- Appendix L – Data Sources & Bibliography
- Appendix M – Market Size Divergence & Source Comparison
Chapter 17. Research Methodology
- 17.1 Research Framework & Philosophy
- 17.2 Secondary Research – Sources, Hierarchy & Data Extraction
- 17.3 Data Modeling – Bottom-Up & Top-Down Market Sizing
- 17.4 Primary Research – Stakeholder Framework, LOI & Sample Sizes
- 17.5 Forecast Methodology – Regression, Scenario & Sensitivity Analysis
- 17.6 Quality Control – Four-Layer Validation Framework
- 17.7 Limitations & Standard Assumptions
- 17.8 Disclaimer
