
Glycolic Acid Market Overview:
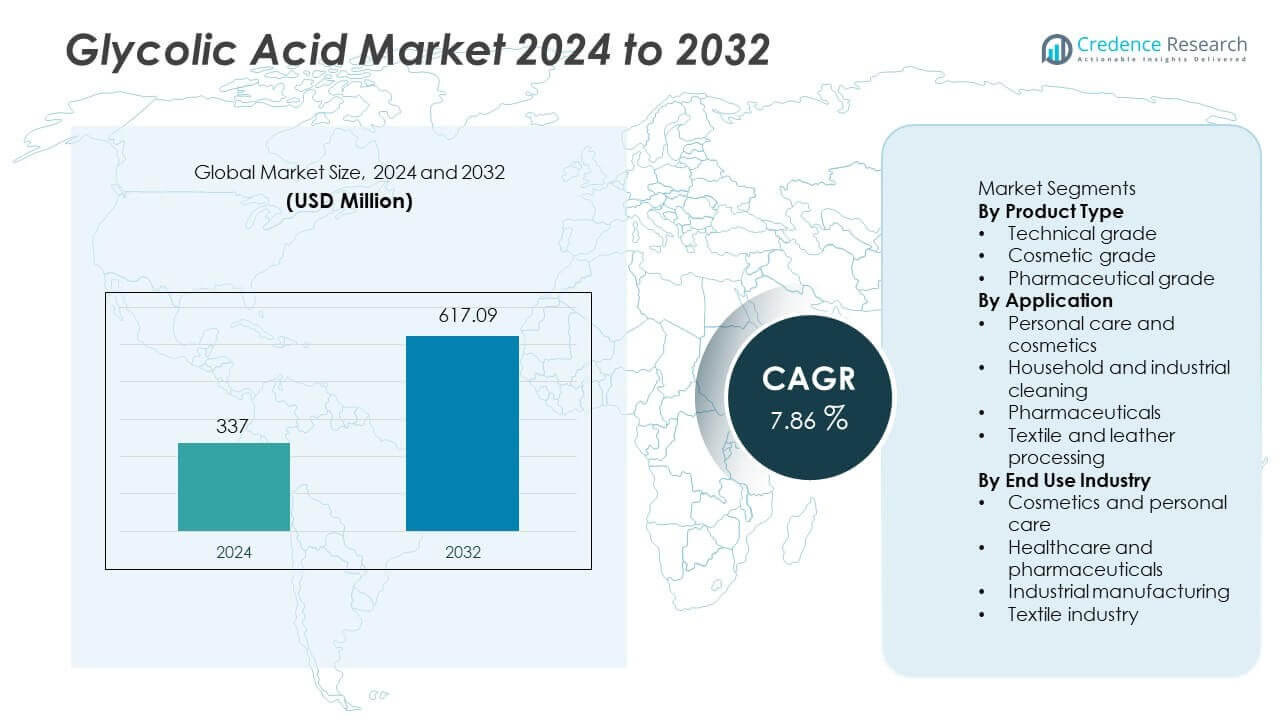
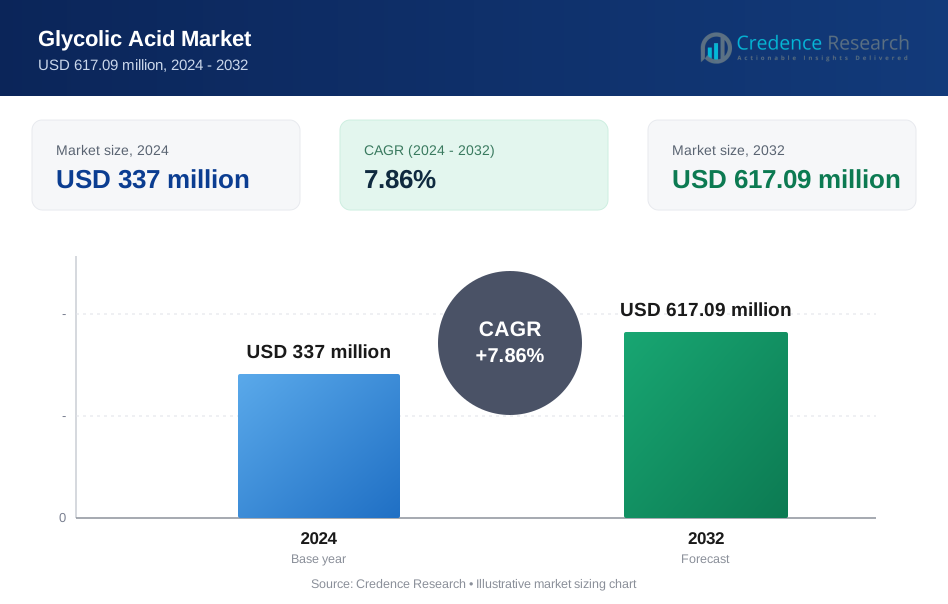
The glycolic acid market was valued at USD 337 million in 2024 and is anticipated to reach USD 617.09 million by 2032, registering a CAGR of 7.86% during the forecast period. (Credence Research)
| REPORT ATTRIBUTE | DETAILS |
|---|---|
| Historical Period | 2020-2023 |
| Base Year | 2024 |
| Forecast Period | 2025-2032 |
| Glycolic Acid Market Size 2024 | USD 337 million |
| Glycolic Acid Market, CAGR | 7.86% |
| Glycolic Acid Market Size 2032 | USD 617.09 million |
The glycolic acid market is led by major chemical manufacturers including BASF SE, Chemours Company, CABB Group GmbH, Sinopec, Zhonglan Industry Co., Ltd., Mehul Dye Chem Industries, Shandong Tongcheng Medicine Co., Ltd., Tokyo Chemical Industry Co., Ltd., Merck KGaA, and Arkema SA. These players compete through product purity, scale, and application-specific grades across cosmetics, pharmaceuticals, and industrial uses. Asia Pacific leads the market with a 41% share, supported by large-scale cosmetics manufacturing and industrial demand in China, India, Japan, and South Korea. North America follows with a 26% share, driven by strong skincare consumption and regulated pharmaceutical applications. Europe holds a 23% share, supported by premium cosmetics production and strict quality standards across major economies.
Glycolic Acid Market Insights
- The glycolic acid market was valued at USD 337 million in 2024 and is projected to reach USD 617.09 million by 2032, registering a CAGR of 7.86% during the forecast period.
- Strong demand from cosmetics and personal care drives growth, with cosmetic grade glycolic acid leading product types at a 46% share due to widespread use in skincare formulations.
- Market trends highlight rising use in dermatology and clean-label cleaning products, while personal care and cosmetics dominate applications with a 42% share.
- Competition remains moderate, with leading players focusing on high-purity grades, cost efficiency, and long-term supply agreements to strengthen customer retention.
- Asia Pacific leads with a 41% share, followed by North America at 26% and Europe at 23%, supported by cosmetics manufacturing strength, regulated healthcare use, and industrial demand.
Glycolic Acid Market Segmentation Analysis:
By Product Type
Cosmetic grade glycolic acid dominates the product type segment with a 46% market share. This leadership is driven by strong demand from skincare and personal care formulations. Cosmetic manufacturers use glycolic acid for exfoliation, skin renewal, and anti-aging products. Rising consumer focus on dermatological treatments supports sustained usage. High purity requirements favor cosmetic grade products over technical alternatives. Pharmaceutical grade holds a 29% share, supported by controlled drug formulations. Technical grade accounts for the remaining demand, mainly used in industrial and cleaning applications where purity standards are lower.
- For instance, BASF supplies cosmetic grade glycolic acid with a molecular weight of 76.05 g/mol and a melting point near 75 °C.
By Application
Personal care and cosmetics lead the application segment with a 42% market share. Glycolic acid is widely used in chemical peels, creams, and serums due to its small molecular size. Growing demand for active skincare ingredients drives adoption. Household and industrial cleaning holds a 26% share, supported by descaling and surface cleaning applications. Pharmaceutical applications account for a 19% share, driven by topical treatments. Textile and leather processing represents niche demand, using glycolic acid for dyeing and finishing processes.
- For instance, Chemours produces glycolic acid with a pKa value of 3.83, supporting effective exfoliation chemistry.
By End Use Industry
Cosmetics and personal care dominate the end use industry segment with a 44% market share. Strong growth in skincare routines and premium beauty products supports this dominance. Brands emphasize glycolic acid for visible skin benefits and product differentiation. Healthcare and pharmaceuticals hold a 28% share, driven by dermatology-focused treatments. Industrial manufacturing contributes a 17% share through cleaning and chemical processing needs. The textile industry accounts for the remaining demand, supported by fabric treatment and finishing applications in developing manufacturing regions.
Key Growth Drivers
Rising Demand from Cosmetics and Personal Care Industry
The cosmetics and personal care sector remains a major growth driver for the glycolic acid market. Glycolic acid is widely used in skincare products for exfoliation and skin renewal. Growing consumer awareness of active ingredients supports higher usage. Demand increases for anti-aging and acne treatment formulations. Premium beauty brands integrate glycolic acid into serums and peels. Expanding e-commerce platforms improve product access. Innovation in dermatology-focused formulations further boosts demand. Strong growth in beauty and wellness spending sustains long-term market expansion.
- For instance, L'Oréal utilizes alpha hydroxy acids across several of its global skincare brands, incorporating these ingredients into numerous formulations developed by its international research and innovation teams.
Expanding Use in Pharmaceutical and Dermatology Applications
Pharmaceutical and dermatology applications drive steady market growth. Glycolic acid supports controlled drug delivery and topical treatments. Dermatologists use it in chemical peels and skin therapies. Rising incidence of skin disorders increases treatment demand. Pharmaceutical-grade glycolic acid meets strict purity standards. Hospitals and clinics adopt advanced dermatological solutions. Research in dermatology formulations expands clinical use cases. This medical relevance strengthens market stability and demand consistency.
- For instance, Merck KGaA supplies pharmaceutical-grade glycolic acid with purity exceeding 99.5 g per 100 g.
Growth in Industrial Cleaning and Chemical Processing Applications
Industrial demand supports glycolic acid market growth. The compound is used in descaling and surface cleaning solutions. Manufacturing facilities prefer glycolic acid for effective residue removal. Demand increases from food processing and metal cleaning industries. Eco-friendly cleaning solutions gain preference over harsh chemicals. Regulatory pressure supports biodegradable cleaning agents. Glycolic acid fits sustainability goals. Industrial adoption diversifies revenue streams and reduces reliance on cosmetic demand.
Key Trends & Opportunities
Innovation in High-Purity and Sustainable Production Processes
Manufacturers invest in improved production technologies. High-purity glycolic acid supports cosmetic and pharmaceutical applications. Process optimization improves yield and consistency. Sustainable production methods reduce environmental impact. Bio-based feedstock development creates growth opportunities. Brands prefer suppliers with sustainable practices. Regulatory focus on green chemicals supports innovation. These advancements improve competitiveness and expand application potential.
- For instance, CABB Group operates dedicated glycolic acid facilities producing pharmaceutical-grade material with purity levels of 99.8 g per 100 g.
Rising Demand in Emerging Markets
Emerging economies present strong growth opportunities. Rising disposable income increases skincare consumption. Expanding manufacturing activities drive industrial demand. Local cosmetic brands adopt glycolic acid formulations. Healthcare infrastructure improvements support dermatology services. Distribution expansion improves market reach. Growing awareness of personal care products supports adoption. Emerging markets offer long-term volume growth potential.
- For instance, Zhonglan Industry operates large-scale glycolic acid production lines in China, with significant storage capacity to ensure a stable supply for a variety of global industries. The company is a professional manufacturer and a leader in supplying glyoxal and glyoxylic acid products in the region.
Key Challenges
Volatility in Raw Material Prices
Raw material price fluctuations challenge market stability. Feedstock availability impacts production costs. Manufacturers face margin pressure during price swings. Cost uncertainty affects long-term supply contracts. Smaller producers face higher operational risks. Price volatility influences product pricing strategies. Managing cost efficiency remains critical. These challenges require strong procurement and supply planning.
Regulatory Restrictions and Safety Concerns
Regulatory scrutiny affects glycolic acid usage limits. Concentration restrictions impact cosmetic formulations. Compliance requirements increase development timelines. Safety labeling regulations vary by region. Manufacturers must invest in testing and documentation. Non-compliance risks product recalls and penalties. Regulatory complexity limits rapid market entry. Continuous compliance management remains essential for sustainable growth.
Regional Analysis
North America
North America holds a 26% market share in the glycolic acid market, supported by strong demand from cosmetics, pharmaceuticals, and industrial cleaning sectors. The United States leads regional consumption due to high penetration of skincare products containing active ingredients. Well-established personal care brands drive steady cosmetic grade demand. Pharmaceutical applications benefit from advanced dermatology practices and regulated drug manufacturing. Industrial usage remains stable in metal cleaning and food processing. Strong regulatory oversight ensures product quality and safety. Continuous product innovation and high consumer awareness sustain regional market growth.
Europe
Europe accounts for a 23% market share, driven by strong cosmetics manufacturing and strict quality standards. Countries such as France, Germany, and the United Kingdom lead demand through premium skincare and dermatology products. Regulatory emphasis on safe ingredient concentrations supports controlled glycolic acid usage. Pharmaceutical applications contribute steadily due to advanced healthcare systems. Industrial demand arises from textile processing and surface treatment applications. Sustainability initiatives encourage biodegradable chemical adoption. Presence of established cosmetic brands and contract manufacturers supports consistent regional consumption.
Asia Pacific
Asia Pacific leads the glycolic acid market with a 41% share, driven by expanding cosmetics production and industrial growth. China, India, South Korea, and Japan contribute significantly to regional demand. Rising disposable income boosts skincare product consumption. Local and global beauty brands expand manufacturing capacities across the region. Pharmaceutical and dermatology applications grow with improving healthcare access. Industrial usage increases in textile, leather, and chemical processing industries. Cost-effective production and raw material availability further strengthen Asia Pacific’s market leadership.
Rest of the World
Rest of the World holds an 10% market share, supported by growing industrial and personal care demand. Latin America shows rising consumption due to expanding cosmetic manufacturing. The Middle East benefits from increased import of skincare products. Africa records gradual growth through industrial cleaning and textile applications. Limited local production increases dependence on imports. Improving consumer awareness supports cosmetic usage. Infrastructure development supports industrial demand. Market growth remains steady, supported by expanding distribution networks and gradual regulatory alignment.
Glycolic Acid Market Segmentations:
By Product Type
- Technical grade
- Cosmetic grade
- Pharmaceutical grade
By Application
- Personal care and cosmetics
- Household and industrial cleaning
- Pharmaceuticals
- Textile and leather processing
By End Use Industry
- Cosmetics and personal care
- Healthcare and pharmaceuticals
- Industrial manufacturing
- Textile industry
By Geography
- North America
- U.S.
- Canada
- Mexico
- Europe
- Germany
- France
- U.K.
- Italy
- Spain
- Rest of Europe
- Asia Pacific
- China
- Japan
- India
- South Korea
- South-east Asia
- Rest of Asia Pacific
- Latin America
- Brazil
- Argentina
- Rest of Latin America
- Middle East & Africa
- GCC Countries
- South Africa
- Rest of the Middle East and Africa
Competitive Landscape
Competitive landscape or analysis includes BASF SE, Chemours Company, CABB Group GmbH, Sinopec, Zhonglan Industry Co., Ltd., Mehul Dye Chem Industries, Shandong Tongcheng Medicine Co., Ltd., Tokyo Chemical Industry Co., Ltd., Merck KGaA, and Arkema SA. These players compete through product purity, production scale, and application-specific grades. Leading manufacturers focus on expanding cosmetic and pharmaceutical grade offerings to meet rising skincare and dermatology demand. Cost efficiency and supply reliability remain critical competitive factors. Companies invest in process optimization to improve yield and consistency. Strategic partnerships with cosmetic and pharmaceutical formulators strengthen downstream integration. Geographic expansion targets Asia Pacific due to strong demand growth. Regulatory compliance and quality certifications support market credibility. Competitive intensity remains moderate, shaped by industrial scale advantages and long-term customer relationships.
Key Player Analysis
- BASF SE
- Chemours Company
- CABB Group GmbH
- China Petroleum & Chemical Corporation (Sinopec)
- Zhonglan Industry Co., Ltd.
- Mehul Dye Chem Industries
- Shandong Tongcheng Medicine Co., Ltd.
- Tokyo Chemical Industry Co., Ltd.
- Merck KGaA
- Arkema SA
Recent Developments
- In April 2025, BASF SE expanded its natural-based personal care ingredient portfolio at in-cosmetics Global 2025. The launch included new sustainable formulations supporting eco-friendly skincare applications.
- In March 2025, BASF SE published its Care Chemicals Responsible Sourcing Report 2024, showing progress in sustainability and supply chain practices relevant to personal care raw materials.
- In July 2024, BASF SE achieved ISCC+ certification across major acrylics, alcohols, glycol ethers, and acetate production sites. That step enables more products with sustainability attributes useful for formulations including glycolic acid derivatives.
Report Coverage
The research report offers an in-depth analysis based on Product Type, Application, End Use Industry and Geography. It details leading market players, providing an overview of their business, product offerings, investments, revenue streams, and key applications. Additionally, the report includes insights into the competitive environment, SWOT analysis, current market trends, as well as the primary drivers and constraints. Furthermore, it discusses various factors that have driven market expansion in recent years. The report also explores market dynamics, regulatory scenarios, and technological advancements that are shaping the industry. It assesses the impact of external factors and global economic changes on market growth. Lastly, it provides strategic recommendations for new entrants and established companies to navigate the complexities of the market.
Future Outlook
- Demand from skincare and personal care products will continue to expand steadily.
- Cosmetic grade glycolic acid adoption will increase with active ingredient trends.
- Pharmaceutical applications will grow through dermatology and topical treatments.
- Manufacturers will focus on high-purity and consistent product quality.
- Sustainable and bio-based production methods will gain importance.
- Asia Pacific will remain the key growth engine for volume demand.
- Industrial cleaning and chemical processing usage will support diversification.
- Regulatory compliance will shape formulation and concentration limits.
- Strategic partnerships will strengthen supply chain stability.
- Innovation in formulation support will drive long-term market growth.
Request a Free Sample
Fill in your details and we'll send you a free sample report.
- Sample data tables & charts
- Research methodology
Need a Custom Version of This Report?
Tailor the scope, geography, or segments to your exact requirements.
- Custom geography or segment scope
- Direct access to our analyst team
Frequently Asked Questions
What is the current market size for the Glycolic Acid market, and what is its projected size in 2032?
At what Compound Annual Growth Rate is the Glycolic Acid market projected to grow between 2024 and 2032?
Which Glycolic Acid market segment held the largest share in 2024?
What are the primary factors fueling the growth of the Glycolic Acid market?
Who are the leading companies in the Glycolic Acid market?
Which region commanded the largest share of the Glycolic Acid market in 2024?
Table of Content
Chapter 1 Market Segmentation
- 1.1 Segmentation Framework
- 1.1.1 Product and Service Classification
- 1.1.2 Application and End-Use Classification
- 1.1.3 Technology and Solution Classification
- 1.1.4 Customer and Distribution Channel Classification
- 1.1.5 Geographic Segmentation
- 1.1.6 Market Segment Definitions and Boundaries
Chapter 2 Introduction
- 2.1 Report Objectives and Scope
- 2.2 Product Definition and Industry Terminology
- 2.3 Market Inclusions and Exclusions
- 2.4 Research Process
- 2.4.1 Primary Research and Expert Interviews
- 2.4.2 Secondary Research and Source Review
- 2.4.3 Top-Down and Bottom-Up Estimation
- 2.4.4 Data Triangulation and Verification
- 2.5 Market Size Measurement Basis
- 2.5.1 2024: USD 337 million → 2032: USD 617.09 million
- 2.6 Historical and Forecast Reference Periods
- 2.6.1 Base Year: 2024
- 2.6.2 Forecast Period: 2024-2032
- 2.7 Research Assumptions and Limitations
Chapter 3 Executive Summary
- 3.1 Market Snapshot and Key Findings
- 3.2 Base-Year Market Size, 2024
- 3.3 Forecast Market Size, 2032
- 3.4 Revenue and Volume Growth Outlook
- 3.5 Key Demand and Supply Indicators
- 3.6 Leading Market Segments
- 3.7 Fastest-Growing Market Opportunities
- 3.8 Regional Performance Highlights
- 3.9 Technology and Industry Transformation
- 3.10 Competitive Landscape Summary
- 3.11 Analyst View and Strategic Implications
Chapter 4 Global Glycolic Acid Market Trends and Developments
- 4.1 Historical Industry Development
- 4.2 Recent Market Trends and Developments
- 4.3 Demand and Customer Behavior Trends
- 4.4 Technology and Product Innovation
- 4.5 Artificial Intelligence, Automation and Digitalization
- 4.6 Local Manufacturing and Supply Chain Realignment
- 4.7 Industry Partnerships, Mergers and Acquisitions
- 4.8 Sustainability and Circular Economy Developments
- 4.9 Government and Private Sector Investment Trends
- 4.10 Emerging Business Models and Commercialization
- 4.11 Industry Developments and Announcements
Chapter 5 Global Glycolic Acid Market Production, Supply and Demand Analysis
- 5.1 Demand Trend and Consumption Analysis
- 5.2 Demand Forecast, 2024-2032
- 5.3 Production and Output Trend
- 5.4 Production and Output Forecast, 2024-2032
- 5.5 Installed Capacity and Capacity Utilization
- 5.6 Company-Wise Production Plants and Statistics
- 5.6.1 Installed Production Capacity
- 5.6.2 Actual Production
- 5.6.3 Planned Capacity and Expansion Targets
- 5.7 Supply Chain Structure and Procurement Trends
- 5.8 Supply-Demand Gap and Bottlenecks
- 5.9 Import Dependence and Sourcing Structure
- 5.10 Contract Manufacturing and Outsourcing
- 5.11 Regional Supply and Demand Concentration
Chapter 6 Global Glycolic Acid Market Pricing Analysis
- 6.1 Pricing Structure and Measurement
- 6.2 Historical Pricing Trends
- 6.3 Pricing Outlook, 2024-2032
- 6.4 Average Selling Price and Unit Economics
- 6.5 Pricing by Product and Market Segment
- 6.6 Geographic Pricing Differences
- 6.7 Key Input, Energy, Labor and Logistics Costs
- 6.8 Contract Pricing and Purchasing Models
- 6.9 Pricing Sensitivity and Competitive Positioning
- 6.10 Price, Margin and Profitability Implications
Chapter 7 Global Glycolic Acid Market Dynamics
- 7.1 Market Growth Drivers
- 7.1.1 Demand-Side Drivers
- 7.1.2 Technology and Innovation Drivers
- 7.1.3 Infrastructure and Investment Drivers
- 7.1.4 Regulatory and Policy Drivers
- 7.2 Market Restraints
- 7.2.1 Cost and Affordability Constraints
- 7.2.2 Technology and Adoption Barriers
- 7.2.3 Supply Chain and Operational Constraints
- 7.3 Market Challenges
- 7.3.1 Competitive Pressure and Margin Erosion
- 7.3.2 Skills, Infrastructure and Implementation Gaps
- 7.4 Emerging Market Opportunities
- 7.5 Market Dynamics Impact and Time-Horizon Assessment
Chapter 8 Global Glycolic Acid Value Chain Analysis
- 8.1 Industry Value Chain Overview
- 8.2 Upstream Suppliers and Critical Inputs
- 8.3 Technology and Component Providers
- 8.4 Manufacturing or Service Delivery
- 8.5 Distribution, Channel Partners and Integrators
- 8.6 Downstream Applications and End Users
- 8.7 Value Addition and Profit Pools
- 8.8 Vertical Integration and Outsourcing
- 8.9 Supplier Concentration and Risk
- 8.10 Supply Chain Localization and Resilience
Chapter 9 Global Glycolic Acid Market Regulations and Policies
- 9.1 Relevant Laws, Standards and Compliance Frameworks
- 9.2 Product, Service, Safety and Quality Requirements
- 9.3 Government Policies, Incentives and Subsidies
- 9.4 Imports, Exports and Trade Barriers
- 9.5 Public Procurement and Local Content Requirements
- 9.6 Environmental and Sustainability Compliance
- 9.7 Upcoming Policy Changes and Market Implications
Chapter 10 Global Glycolic Acid Market Hotspots and Opportunities
- 10.1 Market Opportunity Mapping and Growth Hotspots
- 10.2 High-Growth Applications and Customer Groups
- 10.3 Underserved Markets and White-Space Opportunities
- 10.4 Emerging Technology and Product Opportunities
- 10.5 New Capacity and Investment Hotspots
- 10.6 Market Entry and Expansion Opportunities
- 10.7 Distribution and Partnership Opportunities
- 10.8 Near-Term and Long-Term Commercial Potential
- 10.9 Opportunity Attractiveness and Execution Risks
Chapter 11 Global Glycolic Acid Market Outlook, 2024-2032
- 11.1 Market Size and Analysis
- 11.1.1 Revenue (Market Measurement: 2024: USD 337 million → 2032: USD 617.09 million)
- 11.1.2 Market Volume and Quantity Sold
- 11.1.3 Historical Market Size
- 11.1.4 Base-Year Market Size, 2024
- 11.2 Market Forecast, 2024-2032
- 11.2.1 Revenue Forecast to 2032
- 11.2.2 Volume Forecast to 2032
- 11.2.3 CAGR and Year-on-Year Growth
- 11.2.4 Incremental Revenue Opportunity
- 11.3 Forecast Assumptions and Scenario Analysis
- 11.3.1 Base-Case Forecast
- 11.3.2 Optimistic and Conservative Scenarios
- 11.3.3 Technology, Pricing and Policy Sensitivities
- 11.4 Market Attractiveness and Growth Outlook
Chapter 12 Global Glycolic Acid Market Segmentation and Outlook
- 12.1 Segmentation Summary and Market Shares, 2024
- 12.2 Largest and Fastest-Growing Segments
- 12.3 Segment Growth Comparison
- 12.4 Segment Attractiveness and Priority Matrix
Chapter 13 Global Glycolic Acid Geographic Market Outlook, 2024-2032
- 13.1 Regional Market Size and Share, 2024
- 13.2 Regional Market Forecast, 2024-2032
- 13.3 Regional Pricing, Production and Demand Differences
- 13.4 North America
- 13.4.1 United States
- 13.4.2 Canada
- 13.4.3 Mexico
- 13.5 Europe
- 13.5.1 Germany
- 13.5.2 France
- 13.5.3 Italy
- 13.5.4 United Kingdom
- 13.5.5 Spain
- 13.5.6 Poland
- 13.5.7 Russia
- 13.5.8 Netherlands
- 13.5.9 Belgium
- 13.5.10 Sweden
- 13.5.11 Denmark
- 13.5.12 Norway
- 13.5.13 Rest of Europe
- 13.6 Asia Pacific
- 13.6.1 China
- 13.6.2 India
- 13.6.3 Japan
- 13.6.4 South Korea
- 13.6.5 Thailand
- 13.6.6 Indonesia
- 13.6.7 Vietnam
- 13.6.8 Malaysia
- 13.6.9 Australia
- 13.6.10 Rest of Asia Pacific
- 13.7 Latin America
- 13.7.1 Brazil
- 13.7.2 Argentina
- 13.7.3 Colombia
- 13.7.4 Chile
- 13.7.5 Rest of Latin America
- 13.8 Middle East
- 13.8.1 Saudi Arabia
- 13.8.2 United Arab Emirates
- 13.8.3 Turkey
- 13.8.4 Israel
- 13.8.5 Iran
- 13.8.6 Rest of the Middle East
- 13.9 Africa
- 13.9.1 South Africa
- 13.9.2 Egypt
- 13.9.3 Nigeria
- 13.9.4 Morocco
- 13.9.5 Rest of Africa
- 13.10 Regional Investment, Policy and Supply Chain Differences
- 13.11 Regional Competitive Landscape
- 13.12 Geographic Growth Hotspots
Chapter 14 Global Glycolic Acid Technology, Innovation and Sustainability Outlook
- 14.1 Technology Landscape and Maturity
- 14.2 Product, Process and Service Innovation
- 14.3 AI, Automation and Digital Tools in the Industry
- 14.4 Technology Adoption and Performance Benchmarking
- 14.5 Innovation Pipeline and R&D Investment
- 14.6 Patent and Intellectual Property Trends
- 14.7 Energy Efficiency and Resource Management
- 14.8 Sustainability, Recycling and Circularity
- 14.9 Technology Roadmap, 2024-2032
- 14.10 Risks of Obsolescence and Technology Substitution
Chapter 15 Global Glycolic Acid Market Key Strategic Imperatives
- 15.1 Growth and Market Entry Priorities
- 15.2 High-Return Products and Segments
- 15.3 Pricing, Profitability and Cost Optimization
- 15.4 Technology Investment and Product Differentiation
- 15.5 Supply Chain Localization and Resilience
- 15.6 Distribution and Customer Acquisition
- 15.7 Partnership, Acquisition and Capacity Strategy
- 15.8 Regional Expansion Priorities
- 15.9 Short-, Medium- and Long-Term Actions
Chapter 16 Competition Outlook
- 16.1 Industry Competition Characteristics
- 16.2 Market Structure and Concentration
- 16.3 Market Share and Competitive Positioning, 2024
- 16.4 Company-Wise Revenue and Product Benchmarking
- 16.5 Production and Service Capacity Benchmarking
- 16.6 Technology, Pricing and Differentiation
- 16.7 Regional Footprint and Distribution Strength
- 16.8 Mergers, Acquisitions and Strategic Alliances
- 16.9 New Entrants and Competitive Threats
- 16.10 Porter's Five Forces and Industry Attractiveness
- 16.11 Competitive Outlook, 2024-2032
Chapter 17 Company Profiles
- 17.1 Company Coverage and Selection Criteria
- 17.2 Leading Market Participants – Standard Profile Structure
- 17.2.1 Business Description
- 17.2.2 Company Ownership and Geographic Presence
- 17.2.3 Product and Service Portfolio
- 17.2.4 Manufacturing and Operating Footprint
- 17.2.5 Production Capacity and Expansion Plans
- 17.2.6 Financial Performance and Investment
- 17.2.7 Market Share and Competitive Position
- 17.2.8 Technology and Innovation Capabilities
- 17.2.9 Strategic Alliances or Partnerships
- 17.2.10 Recent Developments
- 17.2.11 Growth Strategy and Outlook
- 17.3 Other Relevant Market Participants
Note: Every listed company is profiled on the structure shown under the first company. The company list is preliminary and may change based on research findings, market developments, data availability and client requirements.
Chapter 18 Disclaimer
- 18.1 Research and Forecast Disclaimer
- 18.2 Data Source and Estimation Limitations
Note: The depth of individual sections depends on data availability for this market. Volume, capacity, trade and other unit-based metrics are included where applicable.
