Carbon And Graphite Product Market Overview:
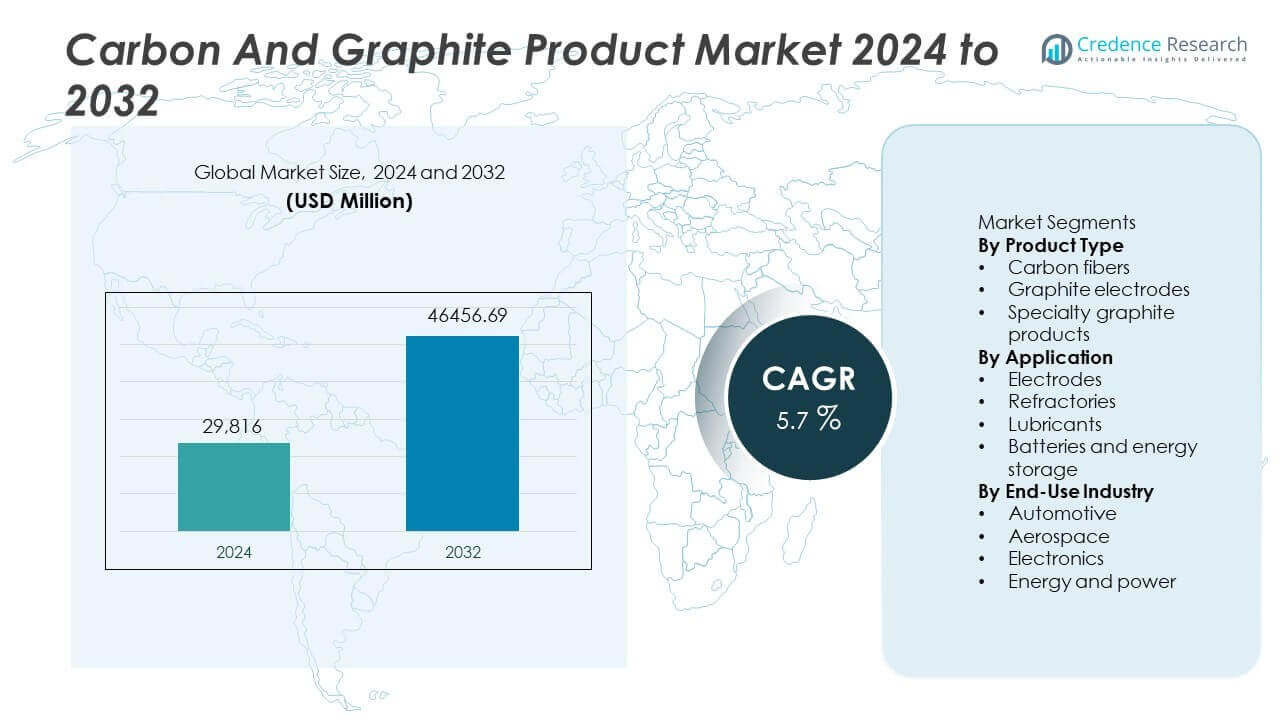
The carbon and graphite product market was valued at USD 29,816 million in 2024 and is expected to reach USD 46,456.69 million by 2032. The market is projected to grow at a CAGR of 5.7% during the forecast period.
| REPORT ATTRIBUTE | DETAILS |
|---|---|
| Historical Period | 2020-2023 |
| Base Year | 2024 |
| Forecast Period | 2025-2032 |
| Carbon And Graphite Product Market Size 2024 | USD 29,816 million |
| Carbon And Graphite Product Market, CAGR | 5.7% |
| Carbon And Graphite Product Market Size 2032 | USD 46,456.69 million |
The carbon and graphite product market features strong participation from leading players such as GrafTech International, SGL Carbon, Tokai Carbon, Showa Denko, Mitsubishi Chemical Group, HEG Limited, Graphite India Limited, Fangda Carbon New Material, Nippon Carbon, and Toyo Tanso. These companies compete through large-scale production capacity, product consistency, and long-term supply contracts with steelmakers and industrial users. Asia Pacific leads the market with a 38% share, driven by high steel output, battery manufacturing, and electronics production. North America follows with a 28% share, supported by electric arc furnace steelmaking and aerospace demand. Europe holds a 24% share, backed by automotive electrification and sustainable manufacturing initiatives.
Carbon And Graphite Product Market Insights
- The market reached USD 29,816 million in 2024 and is projected to grow at a CAGR of 5.7% during the forecast period, supported by steady industrial and energy demand.
- Rising electric arc furnace steel production and growing battery manufacturing drive demand for carbon and graphite products, with graphite electrodes leading the product type segment at a 41% share.
- Key trends include increased use of graphite in energy storage and electric vehicles, alongside growing adoption of specialty graphite for thermal and high-performance applications.
- The competitive landscape remains consolidated, with major players focusing on capacity expansion, long-term supply contracts, and technology upgrades to ensure product quality and cost efficiency.
- Asia Pacific leads with a 38% share, followed by North America at 28% and Europe at 24%, while raw material price volatility and environmental compliance act as key market restraints.
Carbon And Graphite Product Market Segmentation Analysis:
By Product Type
Graphite electrodes dominate the carbon and graphite product market with a 41% share. This leadership is driven by strong demand from electric arc furnace steel production. Rising steel recycling and shift toward electric steelmaking support electrode consumption. Graphite electrodes offer high thermal resistance and electrical conductivity. Steelmakers prefer these products for efficiency and lower emissions. Capacity expansions in emerging economies further strengthen demand. Carbon fibers follow, supported by lightweight material adoption. Specialty graphite products serve niche industrial uses. However, graphite electrodes remain the leading product type due to large-volume industrial applications and sustained steel industry demand.
- For instance, GrafTech International produces ultra-high-power graphite electrodes rated for furnace currents above 100,000 amperes.
By Application
Electrodes represent the dominant application segment with a 38% market share. This dominance is linked to extensive use in steelmaking and metallurgical processes. Growing electric arc furnace installations drive electrode consumption. High durability and conductivity make graphite ideal for electrode applications. Refractories follow due to use in high-temperature industrial furnaces. Batteries and energy storage applications grow steadily with EV adoption. Lubricants hold a smaller share, focused on industrial machinery. Despite diversification, electrode applications remain central. Strong industrial production and recycling trends continue to drive this segment’s leading position.
- For instance, Tokai Carbon supplies graphite electrodes that are made to last, designed for demanding operations in electric arc furnaces.
By End-Use Industry
Energy and power holds the largest share at 36% of the market. Demand is driven by power generation, grid infrastructure, and energy storage systems. Graphite materials support high-temperature and high-load applications. Growth in renewable energy and battery systems strengthens consumption. Automotive follows due to EV battery demand and lightweight materials. Electronics benefit from thermal management applications. Aerospace adopts carbon fibers for weight reduction. However, energy and power leads due to large-scale infrastructure needs. Rising global energy demand and electrification trends sustain this segment’s dominance.
Key Growth Drivers
Rising Demand from Electric Steelmaking and Metallurgy
Electric arc furnace steel production drives strong demand for carbon and graphite products. Graphite electrodes play a critical role in efficient steel recycling. Global focus on low-emission steelmaking supports electric furnace adoption. Expanding steel capacity in Asia Pacific further strengthens demand. High thermal resistance and electrical conductivity make graphite essential. Steel producers rely on consistent electrode quality for operational efficiency. Infrastructure and construction growth increase steel consumption. This industrial shift strongly supports market expansion. Continued recycling initiatives reinforce long-term demand. Electric steelmaking remains a core growth driver for the market.
- For instance, SGL Carbon produces electrodes capable of continuous operation at temperatures above 3,000 °C in electric arc furnaces.
Growth in Electric Vehicles and Energy Storage Systems
Electric vehicle production increases demand for graphite materials. Batteries require graphite for anodes and thermal management. Energy storage systems support renewable power integration. Governments promote EV adoption through incentives and regulations. Automotive manufacturers increase battery capacity investments. Carbon materials improve battery performance and lifespan. Grid-scale storage projects further expand consumption. This energy transition supports steady market growth. Battery technology innovation increases graphite intensity. Energy storage expansion strengthens long-term demand for carbon and graphite products.
- For instance, Mitsubishi Chemical Group supplies battery-grade graphite with particle sizes below 20 microns for lithium-ion anodes.
Expansion of High-Performance Industrial Applications
Advanced industries demand high-performance carbon materials. Aerospace and electronics require lightweight and heat-resistant solutions. Carbon fibers support weight reduction and fuel efficiency. Electronics use graphite for thermal management and conductivity. Industrial equipment relies on graphite for high-temperature operations. Manufacturing automation increases material performance requirements. Specialty graphite products serve precision applications. Rising industrial sophistication supports material innovation. Demand for durable and efficient materials grows steadily. High-performance applications drive product diversification and market growth.
Key Trends & Opportunities
Increasing Focus on Sustainable and Recycled Carbon Materials
Sustainability becomes a key trend in material selection. Manufacturers invest in recycled and low-emission graphite production. Steelmakers prefer suppliers with sustainable practices. Carbon recycling reduces raw material dependency. Environmental regulations encourage cleaner production processes. Sustainable materials support corporate ESG goals. This trend creates opportunities for innovation. Companies developing eco-friendly graphite gain competitive advantage. Long-term contracts favor compliant suppliers. Sustainability-focused development strengthens future market opportunities.
- For instance, HEG Limited implemented energy-efficient graphitization furnaces, leveraging advanced technology to improve process efficiency and enhance cost competitiveness within its operations.
Technological Advancements in Battery and Thermal Management Materials
Battery technology evolution increases demand for advanced graphite grades. High-purity graphite improves energy density and charging speed. Thermal management needs grow in electronics and EVs. Carbon materials support heat dissipation and safety. Manufacturers develop engineered graphite solutions. Customized materials meet specific performance needs. This innovation-driven demand creates new market opportunities. Collaboration between material suppliers and OEMs increases. Advanced applications enhance value-added offerings. Technology progress supports long-term market expansion.
- For instance, Toyo Tanso produces isotropic graphite with thermal conductivity above 120 W/m·K for battery cooling plates.
Key Challenges
Volatility in Raw Material Prices and Supply Constraints
Graphite production depends on natural and synthetic sources. Supply disruptions impact production costs. Price volatility affects profit margins. Limited high-quality graphite reserves increase sourcing risk. Geopolitical factors influence raw material availability. Manufacturers face challenges in cost planning. Supply chain disruptions affect delivery timelines. Dependence on specific regions increases vulnerability. Managing raw material risk remains critical. Price instability constrains consistent market growth.
Environmental and Regulatory Compliance Pressures
Carbon and graphite manufacturing involves energy-intensive processes. Environmental regulations tighten emission standards. Compliance increases operational costs. Waste management and energy use face scrutiny. Smaller producers struggle with regulatory investments. Approval delays impact project timelines. Global compliance differences complicate operations. Companies must invest in cleaner technologies. Regulatory pressure may limit capacity expansion. Compliance challenges remain a key restraint on market growth.
Regional Analysis
North America
North America holds a 28% share of the carbon and graphite product market, supported by strong demand from steelmaking, aerospace, and energy storage industries. The United States leads regional consumption due to advanced electric arc furnace capacity and growing electric vehicle production. Graphite demand increases from battery manufacturing and grid-scale energy storage projects. Aerospace applications drive carbon fiber consumption for lightweight structures. Strong R&D investment supports material innovation. Established supply chains and technological capabilities enhance production efficiency. Environmental regulations encourage adoption of high-quality graphite products. Continued investment in energy transition projects sustains regional market growth.
Europe
Europe accounts for a 24% share of the market, driven by strict environmental policies and strong industrial activity. Countries such as Germany, France, and Italy support demand through electric steelmaking and automotive manufacturing. Carbon and graphite products play a key role in battery production and renewable energy systems. Automotive electrification increases graphite usage in energy storage. Aerospace demand supports carbon fiber consumption. Regional focus on sustainability promotes recycled and low-emission materials. Strong regulatory frameworks encourage technology upgrades. Europe maintains stable growth through innovation and green manufacturing initiatives.
Asia Pacific
Asia Pacific leads the market with a 38% share, driven by large-scale steel production and rapid industrialization. China, Japan, South Korea, and India dominate regional demand. Extensive electric arc furnace operations increase graphite electrode consumption. Battery manufacturing growth supports graphite demand from electric vehicles. Expanding electronics production boosts specialty graphite usage. Government investments strengthen industrial infrastructure. Cost-effective manufacturing attracts global buyers. Regional suppliers expand capacity to meet rising demand. Strong export activity reinforces Asia Pacific’s dominant position in the global market.
Latin America
Latin America holds a 6% share of the market, supported by developing steel and energy sectors. Brazil and Mexico drive regional consumption through infrastructure and industrial projects. Graphite products support electric arc furnace steelmaking. Renewable energy expansion increases energy storage requirements. Local manufacturing capabilities remain limited but improving. Investment in mining and processing strengthens supply chains. Industrial modernization supports demand growth. Regulatory improvements enhance production standards. The region shows steady growth potential through infrastructure development and energy diversification.
Middle East & Africa
The Middle East and Africa account for a 4% share, reflecting an emerging market stage. Steel production and energy projects support demand for carbon and graphite products. Countries in the Gulf region invest in industrial diversification. Power generation and infrastructure development increase material consumption. Local production remains limited, relying on imports. Gradual investment in manufacturing capacity improves regional presence. Mining activity supports raw material availability in parts of Africa. Strategic infrastructure projects strengthen long-term growth potential.
Carbon And Graphite Product Market Segmentations:
By Product Type
- Carbon fibers
- Graphite electrodes
- Specialty graphite products
By Application
- Electrodes
- Refractories
- Lubricants
- Batteries and energy storage
By End-Use Industry
- Automotive
- Aerospace
- Electronics
- Energy and power
By Geography
- North America
- U.S.
- Canada
- Mexico
- Europe
- Germany
- France
- U.K.
- Italy
- Spain
- Rest of Europe
- Asia Pacific
- China
- Japan
- India
- South Korea
- South-east Asia
- Rest of Asia Pacific
- Latin America
- Brazil
- Argentina
- Rest of Latin America
- Middle East & Africa
- GCC Countries
- South Africa
- Rest of the Middle East and Africa
Competitive Landscape
Competitive landscape analysis highlights a competitive market led by key players such as GrafTech International, SGL Carbon, Tokai Carbon, Showa Denko, Mitsubishi Chemical Group, HEG Limited, Graphite India Limited, Fangda Carbon New Material, Nippon Carbon, and Toyo Tanso. These companies compete through capacity scale, product quality, and long-term supply agreements with steelmakers and industrial customers. Leading players invest in advanced manufacturing technologies to improve electrode performance and consistency. Strategic capacity expansions and modernization projects strengthen cost efficiency. Companies also focus on specialty graphite products to diversify revenue streams. Sustainability initiatives, including energy-efficient production and recycling, gain importance. Geographic expansion into high-growth regions supports market reach. Strong relationships with automotive, energy, and electronics customers enhance demand stability. Continuous innovation and supply reliability remain key competitive factors shaping the market.
Key Player Analysis
- GrafTech International
- SGL Carbon
- Tokai Carbon
- Showa Denko
- Mitsubishi Chemical Group
- HEG Limited
- Graphite India Limited
- Fangda Carbon New Material
- Nippon Carbon
- Toyo Tanso
Recent Developments
- In 2025, Resonac (Showa Denko) officially announced it had issued the world's first verified Environmental Product Declaration (EPD) for graphite electrodes, with the EPDs for its Spanish and Austrian plants being issued on September 19, 2025. The company is the first graphite producer globally to achieve this milestone.
- In February 2024, Toyo Tanso expanded capacity for SiC semiconductor graphite products.
Report Coverage
The research report offers an in-depth analysis based on Product Type, Application, End-Use Industry and Geography. It details leading market players, providing an overview of their business, product offerings, investments, revenue streams, and key applications. Additionally, the report includes insights into the competitive environment, SWOT analysis, current market trends, as well as the primary drivers and constraints. Furthermore, it discusses various factors that have driven market expansion in recent years. The report also explores market dynamics, regulatory scenarios, and technological advancements that are shaping the industry. It assesses the impact of external factors and global economic changes on market growth. Lastly, it provides strategic recommendations for new entrants and established companies to navigate the complexities of the market.
Future Outlook
- Demand will grow steadily due to expanding electric steelmaking and recycling activities.
- Battery manufacturing will increase graphite consumption across energy storage systems.
- Electric vehicle adoption will strengthen long-term demand for carbon materials.
- Producers will invest in capacity expansion to meet rising industrial requirements.
- Technological improvements will enhance graphite performance and durability.
- Sustainability initiatives will influence production and sourcing strategies.
- Asia Pacific will continue to lead global production and consumption.
- Specialty graphite products will gain importance in high-performance applications.
- Supply chain diversification will become a strategic priority for manufacturers.
- Regulatory compliance will shape future investment and operational decisions.

Request a Free Sample
Fill in your details and we'll send you a free sample report.
- Sample data tables & charts
- Research methodology
Market Dynamics
Growth in Electric Arc Furnace Steelmaking
The shift toward electric arc furnace (EAF) steel production is driving demand for graphite electrodes, which are essential for efficient and low-emission steel recycling. Expanding steel capacity, especially in Asia Pacific, and increased recycling initiatives are reinforcing long-term demand for carbon and graphite products.
Expansion of Battery Manufacturing and Energy Storage
The rapid adoption of electric vehicles and grid-scale energy storage systems is increasing the need for high-quality graphite materials, particularly for battery anodes and thermal management. This trend is supported by government incentives, automotive investments, and the global energy transition.
Rising Demand for High-Performance Industrial Applications
Industries such as aerospace, electronics, and advanced manufacturing are increasingly using carbon fibers and specialty graphite for lightweight, heat-resistant, and high-conductivity applications. This diversification into high-performance uses is expanding the market beyond traditional steelmaking.
Sustainability and Regulatory Compliance
Growing emphasis on sustainable production, recycled materials, and compliance with environmental regulations is prompting manufacturers to invest in cleaner technologies and energy-efficient processes. This focus on ESG and regulatory standards is shaping sourcing strategies and creating opportunities for innovation.
Technological Advancements in Graphite Materials
Continuous improvements in graphite purity, conductivity, and engineered properties are enabling new applications in batteries, electronics, and thermal management. Collaboration between material suppliers and OEMs is driving the development of customized, high-value graphite solutions.
Need a Custom Version of This Report?
Tailor the scope, geography, or segments to your exact requirements.
- Custom geography or segment scope
- Direct access to our analyst team
Frequently Asked Questions
What is the current market size for the Carbon And Graphite Product market, and what is its projected size in 2032?
At what Compound Annual Growth Rate is the Carbon And Graphite Product market projected to grow between 2024 and 2032?
Which Carbon And Graphite Product market segment held the largest share in 2024?
What are the primary factors fueling the growth of the Carbon And Graphite Product market?
Who are the leading companies in the Carbon And Graphite Product market?
Which region commanded the largest share of the Carbon And Graphite Product market in 2024?
Table of Content
Chapter 1 Market Segmentation
- 1.1 Segmentation Framework
- 1.1.1 Product and Service Classification
- 1.1.2 Application and End-Use Classification
- 1.1.3 Technology and Solution Classification
- 1.1.4 Customer and Distribution Channel Classification
- 1.1.5 Geographic Segmentation
- 1.1.6 Market Segment Definitions and Boundaries
- 1.2 By Application
- 1.2.1 Electrodes
- 1.2.2 Refractories
- 1.2.3 Batteries and energy storage
- 1.2.4 Lubricants
- 1.3 By Product Type
- 1.3.1 Graphite electrodes
- 1.3.2 Carbon fibers
- 1.3.3 Specialty graphite products
- 1.4 By End-Use Industry
- 1.4.1 Energy and power
- 1.4.2 Automotive
- 1.4.3 Aerospace
- 1.4.4 Electronics
Chapter 2 Introduction
- 2.1 Report Objectives and Scope
- 2.2 Product Definition and Industry Terminology
- 2.3 Market Inclusions and Exclusions
- 2.4 Research Process
- 2.4.1 Primary Research and Expert Interviews
- 2.4.2 Secondary Research and Source Review
- 2.4.3 Top-Down and Bottom-Up Estimation
- 2.4.4 Data Triangulation and Verification
- 2.5 Market Size Measurement Basis
- 2.5.1 2024: USD 29,816 million → 2032: USD 46,456.69 million
- 2.6 Historical and Forecast Reference Periods
- 2.6.1 Base Year: 2024
- 2.6.2 Forecast Period: 2024-2032
- 2.7 Research Assumptions and Limitations
Chapter 3 Executive Summary
- 3.1 Market Snapshot and Key Findings
- 3.2 Base-Year Market Size, 2024
- 3.3 Forecast Market Size, 2032
- 3.4 Revenue and Volume Growth Outlook
- 3.5 Key Demand and Supply Indicators
- 3.6 Leading Market Segments
- 3.7 Fastest-Growing Market Opportunities
- 3.8 Regional Performance Highlights
- 3.9 Technology and Industry Transformation
- 3.10 Competitive Landscape Summary
- 3.11 Analyst View and Strategic Implications
Chapter 4 Global Carbon And Graphite Product Market Trends and Developments
- 4.1 Historical Industry Development
- 4.2 Recent Market Trends and Developments
- 4.3 Demand and Customer Behavior Trends
- 4.4 Technology and Product Innovation
- 4.5 Artificial Intelligence, Automation and Digitalization
- 4.6 Local Manufacturing and Supply Chain Realignment
- 4.7 Industry Partnerships, Mergers and Acquisitions
- 4.8 Sustainability and Circular Economy Developments
- 4.9 Government and Private Sector Investment Trends
- 4.10 Emerging Business Models and Commercialization
- 4.11 Industry Developments and Announcements
Chapter 5 Global Carbon And Graphite Product Market Production, Supply and Demand Analysis
- 5.1 Demand Trend and Consumption Analysis
- 5.2 Demand Forecast, 2024-2032
- 5.3 Production and Output Trend
- 5.4 Production and Output Forecast, 2024-2032
- 5.5 Installed Capacity and Capacity Utilization
- 5.6 Company-Wise Production Plants and Statistics
- 5.6.1 Installed Production Capacity
- 5.6.2 Actual Production
- 5.6.3 Planned Capacity and Expansion Targets
- 5.7 Supply Chain Structure and Procurement Trends
- 5.8 Supply-Demand Gap and Bottlenecks
- 5.9 Import Dependence and Sourcing Structure
- 5.10 Contract Manufacturing and Outsourcing
- 5.11 Regional Supply and Demand Concentration
Chapter 6 Global Carbon And Graphite Product Market Pricing Analysis
- 6.1 Pricing Structure and Measurement
- 6.2 Historical Pricing Trends
- 6.3 Pricing Outlook, 2024-2032
- 6.4 Average Selling Price and Unit Economics
- 6.5 Pricing by Product and Market Segment
- 6.6 Geographic Pricing Differences
- 6.7 Key Input, Energy, Labor and Logistics Costs
- 6.8 Contract Pricing and Purchasing Models
- 6.9 Pricing Sensitivity and Competitive Positioning
- 6.10 Price, Margin and Profitability Implications
Chapter 7 Global Carbon And Graphite Product Market Dynamics
- 7.1 Market Growth Drivers
- 7.1.1 Demand-Side Drivers
- 7.1.2 Technology and Innovation Drivers
- 7.1.3 Infrastructure and Investment Drivers
- 7.1.4 Regulatory and Policy Drivers
- 7.2 Market Restraints
- 7.2.1 Cost and Affordability Constraints
- 7.2.2 Technology and Adoption Barriers
- 7.2.3 Supply Chain and Operational Constraints
- 7.3 Market Challenges
- 7.3.1 Competitive Pressure and Margin Erosion
- 7.3.2 Skills, Infrastructure and Implementation Gaps
- 7.4 Emerging Market Opportunities
- 7.5 Market Dynamics Impact and Time-Horizon Assessment
Chapter 8 Global Carbon And Graphite Product Value Chain Analysis
- 8.1 Industry Value Chain Overview
- 8.2 Upstream Suppliers and Critical Inputs
- 8.3 Technology and Component Providers
- 8.4 Manufacturing or Service Delivery
- 8.5 Distribution, Channel Partners and Integrators
- 8.6 Downstream Applications and End Users
- 8.7 Value Addition and Profit Pools
- 8.8 Vertical Integration and Outsourcing
- 8.9 Supplier Concentration and Risk
- 8.10 Supply Chain Localization and Resilience
Chapter 9 Global Carbon And Graphite Product Market Regulations and Policies
- 9.1 Relevant Laws, Standards and Compliance Frameworks
- 9.2 Product, Service, Safety and Quality Requirements
- 9.3 Government Policies, Incentives and Subsidies
- 9.4 Imports, Exports and Trade Barriers
- 9.5 Public Procurement and Local Content Requirements
- 9.6 Environmental and Sustainability Compliance
- 9.7 Upcoming Policy Changes and Market Implications
Chapter 10 Global Carbon And Graphite Product Market Hotspots and Opportunities
- 10.1 Market Opportunity Mapping and Growth Hotspots
- 10.2 High-Growth Applications and Customer Groups
- 10.3 Underserved Markets and White-Space Opportunities
- 10.4 Emerging Technology and Product Opportunities
- 10.5 New Capacity and Investment Hotspots
- 10.6 Market Entry and Expansion Opportunities
- 10.7 Distribution and Partnership Opportunities
- 10.8 Near-Term and Long-Term Commercial Potential
- 10.9 Opportunity Attractiveness and Execution Risks
Chapter 11 Global Carbon And Graphite Product Market Outlook, 2024-2032
- 11.1 Market Size and Analysis
- 11.1.1 Revenue (Market Measurement: 2024: USD 29,816 million → 2032: USD 46,456.69 million)
- 11.1.2 Market Volume and Quantity Sold
- 11.1.3 Historical Market Size
- 11.1.4 Base-Year Market Size, 2024
- 11.2 Market Forecast, 2024-2032
- 11.2.1 Revenue Forecast to 2032
- 11.2.2 Volume Forecast to 2032
- 11.2.3 CAGR and Year-on-Year Growth
- 11.2.4 Incremental Revenue Opportunity
- 11.3 Forecast Assumptions and Scenario Analysis
- 11.3.1 Base-Case Forecast
- 11.3.2 Optimistic and Conservative Scenarios
- 11.3.3 Technology, Pricing and Policy Sensitivities
- 11.4 Market Attractiveness and Growth Outlook
Chapter 12 Global Carbon And Graphite Product Market Segmentation and Outlook
- 12.1 Segmentation Summary and Market Shares, 2024
- 12.2 Largest and Fastest-Growing Segments
- 12.3 By Application - Market Size and Forecast, 2024-2032
- 12.3.1 Segment Definition and Scope
- 12.3.2 Historical Market Size
- 12.3.3 Revenue Forecast, 2024-2032
- 12.3.4 Volume Forecast, 2024-2032
- 12.3.5 Base-Year Market Share, 2024
- 12.3.6 Segment CAGR and Growth Drivers
- 12.3.7 Subsegment Market Size and Forecast
- 12.3.7.1 Electrodes
- 12.3.7.2 Refractories
- 12.3.7.3 Batteries and energy storage
- 12.3.7.4 Lubricants
- 12.3.8 Subsegment Pricing and Adoption Trends
- 12.3.9 Leading Suppliers and Competition
- 12.3.10 Regional Demand and Opportunities
- 12.4 By Product Type - Market Size and Forecast, 2024-2032
- 12.4.1 Segment Definition and Scope
- 12.4.2 Historical Market Size
- 12.4.3 Revenue Forecast, 2024-2032
- 12.4.4 Volume Forecast, 2024-2032
- 12.4.5 Base-Year Market Share, 2024
- 12.4.6 Segment CAGR and Growth Drivers
- 12.4.7 Subsegment Market Size and Forecast
- 12.4.7.1 Graphite electrodes
- 12.4.7.2 Carbon fibers
- 12.4.7.3 Specialty graphite products
- 12.4.8 Subsegment Pricing and Adoption Trends
- 12.4.9 Leading Suppliers and Competition
- 12.4.10 Regional Demand and Opportunities
- 12.5 By End-Use Industry - Market Size and Forecast, 2024-2032
- 12.5.1 Segment Definition and Scope
- 12.5.2 Historical Market Size
- 12.5.3 Revenue Forecast, 2024-2032
- 12.5.4 Volume Forecast, 2024-2032
- 12.5.5 Base-Year Market Share, 2024
- 12.5.6 Segment CAGR and Growth Drivers
- 12.5.7 Subsegment Market Size and Forecast
- 12.5.7.1 Energy and power
- 12.5.7.2 Automotive
- 12.5.7.3 Aerospace
- 12.5.7.4 Electronics
- 12.5.8 Subsegment Pricing and Adoption Trends
- 12.5.9 Leading Suppliers and Competition
- 12.5.10 Regional Demand and Opportunities
- 12.6 Segment Growth Comparison
- 12.7 Segment Attractiveness and Priority Matrix
Chapter 13 Global Carbon And Graphite Product End-Use and Application Market Outlook
- 13.1 End-Use Industry and Customer Demand Structure
- 13.2 Leading Applications and Customer Groups
- 13.3 End-Use Market Size, Share and Forecast
- 13.4 Major End-Use Industry Deep Dives
- 13.4.1 Customer Requirements and Use Cases
- 13.4.2 Demand and Replacement Cycles
- 13.4.3 Technical and Regulatory Considerations
- 13.4.4 Purchasing and Procurement Models
- 13.4.5 Leading Vendors and Distribution Channels
- 13.4.6 Forecast and Commercial Opportunities
- 13.5 Emerging Applications and Cross-Segment Demand
- 13.6 End-Use Industry Investment Priorities
Chapter 14 Global Carbon And Graphite Product Geographic Market Outlook, 2024-2032
- 14.1 Regional Market Size and Share, 2024
- 14.2 Regional Market Forecast, 2024-2032
- 14.3 Regional Pricing, Production and Demand Differences
- 14.4 North America
- 14.4.1 United States
- 14.4.2 Canada
- 14.4.3 Mexico
- 14.5 Europe
- 14.5.1 Germany
- 14.5.2 France
- 14.5.3 Italy
- 14.5.4 United Kingdom
- 14.5.5 Spain
- 14.5.6 Poland
- 14.5.7 Russia
- 14.5.8 Netherlands
- 14.5.9 Belgium
- 14.5.10 Sweden
- 14.5.11 Denmark
- 14.5.12 Norway
- 14.5.13 Rest of Europe
- 14.6 Asia Pacific
- 14.6.1 China
- 14.6.2 India
- 14.6.3 Japan
- 14.6.4 South Korea
- 14.6.5 Thailand
- 14.6.6 Indonesia
- 14.6.7 Vietnam
- 14.6.8 Malaysia
- 14.6.9 Australia
- 14.6.10 Rest of Asia Pacific
- 14.7 Latin America
- 14.7.1 Brazil
- 14.7.2 Argentina
- 14.7.3 Colombia
- 14.7.4 Chile
- 14.7.5 Rest of Latin America
- 14.8 Middle East
- 14.8.1 Saudi Arabia
- 14.8.2 United Arab Emirates
- 14.8.3 Turkey
- 14.8.4 Israel
- 14.8.5 Iran
- 14.8.6 Rest of the Middle East
- 14.9 Africa
- 14.9.1 South Africa
- 14.9.2 Egypt
- 14.9.3 Nigeria
- 14.9.4 Morocco
- 14.9.5 Rest of Africa
- 14.10 Regional Investment, Policy and Supply Chain Differences
- 14.11 Regional Competitive Landscape
- 14.12 Geographic Growth Hotspots
Chapter 15 Global Carbon And Graphite Product Technology, Innovation and Sustainability Outlook
- 15.1 Technology Landscape and Maturity
- 15.2 Product, Process and Service Innovation
- 15.3 AI, Automation and Digital Tools in the Industry
- 15.4 Technology Adoption and Performance Benchmarking
- 15.5 Innovation Pipeline and R&D Investment
- 15.6 Patent and Intellectual Property Trends
- 15.7 Energy Efficiency and Resource Management
- 15.8 Sustainability, Recycling and Circularity
- 15.9 Technology Roadmap, 2024-2032
- 15.10 Risks of Obsolescence and Technology Substitution
Chapter 16 Global Carbon And Graphite Product Market Key Strategic Imperatives
- 16.1 Growth and Market Entry Priorities
- 16.2 High-Return Products and Segments
- 16.3 Pricing, Profitability and Cost Optimization
- 16.4 Technology Investment and Product Differentiation
- 16.5 Supply Chain Localization and Resilience
- 16.6 Distribution and Customer Acquisition
- 16.7 Partnership, Acquisition and Capacity Strategy
- 16.8 Regional Expansion Priorities
- 16.9 Short-, Medium- and Long-Term Actions
Chapter 17 Competition Outlook
- 17.1 Industry Competition Characteristics
- 17.2 Market Structure and Concentration
- 17.3 Market Share and Competitive Positioning, 2024
- 17.4 Company-Wise Revenue and Product Benchmarking
- 17.5 Production and Service Capacity Benchmarking
- 17.6 Technology, Pricing and Differentiation
- 17.7 Regional Footprint and Distribution Strength
- 17.8 Mergers, Acquisitions and Strategic Alliances
- 17.9 New Entrants and Competitive Threats
- 17.10 Porter's Five Forces and Industry Attractiveness
- 17.11 Competitive Outlook, 2024-2032
Chapter 18 Company Profiles
- 18.1 Company Coverage and Selection Criteria
- 18.2 GrafTech International
- 18.2.1 Business Description
- 18.2.2 Company Ownership and Geographic Presence
- 18.2.3 Product and Service Portfolio
- 18.2.4 Manufacturing and Operating Footprint
- 18.2.5 Production Capacity and Expansion Plans
- 18.2.6 Financial Performance and Investment
- 18.2.7 Market Share and Competitive Position
- 18.2.8 Technology and Innovation Capabilities
- 18.2.9 Strategic Alliances or Partnerships
- 18.2.10 Recent Developments
- 18.2.11 Growth Strategy and Outlook
- 18.3 SGL Carbon
- 18.4 Tokai Carbon
- 18.5 Showa Denko (Resonac)
- 18.6 Mitsubishi Chemical Group
- 18.7 HEG Limited
- 18.8 Graphite India Limited
- 18.9 Fangda Carbon New Material
- 18.10 Nippon Carbon
- 18.11 Toyo Tanso
- 18.12 Other Relevant Market Participants
Note: Every listed company is profiled on the structure shown under the first company. The company list is preliminary and may change based on research findings, market developments, data availability and client requirements.
Chapter 19 Disclaimer
- 19.1 Research and Forecast Disclaimer
- 19.2 Data Source and Estimation Limitations
Note: The depth of individual sections depends on data availability for this market. Volume, capacity, trade and other unit-based metrics are included where applicable.