
Market Overview
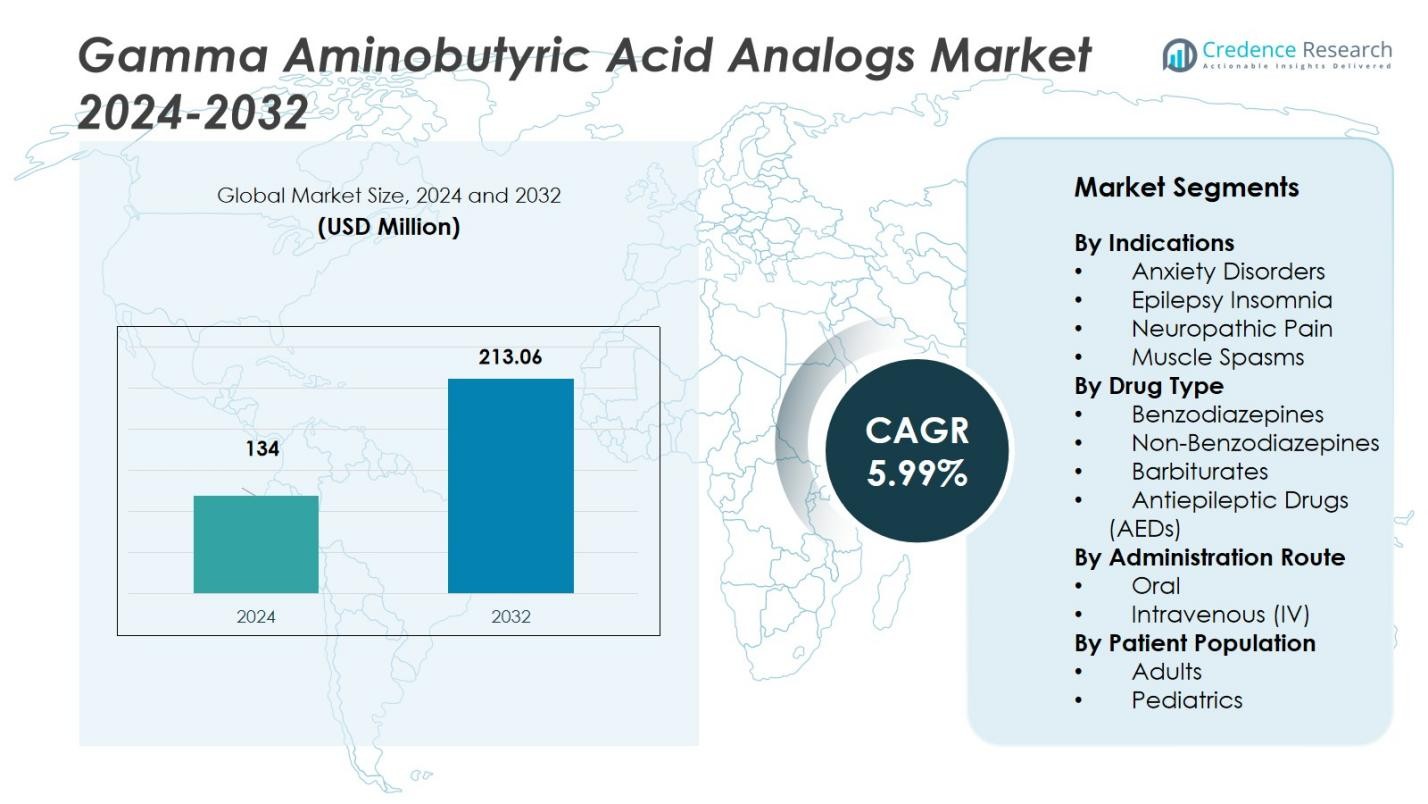
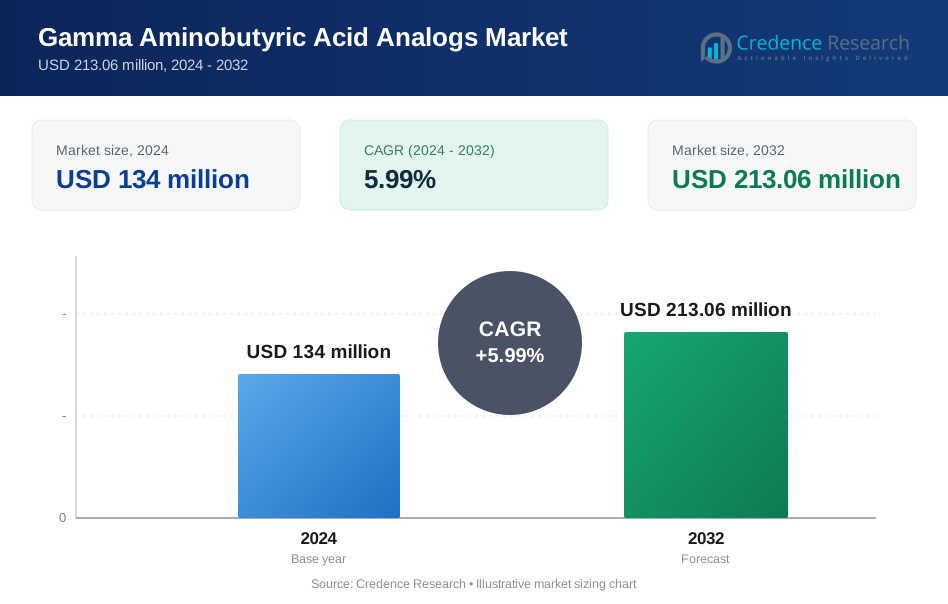
The Gamma Aminobutyric Acid Analogs Market size was valued at USD 134 million in 2024 and is anticipated to reach USD 213.06 million by 2032, at a CAGR of 5.99% during the forecast period.
| REPORT ATTRIBUTE | DETAILS |
|---|---|
| Historical Period | 2020-2023 |
| Base Year | 2024 |
| Forecast Period | 2025-2032 |
| Gamma Aminobutyric Acid Analogs Market Size 2024 | USD 134 Million |
| Gamma Aminobutyric Acid Analogs Market, CAGR | 5.99% |
| Gamma Aminobutyric Acid Analogs Market Size 2032 | USD 213.06 Million |
The Gamma Aminobutyric Acid Analogs Market is dominated by key players such as Pfizer, Inc., Ralington Pharma LLP, Arbor Pharmaceuticals, LLC, H. Lundbeck A/S, Marinus Pharmaceuticals Emerald Limited, Chemkart Co., Rosemont Pharmaceuticals, Sarv Biolabs Pvt., Amneal Pharmaceuticals LLC, and Merck KGaA. These companies are advancing the market through product innovations, strategic mergers, and geographic expansion. North America holds the largest market share, representing about 46% in 2024, driven by a well-established healthcare system and high demand for treatments for anxiety, insomnia, and neurological disorders. Europe follows with a 22% market share, supported by strong healthcare spending and research activities. The Asia Pacific region is expanding rapidly, contributing approximately 18% to the market share, particularly in China and India, where rising awareness and improving healthcare infrastructure are boosting demand for GABA analogs. These regional dynamics offer significant growth opportunities for the leading companies in the market.
Market Insights
- The Gamma Aminobutyric Acid Analogs Market size was valued at USD 134 million in 2024 and is anticipated to reach USD 213.06 million by 2032, growing at a CAGR of 5.99% during the forecast period.
- The market is driven by the increasing prevalence of neurological disorders, rising awareness of mental health, and advancements in drug development, particularly non-benzodiazepine alternatives.
- Key trends include the shift towards non-benzodiazepine medications, expanding treatment applications, and growing acceptance of mental health treatments across regions.
- The competitive landscape is dominated by companies like Pfizer, Inc., Merck KGaA, and Amneal Pharmaceuticals LLC, with strategic product innovations and regional expansion.
- North America holds the largest market share of about 46%, followed by Europe at 22%, while Asia Pacific is expected to witness the fastest growth, contributing around 18% of the market share.
Market Segmentation Analysis:
By Indications
The Anxiety Disorders segment dominates the Gamma Aminobutyric Acid (GABA) Analogs Market, accounting for approximately 35% of the total market share. This dominance is driven by the increasing prevalence of anxiety-related conditions globally and the effectiveness of GABA analogs in treating these disorders. The Neuropathic Pain sub-segment also shows strong growth, contributing around 25% to the market share. This is due to the rising incidence of chronic pain conditions, including diabetes and cancer, which require long-term pain management solutions.
- For instance, pregabalin, a widely used GABA analog, remains a frontline therapy for chronic neuropathic pain conditions, although novel derivatives like silagaba compounds are being developed to reduce CNS side effects while maintaining analgesic effects.
By Drug Type
The Benzodiazepines category holds the largest market share, accounting for approximately 40% of the Gamma Aminobutyric Acid analogs drug type segment. This dominance is due to their widespread use in treating anxiety, insomnia, and muscle spasms. However, the Non-Benzodiazepines sub-segment is gaining momentum, contributing around 30% to the market share. The shift towards non-benzodiazepine drugs is driven by a better safety profile and a growing preference for alternatives with lower dependency risks.
By Administration Route
The Oral administration route dominates the market, holding approximately 70% of the market share, as it is the most preferred and convenient method for administering GABA analogs. Oral formulations are highly popular due to their ease of use. The Intravenous (IV) route, while accounting for about 15% of the market share, is experiencing steady growth, especially in hospital settings where rapid onset of action is needed for acute conditions like epilepsy and muscle spasms.
- For instance, Haisco Pharmaceutical Group has developed an oral capsule of HSK16149, a GABA analogue that binds to calcium channel subreceptors to treat diabetic peripheral neuropathic pain, demonstrating significant efficacy in Chinese patients.
Key Growth Drivers
Increasing Prevalence of Anxiety and Neurological Disorders
The growing global prevalence of anxiety disorders, epilepsy, and neuropathic pain is a significant driver of the Gamma Aminobutyric Acid (GABA) Analogs Market. As the awareness and diagnosis of mental health and neurological conditions improve, more patients are being prescribed GABA analogs for effective symptom management. This rising demand for treatments, especially for anxiety and chronic pain management, is expected to accelerate market growth, as GABA analogs offer critical therapeutic benefits in these areas.
- For instance, the Gabapentin molecule was originally developed for epilepsy and is indicated for neuropathic pain such as post‑herpetic neuralgia showing how neurological demand supports the class.
Advancements in Drug Development and Formulations
Recent advancements in the development of new GABA analog formulations, such as non-benzodiazepine alternatives, have contributed to market growth. These innovations offer improved safety profiles, lower risk of dependency, and better patient compliance compared to traditional treatments like benzodiazepines. The continued focus on optimizing drug delivery systems and exploring new combinations further boosts the market by expanding the therapeutic scope of GABA analogs for a variety of indications, driving overall market expansion.
- For instance,ganaxolone, a synthetic neurosteroid approved as an antiseizure drug, which enhances GABAergic signaling with a better safety profile.
Rising Awareness and Acceptance of Mental Health Treatment
Increasing awareness about mental health issues and the acceptance of pharmacological interventions have contributed significantly to the growth of the Gamma Aminobutyric Acid Analogs Market. Public initiatives and healthcare reforms that prioritize mental health are encouraging more people to seek treatment for anxiety and sleep disorders. With a growing emphasis on improving mental well-being, more patients are turning to GABA analogs as effective solutions, thereby driving demand and expanding the market.
Key Trends & Opportunities
Shift Towards Non-Benzodiazepine Medications
There is a noticeable shift towards non-benzodiazepine medications in the Gamma Aminobutyric Acid Analogs Market. These alternatives, including newer drugs such as Z-drugs, offer similar therapeutic benefits without the same dependency risks associated with traditional benzodiazepines. This trend reflects growing patient and physician preference for medications that have a lower potential for abuse, addiction, and side effects, creating significant growth opportunities for non-benzodiazepine GABA analogs in the market.
- For instance, Thorne Research supplies PharmaGABA, a fermented GABA supplement used in stress and sleep management backed by clinical studies demonstrating anxiety relief.
Expansion of Treatment Applications
The expansion of GABA analogs in treating a broader range of conditions presents a key opportunity in the market. Beyond traditional uses for anxiety and epilepsy, GABA analogs are increasingly being explored for off-label uses such as in the treatment of neuropathic pain, muscle spasms, and insomnia. This diversification of therapeutic applications provides manufacturers with the opportunity to target additional patient populations, further boosting market demand and opening new avenues for growth.
- For instance, Haisco Pharmaceutical Group's HSK16149, an oral GABA analogue, demonstrated statistically significant pain reduction in diabetic peripheral neuropathic pain patients at doses of 40 mg and 80 mg daily, showing mean score improvements sustained consistently through 13 weeks in clinical trials.
Key Challenges
Regulatory Hurdles and Safety Concerns
Regulatory challenges and safety concerns regarding the long-term use of GABA analogs, particularly benzodiazepines, pose a significant obstacle in the market. Authorities and healthcare providers are increasingly cautious about the risk of dependence and side effects associated with these medications. These concerns lead to stringent regulations and approval processes, which may limit the availability and adoption of certain GABA analogs, thereby hindering market expansion.
High Competition from Alternative Therapies
The Gamma Aminobutyric Acid Analogs Market faces intense competition from alternative therapies, including antidepressants, anticonvulsants, and non-pharmacological treatments such as cognitive behavioral therapy. These alternatives often offer similar efficacy with fewer side effects or risks of dependency, making them attractive options for both patients and healthcare providers. The growing availability of such treatments poses a challenge for GABA analog manufacturers to maintain their market share and competitive edge.
Regional Analysis
North America
North America holds the leading position in the Gamma‑Aminobutyric Acid (GABA) analogs market with a share of about 46 % of the global market in 2024. Strong prevalence of anxiety, insomnia and neurological disorders combined with advanced healthcare infrastructure drive this dominance. The U.S. market is particularly influential due to early adoption of novel formulations and liberal reimbursement frameworks. Manufacturers increasingly focus on North America for product launches and clinical trials, reinforcing the region’s status as the primary growth engine for GABA analog therapies.
Europe
Europe accounts for approximately 22 % of the global GABA analogs market. The region benefits from high healthcare expenditure, regulatory support for neurological treatment and major pharmaceutical innovation hubs. Germany, the UK and France lead in sales volume and research activities. While growth is stable, it is somewhat constrained by cost‑containment measures and patent expiries. However, rising awareness of mental health disorders and expanding access to therapy are likely to support steady market expansion in the coming years.
Asia Pacific
Asia Pacific presents the fastest growth trajectory with a market share of around 18 % in 2024. The region’s growth is propelled by increasing incidence of neurological and neuro‑psychiatric disorders, expanding healthcare infrastructure and rising policy focus on mental health. Key markets such as China and India exhibit strong uptake of GABA analog drugs and generics. While per‑capita spend remains lower than Western markets, improving access and government initiatives are enabling rapid expansion of the GABA analogs segment.
Latin America
Latin America holds roughly 8 % of the global GABA analogs market. The region’s growth is supported by increasing diagnosis of neurological conditions, improving private healthcare coverage and rising pharmaceutical imports. Brazil and Argentina are the primary markets driving demand. Challenges include inconsistent reimbursement policies and regulatory delays, yet there is an opportunity for generic GABA analogs to capture market share given affordability pressures and expanding local production.
Middle East & Africa
The Middle East & Africa region contributes about 6 % to the global GABA analogs market. Growth in the region is driven by improving healthcare access, rising public‑private investment in neurologic and psychiatric care, and expansion of hospital networks. Gulf countries lead with strong adoption of advanced therapies, while wider Africa is gradually catching up. Nonetheless, constrained healthcare budgets and limited drug‑pipeline presence in rural areas may slow uptake, although generic substitution offers increasing potential.
Market Segmentations:
By Indications
- Anxiety Disorders
- Epilepsy Insomnia
- Neuropathic Pain
- Muscle Spasms
By Drug Type
- Benzodiazepines
- Non-Benzodiazepines
- Barbiturates
- Antiepileptic Drugs (AEDs)
By Administration Route
- Oral
- Intravenous (IV)
By Patient Population
- Adults
- Pediatrics
By Region
- North America
- U.S.
- Canada
- Mexico
- Europe
- Germany
- France
- U.K.
- Italy
- Spain
- Rest of Europe
- Asia Pacific
- China
- Japan
- India
- South Korea
- South-east Asia
- Rest of Asia Pacific
- Latin America
- Brazil
- Argentina
- Rest of Latin America
- Middle East & Africa
- GCC Countries
- South Africa
- Rest of the Middle East and Africa
Competitive Landscape
The competitive landscape of the gamma‑aminobutyric acid (GABA) Analogs Market is shaped by major players such as Pfizer, Inc., Ralington Pharma LLP, Arbor Pharmaceuticals, LLC, H. Lundbeck A/S, Marinus Pharmaceuticals Emerald Limited, Chemkart Co., Rosemont Pharmaceuticals, Sarv Biolabs Pvt., Amneal Pharmaceuticals LLC, and Merck KGaA. These companies compete actively through new product launches, strategic mergers, and geographic expansion to gain larger market share. Innovation plays a key role as firms focus on developing next‑generation GABA analogs with enhanced efficacy and safety, addressing areas such as epilepsy, anxiety, and neuropathic pain. Meanwhile, pricing pressures and generic competition force companies to optimise cost structures and build value through branded formulations and global distribution channels. Together, these strategic moves define how players position themselves and capture growth opportunities in this rapidly evolving space.
Key Player Analysis
- Merck KGaA
- Rosemont Pharmaceuticals
- Arbor Pharmaceuticals, LLC
- Amneal Pharmaceuticals LLC
- Sarv Biolabs Pvt.
- Chemkart Co.
- Lundbeck A/S
- Marinus Pharmaceuticals Emerald Limited
- Pfizer, Inc.
- Ralington Pharma LLP
Recent Developments
- In August 2023, Sage Therapeutics and Biogen Inc. received FDA approval for Zuranolone (brand name Zurzuvae™) for the treatment of postpartum depression in adults.
- In May 2024, Haisco Pharmaceutical Group Co., Ltd. received approval from China’s National Medical Products Administration (NMPA) for Crisugabalin (HSK16149) for the treatment of diabetic peripheral neuropathic pain.
- In February 2025, Immedica Pharma AB completed the acquisition of Marinus Pharmaceuticals, Inc.
Report Coverage
The research report offers an in-depth analysis based on Indication, Drug Type, Administration Route, Patient Population and Region. It details leading market players, providing an overview of their business, product offerings, investments, revenue streams, and key applications. Additionally, the report includes insights into the competitive environment, SWOT analysis, current market trends, as well as the primary drivers and constraints. Furthermore, it discusses various factors that have driven market expansion in recent years. The report also explores market dynamics, regulatory scenarios, and technological advancements that are shaping the industry. It assesses the impact of external factors and global economic changes on market growth. Lastly, it provides strategic recommendations for new entrants and established companies to navigate the complexities of the market.
Future Outlook
- Rising global incidence of neurological and psychiatric disorders will expand the demand for GABA analog therapies.
- Drug developers will increasingly focus on novel GABA analogs with improved safety profiles to meet unmet therapeutic needs.
- Orally administered GABA analog formulations will dominate growth, as convenience and outpatient use gain importance.
- Emerging markets in Asia Pacific will offer major expansion opportunities as healthcare infrastructure and awareness improve.
- The trend toward non‑benzodiazepine GABA analogs will accelerate, driven by regulatory pressures and dependency concerns.
- Strategic collaborations between pharmaceutical companies and biotech firms will increase to accelerate product pipelines and global reach.
- Generic versions of established GABA analogs will become more prevalent, intensifying competition and driving cost efficiencies.
- Increased use of digital health tools and telemedicine will boost patient access to GABA‑related therapies in mental health care.
- Market participants will expand indications for GABA analogs beyond traditional uses (e.g., neuropathic pain, insomnia) to capture new segments.
- Regulatory frameworks will evolve, potentially providing faster approval pathways for next‑gen GABA analogs, but companies must navigate safety and compliance challenges.
Request a Free Sample
Fill in your details and we'll send you a free sample report.
- Sample data tables & charts
- Research methodology
Need a Custom Version of This Report?
Tailor the scope, geography, or segments to your exact requirements.
- Custom geography or segment scope
- Direct access to our analyst team
Frequently Asked Questions
What is the current market size for Gamma Aminobutyric Acid Analogs Market, and what is its projected size in 2032?
At what Compound Annual Growth Rate is the Gamma Aminobutyric Acid Analogs Market projected to grow between 2025 and 2032?
Which Gamma Aminobutyric Acid Analogs Market segment held the largest share in 2024?
What are the primary factors fueling the growth of the Gamma Aminobutyric Acid Analogs Market?
Who are the leading companies in the Gamma Aminobutyric Acid Analogs Market?
Which region commanded the largest share of the Gamma Aminobutyric Acid Analogs Market in 2024?
Table of Content
Chapter 1. Report Introduction
- 1.1 Report Description & Purpose
- 1.1.1 Report Title & Market Definition
- 1.1.2 Unique Selling Propositions (USP) & Key Differentiators
- 1.1.3 Value Proposition for Stakeholders
- 1.2 Research Objectives
- 1.2.1 Market Sizing Objectives (Volume & Revenue)
- 1.2.2 Segmentation Objectives
- 1.2.3 Competitive Intelligence Objectives
- 1.2.4 Forecast & Scenario Objectives
- 1.3 Report Scope
- 1.3.1 Gamma Aminobutyric Acid Analogs Scope – Types & Subtypes Covered
- 1.3.2 Geographic Scope – Regions & Countries Covered
- 1.3.3 Historical Period, Base Year & Forecast Period (2024; forecast to 2032)
- 1.3.4 Inclusions & Exclusions
- 1.4 HS Code & Classification Framework
- 1.5 Currency, Units & Pricing Basis
- 1.6 Target Stakeholders
- 1.7 Limitations & Assumptions
Chapter 2. Executive Summary
- 2.1 Global Gamma Aminobutyric Acid Analogs Market Snapshot
- 2.1.1 Market Size – Historical (2024) & Forecast (2024-2032) (2024: USD 134 million → 2032: USD 213.06 million)
- 2.1.2 Volume & Revenue – Global Totals
- 2.1.3 Key Market Highlights – Top Five Facts
- 2.2 Gamma Aminobutyric Acid Analogs Market Segmentation Snapshot
- 2.2.1 Market Split by Region – 2024 vs. 2032
- 2.3 Competitive Snapshot
- 2.3.1 Top 10 Players by Revenue Share – 2024
- 2.3.2 Top 10 Players by Volume Share – 2024
- 2.3.3 Recent Strategic Developments (18-Month Summary)
- 2.4 Key Investment Highlights & Strategic Conclusions
Chapter 3. Gamma Aminobutyric Acid Analogs Market Dynamics & Industry Analysis
- 3.1 Market Overview & Context
- 3.1.1 Gamma Aminobutyric Acid Analogs Market Position in the Broader Automotive Value Chain
- 3.1.2 OEM vs. Replacement Market Dynamics
- 3.1.3 Market Maturity & Development Stage by Region
- 3.2 Gamma Aminobutyric Acid Analogs Market Drivers
- 3.3 Gamma Aminobutyric Acid Analogs Market Restraints & Challenges
- 3.4 Gamma Aminobutyric Acid Analogs Market Opportunities
- 3.5 Porter's Five Forces Analysis
- 3.5.1 Threat of New Entrants
- 3.5.2 Bargaining Power of Suppliers
- 3.5.3 Bargaining Power of Buyers
- 3.5.4 Threat of Substitutes
- 3.5.5 Competitive Rivalry – Intensity Assessment
- 3.6 Gamma Aminobutyric Acid Analogs Value Chain Analysis
- 3.6.1 Upstream – Raw Material/Input Suppliers
- 3.6.1.1 Raw Material/Input 1
- 3.6.1.2 Raw Material/Input 2
- 3.6.1.3 Raw Material/Input 3
- 3.6.2 Midstream – Production/Manufacturing/Service Delivery
- 3.6.2.1 Production/Process Overview
- 3.6.2.2 Key Facility Locations & Capacity by Manufacturer
- 3.6.3 Downstream – Distribution & End Consumer
- 3.6.3.1 Primary Channel – B2B/OEM
- 3.6.3.2 Secondary Channels – Dealer, Retail, Online, Direct
- 3.6.4 Value Chain Profitability Analysis
- 3.6.1 Upstream – Raw Material/Input Suppliers
- 3.7 PESTEL Analysis
- 3.7.1 Political Factors
- 3.7.2 Economic Factors
- 3.7.3 Social Factors
- 3.7.4 Technological Factors
- 3.7.5 Environmental Factors
- 3.7.6 Legal Factors
- 3.8 Gamma Aminobutyric Acid Analogs Supply Chain Analysis
- 3.8.1 Raw Material/Input Supply Risk Assessment
- 3.8.2 Manufacturing Concentration Risk (Geographic Exposure)
- 3.8.3 Trade Disruption Impact Analysis
- 3.9 Regulatory & Policy Landscape
Note: The regulatory and policy landscape section covers regulations based on their applicability to the market, Gamma Aminobutyric Acid Analogs category, geography, and scope of the study. Only regulatory frameworks with a material impact on operations, compliance, trade, sustainability, or market access are analyzed in detail.
Chapter 4. Key Investment Pockets & Opportunity Analysis
- 4.1 Gamma Aminobutyric Acid Analogs Market Attractiveness Analysis
- 4.1.1 By Region – Investment Attractiveness Matrix (Volume × CAGR)
- 4.2 Absolute Revenue Growth Opportunity
- 4.2.1 By Region – Absolute USD Growth Through 2032
- 4.3 Incremental Volume Opportunity
- 4.3.1 By Region – Incremental Volume Through 2032
- 4.3.2 Segment – Incremental Volume
- 4.4 Emerging Submarket Opportunity Deep Dive (Subject to Applicability)
- 4.5 Emerging Market Opportunity Scorecards
- 4.5.1 United States
- 4.5.2 Europe
- 4.5.3 Asia
- 4.5.4 Middle East & Africa
Note: Emerging Market Opportunity Scorecards will be included based on relevance and strategic importance. Regions listed are indicative and may vary depending on data availability and market dynamics.
Chapter 5. Gamma Aminobutyric Acid Analogs Import-Export Analysis & Trade Flows
- 5.1 Global Trade Overview
- 5.1.1 Global Export Value by Country (2024)
- 5.1.2 Global Export Volume by Country (2024)
- 5.1.3 Global Import Value by Country (2024)
- 5.1.4 Global Import Volume by Country (2024)
- 5.1.5 Net Trade Balance by Country (2024)
- 5.2 Export Analysis – Segment
- 5.2.1 Type 1 (HS Code)
- 5.2.2 Type 2 (HS Code)
- 5.2.3 Type 3 (HS Code)
- 5.2.4 Type 4 (HS Code)
- 5.2.5 Type 5 (HS Code)
- 5.3 Import Analysis – Segment
- 5.3.1 Type 1 (HS Code)
- 5.3.2 Type 2 (HS Code)
- 5.3.3 Type 3 (HS Code)
- 5.3.4 Type 4 (HS Code)
- 5.3.5 Type 5 (HS Code)
- 5.4 Average Unit Trade Prices
- 5.4.1 Average Export Price – Segment & Country
- 5.4.2 Average Import Price – Segment & Source Country
- 5.4.3 Price Trends (2024)
- 5.5 Key Trade Route Analysis
- 5.5.1 Trade Route 1
- 5.5.2 Trade Route 2
- 5.5.3 Trade Route 3
- 5.5.4 Trade Route 4
- 5.5.5 Trade Route 5
- 5.6 Trade Policy Impact Assessment
- 5.6.1 US Anti-Dumping & Section 301 Tariffs
- 5.6.2 EU Customs Union Impact
- 5.6.3 Major Free Trade Agreements
- 5.6.4 USMCA Rules of Origin
Note: Trade policy analysis will be included only where relevant to the Gamma Aminobutyric Acid Analogs market.
Chapter 6. Competitive Landscape & Company Benchmarking
- 6.1 Gamma Aminobutyric Acid Analogs Market Concentration & Structure
- 6.1.1 Herfindahl-Hirschman Index (HHI) – vs. 2024
- 6.1.2 Tier 1, Tier 2 & Tier 3 Market Structure
- 6.1.3 Global, Regional & Local Player Dynamics
- 6.2 Gamma Aminobutyric Acid Analogs Market Share Analysis – 2024
- 6.2.1 Global Revenue Share by Company
- 6.2.2 Global Volume Share by Company
- 6.2.3 Regional Revenue Share
- 6.2.4 Market Share Evolution ( vs. 2024)
- 6.2.5 OEM Segment Share by Company
- 6.2.6 Replacement Segment Share by Company
- 6.3 Production/Delivery Capacity & Facility Analysis
- 6.3.1 Global Installed Capacity
- 6.3.2 Capacity Utilization Rates
- 6.3.3 Production/Output Volume
- 6.3.4 Facility Locations & Capacity Map
- 6.3.5 Planned Capacity Additions
- 6.4 Gamma Aminobutyric Acid Analogs Competitive Benchmarking Matrix
- 6.4.1 Revenue, Volume, CAGR & Profitability Comparison
- 6.4.2 Channel Revenue Mix
- 6.4.3 Geographic Revenue Exposure
- 6.4.4 R&D Intensity
- 6.4.5 Sustainability Maturity
- 6.5 Strategic Developments in Gamma Aminobutyric Acid Analogs (Last 24 Months)
- 6.5.1 Mergers, Acquisitions & Divestments
- 6.5.2 New Gamma Aminobutyric Acid Analogs Launches
- 6.5.3 Facility Expansions
- 6.5.4 Strategic Alliances, Joint Ventures & Partnerships
- 6.5.5 Distribution Expansion & Market Entry
- 6.5.6 Sustainability & ESG Initiatives
- 6.6 Competitive Strategy Mapping
- 6.6.1 Leader, Challenger, Follower & Niche Classification
- 6.6.2 Pricing Strategy Comparison
- 6.6.3 Channel Strategy Matrix
Note: Strategic developments are included based on their materiality and the availability of reliable information.
Chapter 7. Global Gamma Aminobutyric Acid Analogs Market – By Distribution Channel
- 7.1 Segment Overview
- 7.1.1 Volume & Revenue Split by Channel (2024 & 2032)
- 7.1.2 Channel Mix Evolution (2024-2032)
Chapter 8. Regional Market Analysis – Global Overview
- 8.1 Global Regional Overview
- 8.1.1 Regional Volume Share
- 8.1.2 Regional Revenue Share
- 8.1.3 Regional Volume by Region
- 8.1.4 Regional Revenue by Region
- 8.1.5 Regional Forecast Through 2032
- 8.2 Cross-Regional Segment Analysis
- 8.2.1 By Distribution Channel
- 8.2.2 By Brand/Price Tier
Chapter 9. North America Gamma Aminobutyric Acid Analogs Market
- 9.1 United States
- 9.2 Canada
- 9.3 Mexico
Chapter 10. Europe Gamma Aminobutyric Acid Analogs Market
- 10.1 Germany
- 10.2 France
- 10.3 Italy
- 10.4 United Kingdom
- 10.5 Spain
- 10.6 Poland
- 10.7 Russia
- 10.8 Netherlands
- 10.9 Belgium
- 10.10 Sweden
- 10.11 Denmark
- 10.12 Norway
- 10.13 Rest of Europe
Chapter 11. Asia Pacific Gamma Aminobutyric Acid Analogs Market
- 11.1 China
- 11.2 India
- 11.3 Japan
- 11.4 South Korea
- 11.5 Thailand
- 11.6 Indonesia
- 11.7 Vietnam
- 11.8 Malaysia
- 11.9 Australia
- 11.10 Rest of Asia Pacific
Chapter 12. Latin America Gamma Aminobutyric Acid Analogs Market
- 12.1 Brazil
- 12.2 Argentina
- 12.3 Colombia
- 12.4 Chile
- 12.5 Rest of Latin America
Chapter 13. Middle East Gamma Aminobutyric Acid Analogs Market
- 13.1 Saudi Arabia
- 13.2 United Arab Emirates
- 13.3 Turkey
- 13.4 Israel
- 13.5 Iran
- 13.6 Rest of the Middle East
Chapter 14. Africa Gamma Aminobutyric Acid Analogs Market
- 14.1 South Africa
- 14.2 Egypt
- 14.3 Nigeria
- 14.4 Morocco
- 14.5 Rest of Africa
Chapter 15. Gamma Aminobutyric Acid Analogs Company Profiles
- 15.1 [Company 01]
- 15.1.1 Company Overview
- 15.1.2 Key Management Personnel
- 15.1.3 Products & Services Portfolio
- 15.1.4 Financial Performance
- 15.1.5 Key Market Focus & Geographic Presence
- 15.1.6 Recent Developments & Strategic Initiatives
Note: The company profile list is preliminary and may change based on research findings, market developments, data availability, and client requirements.
Chapter 16. Appendices
- Appendix A – List of Abbreviations & Acronyms
- Appendix B – Industry Classification Code Reference – Full Series
- Appendix C – Production & Capacity Data Tables
- Appendix D – End-Use & Demand Base Tables
- Appendix E – Consumption & Replacement Rate Assumptions
- Appendix F – ASP Reference Tables
- Appendix G – Manufacturing & Facility Database
- Appendix H – Import-Export Data Tables
- Appendix I – Regulatory Summary Tables
- Appendix J – Primary Research Participant List (Anonymized)
- Appendix K – Primary Research Questionnaire Framework
- Appendix L – Data Sources & Bibliography
- Appendix M – Market Size Divergence & Source Comparison
Chapter 17. Research Methodology
- 17.1 Research Framework & Philosophy
- 17.2 Secondary Research – Sources, Hierarchy & Data Extraction
- 17.3 Data Modeling – Bottom-Up & Top-Down Market Sizing
- 17.4 Primary Research – Stakeholder Framework, LOI & Sample Sizes
- 17.5 Forecast Methodology – Regression, Scenario & Sensitivity Analysis
- 17.6 Quality Control – Four-Layer Validation Framework
- 17.7 Limitations & Standard Assumptions
- 17.8 Disclaimer
