
Market Overview:
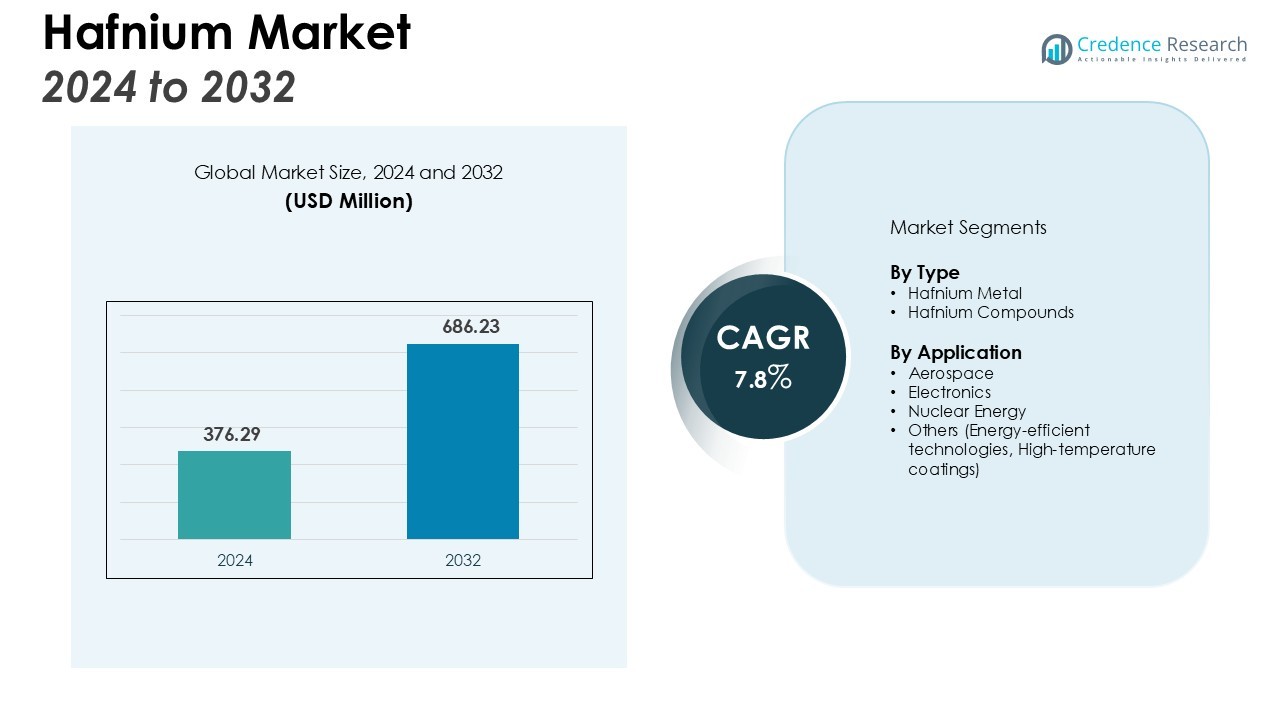
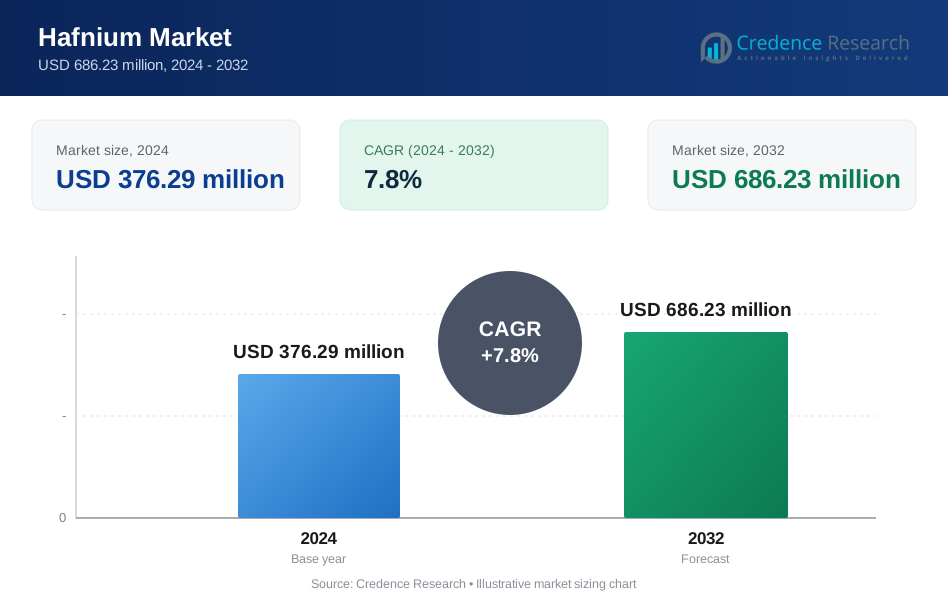
The Hafnium Market size was valued at USD 376.29 million in 2024 and is anticipated to reach USD 686.23 million by 2032, at a CAGR of 7.8 % during the forecast period (2024-2032).
| REPORT ATTRIBUTE | DETAILS |
|---|---|
| Historical Period | 2020-2023 |
| Base Year | 2024 |
| Forecast Period | 2025-2032 |
| Hafnium Market Size 2024 | USD 376.29 Million |
| Hafnium Market, CAGR | 7.8 % |
| Hafnium Market Size 2032 | USD 686.23 Million |
Market drivers include the growing demand for high-performance materials in aerospace and defense industries, where hafnium is utilized in the development of advanced turbine blades and rocket nozzles. Additionally, the expanding use of hafnium in nuclear reactors for neutron-absorbing control rods further propels market growth. Technological advancements in electronics and microelectronics are also expected to increase hafnium’s role in the manufacturing of integrated circuits, contributing to its growing market demand. Furthermore, the rise in demand for sustainable and energy-efficient technologies is boosting the use of hafnium in various sectors.
Regionally, North America holds the largest share of the hafnium market, driven by substantial demand in the aerospace and defense sectors, particularly in the United States. The Asia-Pacific region is expected to witness the highest growth due to increasing industrialization, especially in countries like China and India, which are driving the demand for high-performance materials. The growth of hafnium applications in emerging industries within these regions is poised to further elevate market dynamics.
Market Insights:
- The Hafnium market size was valued at USD 376.29 million in 2024 and is expected to reach USD 686.23 million by 2032.
- The market is driven by the rising demand for high-performance materials in aerospace and defense, particularly for advanced turbine blades and rocket nozzles.
- Growing use of hafnium in nuclear reactors, specifically in neutron-absorbing control rods, is fueling market growth.
- The increasing adoption of hafnium in electronics, especially for semiconductor manufacturing and integrated circuits, is expanding its market presence.
- The push for sustainable and energy-efficient technologies is further increasing hafnium's use in renewable energy systems like wind turbines and solar panels.
- North America holds the largest share of the Hafnium market, driven by strong demand from aerospace and defense sectors.
- Asia-Pacific is expected to experience the highest growth due to industrialization in countries like China and India, driving demand across aerospace, electronics, and energy sectors.
Market Drivers:
Increasing Demand for High-Performance Materials in Aerospace and Defense
The demand for hafnium in the aerospace and defense industries is a significant driver of the market. Hafnium is used in the production of advanced turbine blades and rocket nozzles, which are critical components for high-temperature applications. The material's ability to withstand extreme conditions makes it essential for the development of modern aircraft and spacecraft. As global defense spending continues to rise, hafnium’s demand in this sector will remain strong, particularly for defense technologies and systems.
Growing Use in Nuclear Energy Applications
Hafnium plays a crucial role in nuclear reactors, where it is used for manufacturing neutron-absorbing control rods. These rods are vital for regulating the fission process and maintaining reactor stability. With the global push for cleaner energy solutions, nuclear power generation is gaining momentum. This shift towards nuclear energy is increasing hafnium demand, making it an essential material for the energy sector.
- For instance, Westinghouse Electric Company has delivered more than 2,300 of its CR 82M-1 hafnium-tipped control rods for use in boiling water reactors globally.
Expanding Role in Electronics and Microelectronics
The rise of digital technologies and microelectronics further boosts hafnium’s market position. Hafnium is increasingly utilized in the semiconductor industry, particularly for manufacturing advanced integrated circuits. Its properties enhance the performance of microchips, which are integral to smartphones, computers, and other electronic devices. As demand for faster, more efficient electronics grows, so will the need for hafnium.
- For instance, in its 28 nm process technology, the Taiwan Semiconductor Manufacturing Company (TSMC) used a hafnium-oxide based material for the high-k dielectric layer, this layer was applied over a silicon dioxide layer with a thickness of just 2.0 nm.
Focus on Sustainable and Energy-Efficient Technologies
The increasing focus on sustainable and energy-efficient technologies is also driving hafnium market growth. Hafnium’s unique properties make it an attractive choice for applications in renewable energy and energy-efficient devices. It is used in the production of components that help improve the performance of energy systems, such as wind turbines and solar panels, contributing to its growing demand in various green technologies.
Market Trends:
Technological Advancements Driving Hafnium Market Applications
The Hafnium market is benefiting from technological advancements that enhance its applications across various industries. In aerospace and defense, innovation in high-performance materials is boosting hafnium’s role in the development of advanced turbine blades and rocket nozzles. Semiconductor manufacturers are also integrating hafnium in the production of high-efficiency microchips. This technological evolution is expanding hafnium's role in new applications, increasing its importance in industries requiring high-temperature resistance and superior electrical performance. With technological breakthroughs, hafnium is expected to play an even more vital role in emerging technologies.
- For instance, due to its high melting point of 2,233°C, hafnium is used in alloys for applications such as rocket nozzles and the control rods of nuclear reactors.
Growing Adoption of Hafnium in Green Technologies
The growing demand for sustainable and energy-efficient solutions is creating new trends in the hafnium market. Hafnium’s applications in renewable energy, particularly in wind turbines and solar power systems, are on the rise. As countries focus on reducing their carbon footprints, the need for energy-efficient technologies will drive increased demand for hafnium. Furthermore, the use of hafnium in energy-efficient consumer electronics is contributing to its growing presence in green technology markets. This shift towards sustainability is poised to expand hafnium's use in environmentally friendly applications, making it a key material in the transition to green energy solutions.
- For instance, the MAR-M247 alloy, which contains 1.5% hafnium, improves grain-boundary cohesion and creep resistance at temperatures of 1,100°C in advanced engine turbines.
Market Challenges Analysis:
High Cost and Limited Availability of Hafnium
One of the key challenges faced by the Hafnium market is the high cost and limited availability of the material. Hafnium is primarily sourced from zirconium ores, which are scarce and require complex extraction processes. The rarity of hafnium, coupled with its specialized applications, makes it an expensive material. This can restrict its use in certain industries, particularly for small-scale producers or applications with budget constraints. The need for alternative, cost-effective sources and extraction methods is vital for market expansion.
Dependence on Specific Industries
Hafnium’s market demand is heavily dependent on specific industries such as aerospace, nuclear energy, and electronics. Any fluctuations in these sectors, such as changes in defense spending or energy policies, can significantly impact hafnium’s demand. The specialized nature of its applications also means that hafnium is vulnerable to shifts in technological trends or industry-specific regulations. This reliance on a few key sectors makes the Hafnium market susceptible to economic and geopolitical uncertainties. Diversifying its applications and exploring new industries may help mitigate this challenge.
Market Opportunities:
Expansion in Emerging Applications and Industries
The Hafnium market presents significant opportunities for growth through the expansion of its applications in emerging industries. As global demand for high-performance materials in electronics and renewable energy increases, hafnium’s role in semiconductors and green technologies is expected to grow. Its properties make it ideal for enhancing the efficiency of solar panels, wind turbines, and energy-efficient electronics. With continued advancements in these sectors, hafnium is poised to play a more prominent role in sustainable energy solutions, presenting growth opportunities in environmentally friendly markets.
Potential in New Geographic Regions
Geographic expansion offers another opportunity for the Hafnium market. Regions such as Asia-Pacific, particularly China and India, are increasing their industrial production capabilities. These countries' growing demand for high-performance materials in aerospace, electronics, and energy sectors creates a robust opportunity for hafnium. By tapping into these emerging markets, hafnium producers can strengthen their presence and expand their customer base. Moreover, the expansion of nuclear energy projects worldwide provides additional avenues for growth, positioning hafnium as a critical material in meeting future energy needs.
Market Segmentation Analysis:
By Type
The Hafnium market is primarily segmented by type, with key categories including hafnium metal and hafnium compounds. Hafnium metal is widely used in aerospace and defense applications due to its high-temperature resistance and stability. This segment dominates the market due to its essential role in the production of turbine blades, rocket nozzles, and other critical aerospace components. Hafnium compounds, particularly hafnium carbide and hafnium dioxide, are used in high-performance coatings and semiconductor applications. The growth in electronics and semiconductor industries is driving the demand for hafnium compounds, contributing to their increasing share in the market.
- For instance, Siemens utilizes the nickel-based superalloy MAR-M 247, which contains hafnium to strengthen the material, in land-based turbines designed to operate at extreme temperatures reaching 1,038°C.
By Application
The Hafnium market is also segmented by application, with key industries including aerospace, electronics, nuclear energy, and others. The aerospace segment leads, driven by the demand for hafnium in turbine blades, rocket nozzles, and high-performance alloys. The electronics segment is growing rapidly as hafnium is increasingly used in semiconductor manufacturing, enhancing the performance of integrated circuits. The nuclear energy sector also contributes significantly to market growth, with hafnium used in neutron-absorbing control rods for reactors. Other applications, including energy-efficient technologies and high-temperature coatings, are also gaining traction as industries seek sustainable, high-performance materials. This diverse range of applications drives the continuous expansion of the Hafnium market.
- For instance, Westinghouse's CR 82 control rod design for nuclear reactors incorporates hafnium in the top six inches of the rod.
Segmentations:
By Type
- Hafnium Metal
- Hafnium Compounds
By Application
- Aerospace
- Electronics
- Nuclear Energy
- Others (Energy-efficient technologies, High-temperature coatings)
By Region
- North America
- U.S.
- Canada
- Mexico
- Europe
- Germany
- France
- U.K.
- Italy
- Spain
- Rest of Europe
- Asia Pacific
- China
- Japan
- India
- South Korea
- South-east Asia
- Rest of Asia Pacific
- Latin America
- Brazil
- Argentina
- Rest of Latin America
- Middle East & Africa
- GCC Countries
- South Africa
- Rest of the Middle East and Africa
Regional Analysis:
North America
North America holds the largest share of the Hafnium market, accounting for 38% of global demand. The region’s dominance is driven by substantial demand in the aerospace and defense sectors, particularly in the United States. The increasing need for high-performance materials in advanced turbine blades and rocket nozzles supports market growth. North America's focus on military technologies and space exploration ensures a continued rise in hafnium demand. As the defense and aerospace sectors expand, hafnium’s role in high-temperature applications remains crucial, solidifying its position in the region.
Asia-Pacific
Asia-Pacific represents 30% of the global Hafnium market, with significant growth projected in the coming years. The rapid industrialization of countries like China and India is driving the demand for hafnium in aerospace, electronics, and energy sectors. China’s investment in renewable energy and nuclear power plants has further boosted hafnium demand. As technology continues to advance across the region, hafnium’s applications in semiconductors and energy-efficient devices are expected to expand, creating a robust growth trajectory for the market.
Europe
Europe accounts for 25% of the global Hafnium market, with steady demand from the aerospace, automotive, and energy sectors. The region’s strong presence in advanced engineering and manufacturing ensures a consistent market for hafnium. Countries such as Germany, the United Kingdom, and France are key consumers, using hafnium in turbine blades and nuclear reactors. Europe's focus on renewable energy and technological innovation further increases hafnium’s presence in wind and solar applications, supporting its steady growth across the region.
Key Player Analysis:
- ACI Alloys Inc. (U.S.)
- Framatome Inc. (France)
- Alkane Resources Ltd. (Australia)
- American Elements (U.S.)
- Nanjing Youtian Metal Technology Co., Ltd. (China)
- Nantong JP New Material Tech co. LTD (China)
- Advanced Engineering Materials Limited (China)
- China Nuclear JingHuan Zirconium Industry Co., Ltd. (China)
- Neo Performance Materials Inc. (Canada)
- Westinghouse Electric Company LLC (China)
Competitive Analysis:
The Hafnium market is dominated by a few key players, including Framatome, ATI Inc., and Nanjing Youtian Metal Technology Co., Ltd., which hold significant market share due to their vertically integrated operations. These companies manage the entire supply chain, from raw material extraction to the production of final products, allowing them to maintain high-quality standards and optimize costs. Their technological expertise and established presence in industries like aerospace, nuclear energy, and electronics give them a competitive edge. Barriers to entry are high, limiting new competitors and reinforcing the market dominance of these established firms. Innovation in product development and strategic partnerships further enhance their positions, enabling them to meet the evolving demands of global industries and expand into new markets. The competitive landscape is shaped by these factors, with companies focusing on maintaining technological leadership and compliance with industry standards.
Recent Developments:
- In July 2025, Framatome announced the creation of a new center in Romans-sur-Isère, France, dedicated to additive manufacturing for producing metal 3D-printed mechanical components for the nuclear and defense sectors.
- In February 2025, Framatome entered into a strategic partnership with IBA to develop a network of cyclotrons in Europe and the United States for the industrial-scale production of Astatine-211, a radioisotope with potential applications in oncology.
Report Coverage:
The research report offers an in-depth analysis based on Type, Application and Region. It details leading market players, providing an overview of their business, product offerings, investments, revenue streams, and key applications. Additionally, the report includes insights into the competitive environment, SWOT analysis, current market trends, as well as the primary drivers and constraints. Furthermore, it discusses various factors that have driven market expansion in recent years. The report also explores market dynamics, regulatory scenarios, and technological advancements that are shaping the industry. It assesses the impact of external factors and global economic changes on market growth. Lastly, it provides strategic recommendations for new entrants and established companies to navigate the complexities of the market.
Future Outlook:
- The demand for hafnium will continue to rise due to its growing applications in aerospace and defense.
- Increased focus on renewable energy technologies will expand hafnium’s use in wind turbines and solar power systems.
- The semiconductor industry will drive further demand as hafnium plays a crucial role in manufacturing high-performance microchips.
- Hafnium’s use in nuclear reactors will remain significant, with ongoing investments in nuclear energy worldwide.
- The rise of energy-efficient technologies will create new opportunities for hafnium in various industrial applications.
- Technological advancements will enhance hafnium’s performance in electronics, increasing its adoption in microelectronics.
- The Asia-Pacific region is expected to witness high demand for hafnium as industrialization increases in countries like China and India.
- North America’s aerospace and defense sectors will continue to be a major driver for hafnium consumption.
- Strategic partnerships and acquisitions among key players will likely enhance innovation and market reach.
- Ongoing research in alternative hafnium sources and more cost-effective extraction methods could reduce material costs, opening new market opportunities.
Request a Free Sample
Fill in your details and we'll send you a free sample report.
- Sample data tables & charts
- Research methodology
Need a Custom Version of This Report?
Tailor the scope, geography, or segments to your exact requirements.
- Custom geography or segment scope
- Direct access to our analyst team
Frequently Asked Questions
What is the current market size for Hafnium, and what is its projected size in 2032?
At what Compound Annual Growth Rate is the Hafnium market projected to grow between 2024 and 2032?
Which Hafnium market segment held the largest share in 2024?
What are the primary factors fueling the growth of the Hafnium market?
Who are the leading companies in the Hafnium market?
Which region commanded the largest share of the Hafnium market in 2024?
Table of Content
Chapter 1. Report Introduction
- 1.1 Report Description & Purpose
- 1.1.1 Report Title & Market Definition
- 1.1.2 Unique Selling Propositions (USP) & Key Differentiators
- 1.1.3 Value Proposition for Stakeholders
- 1.2 Research Objectives
- 1.2.1 Market Sizing Objectives (Volume & Revenue)
- 1.2.2 Segmentation Objectives
- 1.2.3 Competitive Intelligence Objectives
- 1.2.4 Forecast & Scenario Objectives
- 1.3 Report Scope
- 1.3.1 Hafnium Scope – Types & Subtypes Covered
- 1.3.2 Geographic Scope – Regions & Countries Covered
- 1.3.3 Historical Period, Base Year & Forecast Period (2024; forecast to 2032)
- 1.3.4 Inclusions & Exclusions
- 1.4 HS Code & Classification Framework
- 1.5 Currency, Units & Pricing Basis
- 1.6 Target Stakeholders
- 1.7 Limitations & Assumptions
Chapter 2. Executive Summary
- 2.1 Global Hafnium Market Snapshot
- 2.1.1 Market Size – Historical (2024) & Forecast (2024-2032) (2024: USD 376.29 million → 2032: USD 686.23 million)
- 2.1.2 Volume & Revenue – Global Totals
- 2.1.3 Key Market Highlights – Top Five Facts
- 2.2 Hafnium Market Segmentation Snapshot
- 2.2.1 Market Split by Region – 2024 vs. 2032
- 2.3 Competitive Snapshot
- 2.3.1 Top 10 Players by Revenue Share – 2024
- 2.3.2 Top 10 Players by Volume Share – 2024
- 2.3.3 Recent Strategic Developments (18-Month Summary)
- 2.4 Key Investment Highlights & Strategic Conclusions
Chapter 3. Hafnium Market Dynamics & Industry Analysis
- 3.1 Market Overview & Context
- 3.1.1 Hafnium Market Position in the Broader Automotive Value Chain
- 3.1.2 OEM vs. Replacement Market Dynamics
- 3.1.3 Market Maturity & Development Stage by Region
- 3.2 Hafnium Market Drivers
- 3.3 Hafnium Market Restraints & Challenges
- 3.4 Hafnium Market Opportunities
- 3.5 Porter's Five Forces Analysis
- 3.5.1 Threat of New Entrants
- 3.5.2 Bargaining Power of Suppliers
- 3.5.3 Bargaining Power of Buyers
- 3.5.4 Threat of Substitutes
- 3.5.5 Competitive Rivalry – Intensity Assessment
- 3.6 Hafnium Value Chain Analysis
- 3.6.1 Upstream – Raw Material/Input Suppliers
- 3.6.1.1 Raw Material/Input 1
- 3.6.1.2 Raw Material/Input 2
- 3.6.1.3 Raw Material/Input 3
- 3.6.2 Midstream – Production/Manufacturing/Service Delivery
- 3.6.2.1 Production/Process Overview
- 3.6.2.2 Key Facility Locations & Capacity by Manufacturer
- 3.6.3 Downstream – Distribution & End Consumer
- 3.6.3.1 Primary Channel – B2B/OEM
- 3.6.3.2 Secondary Channels – Dealer, Retail, Online, Direct
- 3.6.4 Value Chain Profitability Analysis
- 3.6.1 Upstream – Raw Material/Input Suppliers
- 3.7 PESTEL Analysis
- 3.7.1 Political Factors
- 3.7.2 Economic Factors
- 3.7.3 Social Factors
- 3.7.4 Technological Factors
- 3.7.5 Environmental Factors
- 3.7.6 Legal Factors
- 3.8 Hafnium Supply Chain Analysis
- 3.8.1 Raw Material/Input Supply Risk Assessment
- 3.8.2 Manufacturing Concentration Risk (Geographic Exposure)
- 3.8.3 Trade Disruption Impact Analysis
- 3.9 Regulatory & Policy Landscape
Note: The regulatory and policy landscape section covers regulations based on their applicability to the market, Hafnium category, geography, and scope of the study. Only regulatory frameworks with a material impact on operations, compliance, trade, sustainability, or market access are analyzed in detail.
Chapter 4. Key Investment Pockets & Opportunity Analysis
- 4.1 Hafnium Market Attractiveness Analysis
- 4.1.1 By Region – Investment Attractiveness Matrix (Volume × CAGR)
- 4.2 Absolute Revenue Growth Opportunity
- 4.2.1 By Region – Absolute USD Growth Through 2032
- 4.3 Incremental Volume Opportunity
- 4.3.1 By Region – Incremental Volume Through 2032
- 4.3.2 Segment – Incremental Volume
- 4.4 Emerging Submarket Opportunity Deep Dive (Subject to Applicability)
- 4.5 Emerging Market Opportunity Scorecards
- 4.5.1 United States
- 4.5.2 Europe
- 4.5.3 Asia
- 4.5.4 Middle East & Africa
Note: Emerging Market Opportunity Scorecards will be included based on relevance and strategic importance. Regions listed are indicative and may vary depending on data availability and market dynamics.
Chapter 5. Hafnium Import-Export Analysis & Trade Flows
- 5.1 Global Trade Overview
- 5.1.1 Global Export Value by Country (2024)
- 5.1.2 Global Export Volume by Country (2024)
- 5.1.3 Global Import Value by Country (2024)
- 5.1.4 Global Import Volume by Country (2024)
- 5.1.5 Net Trade Balance by Country (2024)
- 5.2 Export Analysis – Segment
- 5.2.1 Type 1 (HS Code)
- 5.2.2 Type 2 (HS Code)
- 5.2.3 Type 3 (HS Code)
- 5.2.4 Type 4 (HS Code)
- 5.2.5 Type 5 (HS Code)
- 5.3 Import Analysis – Segment
- 5.3.1 Type 1 (HS Code)
- 5.3.2 Type 2 (HS Code)
- 5.3.3 Type 3 (HS Code)
- 5.3.4 Type 4 (HS Code)
- 5.3.5 Type 5 (HS Code)
- 5.4 Average Unit Trade Prices
- 5.4.1 Average Export Price – Segment & Country
- 5.4.2 Average Import Price – Segment & Source Country
- 5.4.3 Price Trends (2024)
- 5.5 Key Trade Route Analysis
- 5.5.1 Trade Route 1
- 5.5.2 Trade Route 2
- 5.5.3 Trade Route 3
- 5.5.4 Trade Route 4
- 5.5.5 Trade Route 5
- 5.6 Trade Policy Impact Assessment
- 5.6.1 US Anti-Dumping & Section 301 Tariffs
- 5.6.2 EU Customs Union Impact
- 5.6.3 Major Free Trade Agreements
- 5.6.4 USMCA Rules of Origin
Note: Trade policy analysis will be included only where relevant to the Hafnium market.
Chapter 6. Competitive Landscape & Company Benchmarking
- 6.1 Hafnium Market Concentration & Structure
- 6.1.1 Herfindahl-Hirschman Index (HHI) – vs. 2024
- 6.1.2 Tier 1, Tier 2 & Tier 3 Market Structure
- 6.1.3 Global, Regional & Local Player Dynamics
- 6.2 Hafnium Market Share Analysis – 2024
- 6.2.1 Global Revenue Share by Company
- 6.2.2 Global Volume Share by Company
- 6.2.3 Regional Revenue Share
- 6.2.4 Market Share Evolution ( vs. 2024)
- 6.2.5 OEM Segment Share by Company
- 6.2.6 Replacement Segment Share by Company
- 6.3 Production/Delivery Capacity & Facility Analysis
- 6.3.1 Global Installed Capacity
- 6.3.2 Capacity Utilization Rates
- 6.3.3 Production/Output Volume
- 6.3.4 Facility Locations & Capacity Map
- 6.3.5 Planned Capacity Additions
- 6.4 Hafnium Competitive Benchmarking Matrix
- 6.4.1 Revenue, Volume, CAGR & Profitability Comparison
- 6.4.2 Channel Revenue Mix
- 6.4.3 Geographic Revenue Exposure
- 6.4.4 R&D Intensity
- 6.4.5 Sustainability Maturity
- 6.5 Strategic Developments in Hafnium (Last 24 Months)
- 6.5.1 Mergers, Acquisitions & Divestments
- 6.5.2 New Hafnium Launches
- 6.5.3 Facility Expansions
- 6.5.4 Strategic Alliances, Joint Ventures & Partnerships
- 6.5.5 Distribution Expansion & Market Entry
- 6.5.6 Sustainability & ESG Initiatives
- 6.6 Competitive Strategy Mapping
- 6.6.1 Leader, Challenger, Follower & Niche Classification
- 6.6.2 Pricing Strategy Comparison
- 6.6.3 Channel Strategy Matrix
Note: Strategic developments are included based on their materiality and the availability of reliable information.
Chapter 7. Global Hafnium Market – By Distribution Channel
- 7.1 Segment Overview
- 7.1.1 Volume & Revenue Split by Channel (2024 & 2032)
- 7.1.2 Channel Mix Evolution (2024-2032)
Chapter 8. Regional Market Analysis – Global Overview
- 8.1 Global Regional Overview
- 8.1.1 Regional Volume Share
- 8.1.2 Regional Revenue Share
- 8.1.3 Regional Volume by Region
- 8.1.4 Regional Revenue by Region
- 8.1.5 Regional Forecast Through 2032
- 8.2 Cross-Regional Segment Analysis
- 8.2.1 By Distribution Channel
- 8.2.2 By Brand/Price Tier
Chapter 9. North America Hafnium Market
- 9.1 United States
- 9.2 Canada
- 9.3 Mexico
Chapter 10. Europe Hafnium Market
- 10.1 Germany
- 10.2 France
- 10.3 Italy
- 10.4 United Kingdom
- 10.5 Spain
- 10.6 Poland
- 10.7 Russia
- 10.8 Netherlands
- 10.9 Belgium
- 10.10 Sweden
- 10.11 Denmark
- 10.12 Norway
- 10.13 Rest of Europe
Chapter 11. Asia Pacific Hafnium Market
- 11.1 China
- 11.2 India
- 11.3 Japan
- 11.4 South Korea
- 11.5 Thailand
- 11.6 Indonesia
- 11.7 Vietnam
- 11.8 Malaysia
- 11.9 Australia
- 11.10 Rest of Asia Pacific
Chapter 12. Latin America Hafnium Market
- 12.1 Brazil
- 12.2 Argentina
- 12.3 Colombia
- 12.4 Chile
- 12.5 Rest of Latin America
Chapter 13. Middle East Hafnium Market
- 13.1 Saudi Arabia
- 13.2 United Arab Emirates
- 13.3 Turkey
- 13.4 Israel
- 13.5 Iran
- 13.6 Rest of the Middle East
Chapter 14. Africa Hafnium Market
- 14.1 South Africa
- 14.2 Egypt
- 14.3 Nigeria
- 14.4 Morocco
- 14.5 Rest of Africa
Chapter 15. Hafnium Company Profiles
- 15.1 [Company 01]
- 15.1.1 Company Overview
- 15.1.2 Key Management Personnel
- 15.1.3 Products & Services Portfolio
- 15.1.4 Financial Performance
- 15.1.5 Key Market Focus & Geographic Presence
- 15.1.6 Recent Developments & Strategic Initiatives
Note: The company profile list is preliminary and may change based on research findings, market developments, data availability, and client requirements.
Chapter 16. Appendices
- Appendix A – List of Abbreviations & Acronyms
- Appendix B – Industry Classification Code Reference – Full Series
- Appendix C – Production & Capacity Data Tables
- Appendix D – End-Use & Demand Base Tables
- Appendix E – Consumption & Replacement Rate Assumptions
- Appendix F – ASP Reference Tables
- Appendix G – Manufacturing & Facility Database
- Appendix H – Import-Export Data Tables
- Appendix I – Regulatory Summary Tables
- Appendix J – Primary Research Participant List (Anonymized)
- Appendix K – Primary Research Questionnaire Framework
- Appendix L – Data Sources & Bibliography
- Appendix M – Market Size Divergence & Source Comparison
Chapter 17. Research Methodology
- 17.1 Research Framework & Philosophy
- 17.2 Secondary Research – Sources, Hierarchy & Data Extraction
- 17.3 Data Modeling – Bottom-Up & Top-Down Market Sizing
- 17.4 Primary Research – Stakeholder Framework, LOI & Sample Sizes
- 17.5 Forecast Methodology – Regression, Scenario & Sensitivity Analysis
- 17.6 Quality Control – Four-Layer Validation Framework
- 17.7 Limitations & Standard Assumptions
- 17.8 Disclaimer
